0 Wake Forest Case Competition Canyons Craft Soda Team: Eshna Bhaduri, Joshua Golub, Matt Niemczak,...
16
1 Wake Forest Case Competition Canyons Craft Soda Team: Eshna Bhaduri, Joshua Golub, Matt Niemczak, Shawn Tydlaska, & Victoria Hon
-
Upload
christal-skinner -
Category
Documents
-
view
229 -
download
0
Transcript of 0 Wake Forest Case Competition Canyons Craft Soda Team: Eshna Bhaduri, Joshua Golub, Matt Niemczak,...
1
Wake Forest Case Competition
Canyons Craft Soda Team:
Eshna Bhaduri, Joshua Golub, Matt Niemczak, Shawn Tydlaska, & Victoria Hon
1. Executive Summary
2. Situational Assessment
3. New Product Introduction
4. Right to Play, Right to Win
5. Consumer Engagement & Execution Plan
6. Impact Assessment
7. Appendix
Agenda
3
Executive Summary
Source: 1Mintel Report – “Carbonated Soft Drinks – US – June 2014”
4
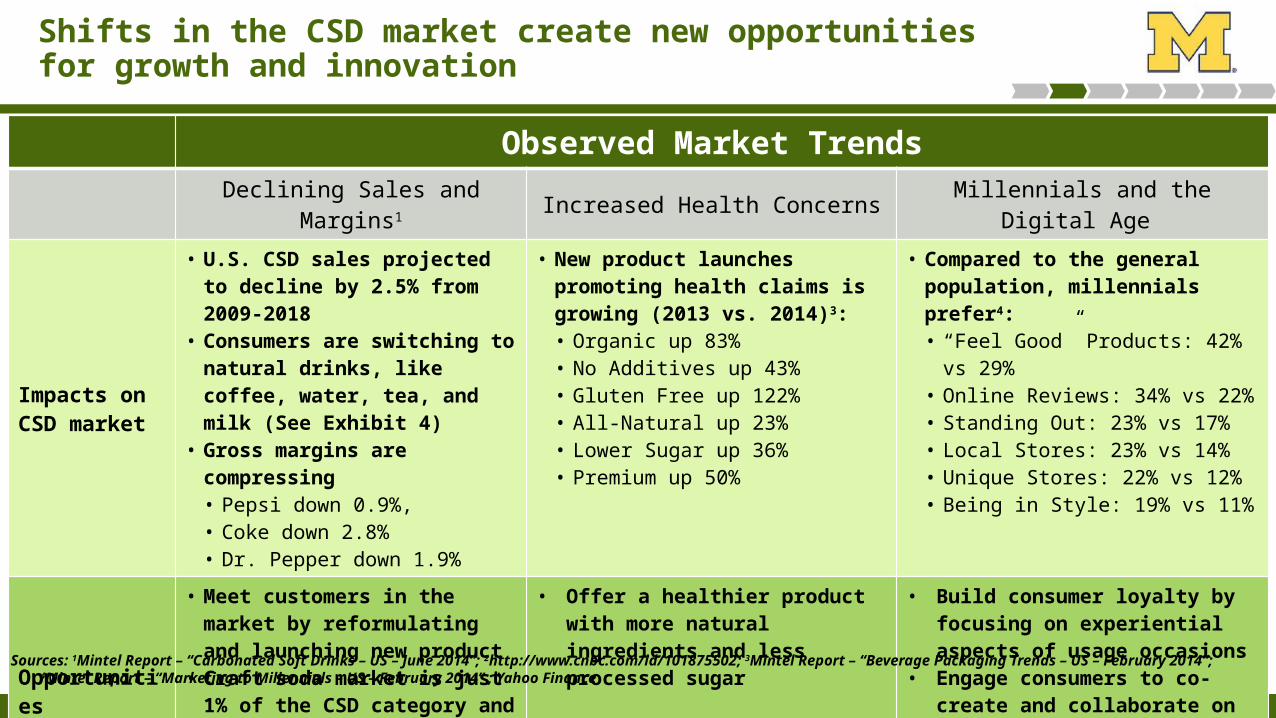
Observed Market Trends
Declining Sales and Margins1 Increased Health Concerns Millennials and the Digital Age
Impacts on CSD market
• U.S. CSD sales projected to decline by 2.5% from 2009-2018
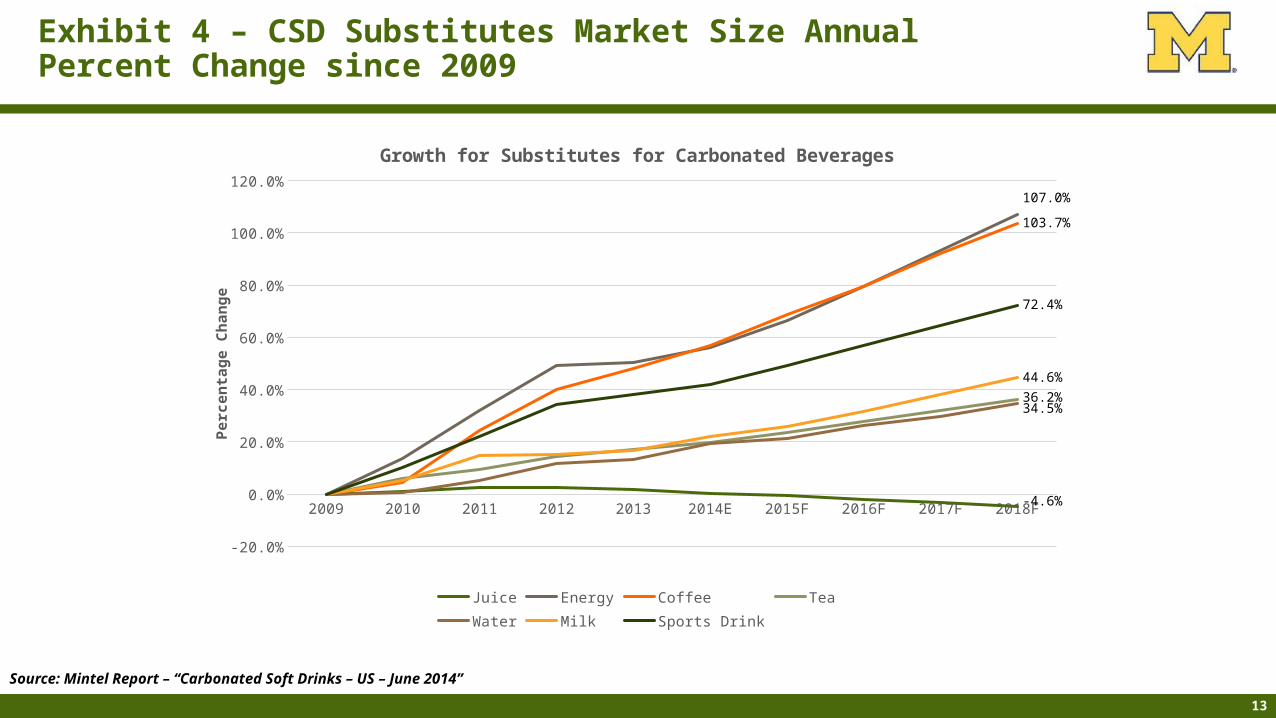
• Consumers are switching to natural drinks, like coffee, water, tea, and milk (See Exhibit 4)
• Gross margins are compressing• Pepsi down 0.9%, • Coke down 2.8% • Dr. Pepper down 1.9%
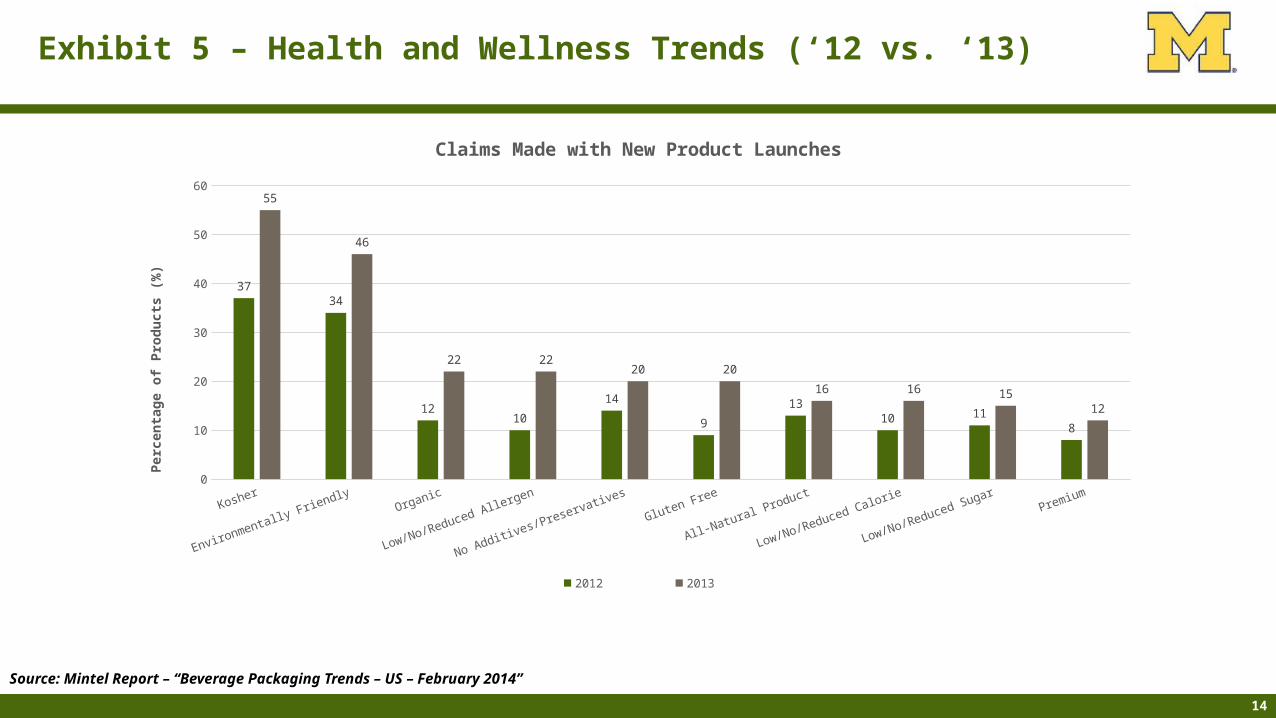
• New product launches promoting health claims is growing (2013 vs. 2014)3:• Organic up 83%• No Additives up 43%• Gluten Free up 122%• All-Natural up 23%• Lower Sugar up 36%• Premium up 50%
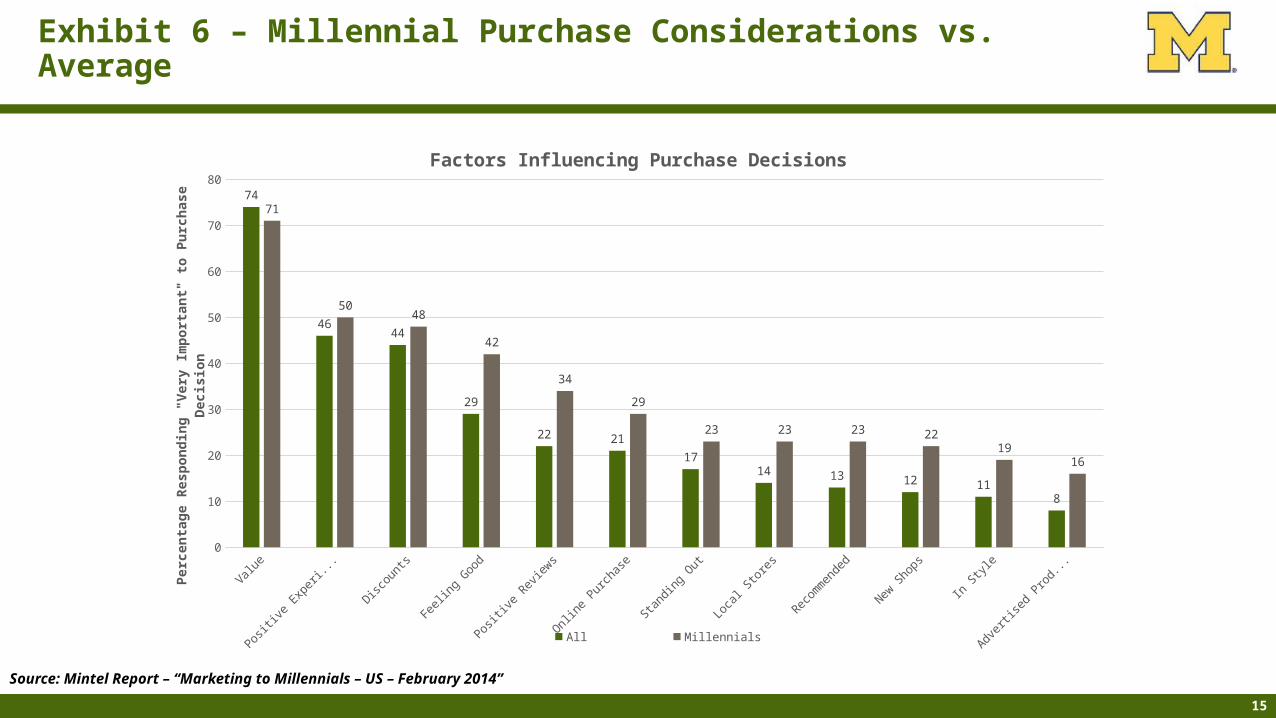
• Compared to the general population, millennials prefer4:• “Feel Good” Products: 42% vs 29%• Online Reviews: 34% vs 22%• Standing Out: 23% vs 17%• Local Stores: 23% vs 14%• Unique Stores: 22% vs 12%• Being in Style: 19% vs 11%
Opportunities
• Meet customers in the market by reformulating and launching new product
• Craft soda market is just 1% of the CSD category and comparable brands have projected revenue increases of 15% per year2
• Offer a healthier product with more natural ingredients and less processed sugar
• Build consumer loyalty by focusing on experiential aspects of usage occasions
• Engage consumers to co-create and collaborate on brand’s image and identity
Shifts in the CSD market create new opportunities for growth and innovation
Sources: 1Mintel Report – “Carbonated Soft Drinks – US – June 2014”; 2http://www.cnbc.com/id/101875502; 3Mintel Report – “Beverage Packaging Trends – US – February 2014”; 4Mintel Report – “Marketing to Millennials – US – February 2014” ; Yahoo Finance
5
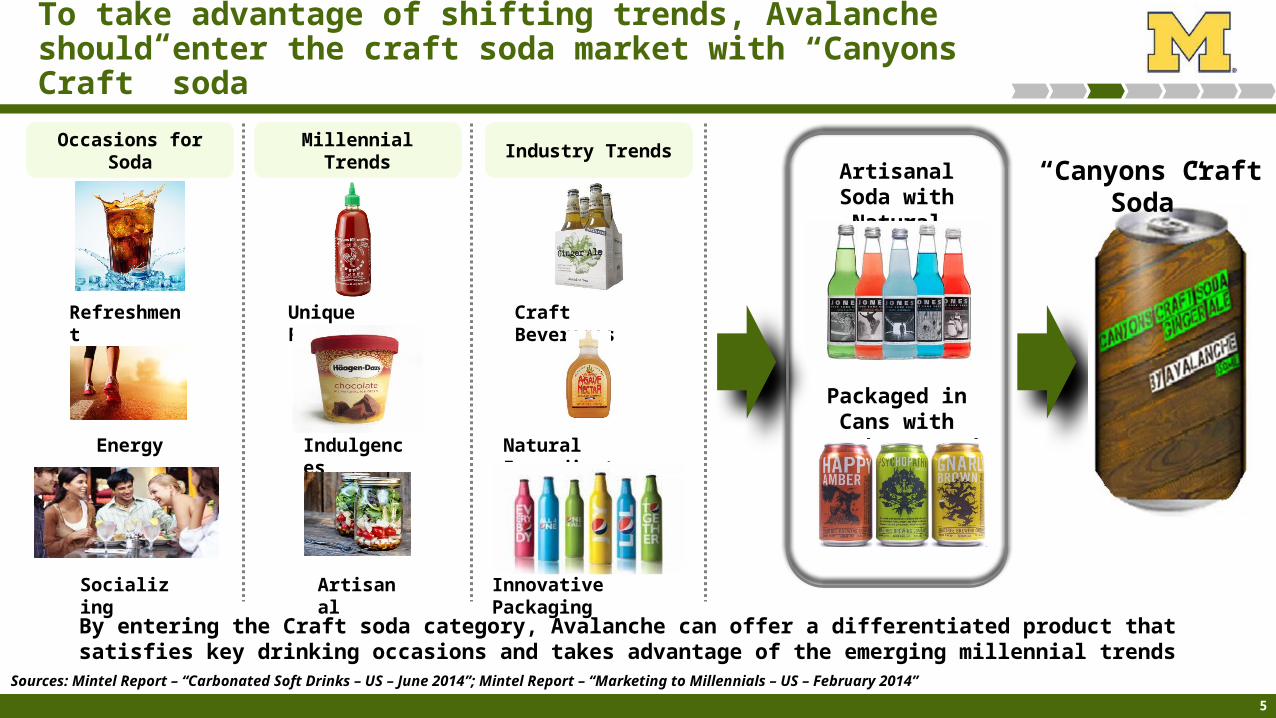
To take advantage of shifting trends, Avalanche should enter the craft soda market with “Canyons Craft” soda
Millennial Trends
Indulgences
Unique Flavors
Artisanal
Artisanal Soda with Natural Ingredients
Packaged in Cans with Trendy Artwork
Occasions for Soda
Refreshment
Socializing
Energy
Industry Trends
Craft Beverages
Natural Ingredients
Innovative Packaging
By entering the Craft soda category, Avalanche can offer a differentiated product that satisfies key drinking occasions and takes advantage of the emerging millennial trends
Sources: Mintel Report – “Carbonated Soft Drinks – US – June 2014”; Mintel Report – “Marketing to Millennials – US – February 2014”
“Canyons Craft Soda”
6
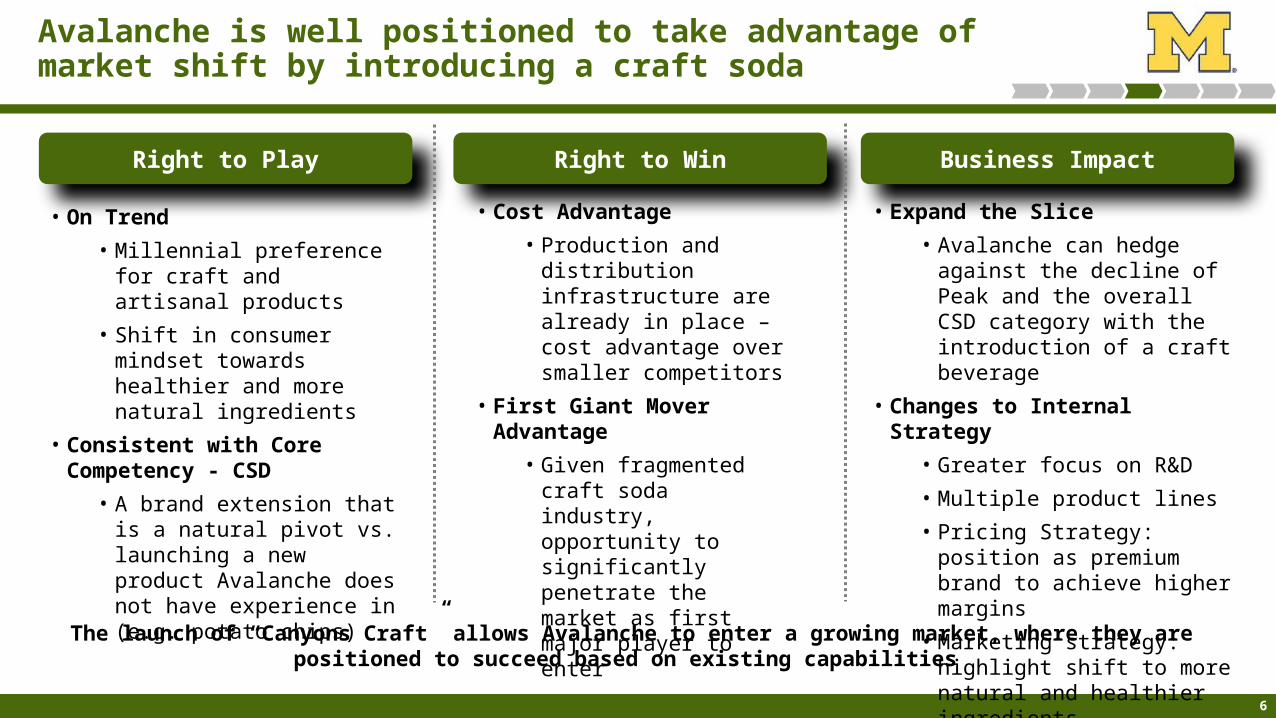
Right to Win Business ImpactRight to Play
• On Trend
• Millennial preference for craft and artisanal products
• Shift in consumer mindset towards healthier and more natural ingredients
• Consistent with Core Competency - CSD
• A brand extension that is a natural pivot vs. launching a new product Avalanche does not have experience in (e.g. potato chips)
• Cost Advantage
• Production and distribution infrastructure are already in place – cost advantage over smaller competitors
• First Giant Mover Advantage
• Given fragmented craft soda industry, opportunity to significantly penetrate the market as first major player to enter
• Expand the Slice
• Avalanche can hedge against the decline of Peak and the overall CSD category with the introduction of a craft beverage
• Changes to Internal Strategy
• Greater focus on R&D
• Multiple product lines
• Pricing Strategy: position as premium brand to achieve higher margins
• Marketing strategy: highlight shift to more natural and healthier ingredients
Avalanche is well positioned to take advantage of market shift by introducing a craft soda
The launch of “Canyons Craft” allows Avalanche to enter a growing market, where they are positioned to succeed based on existing capabilities
7
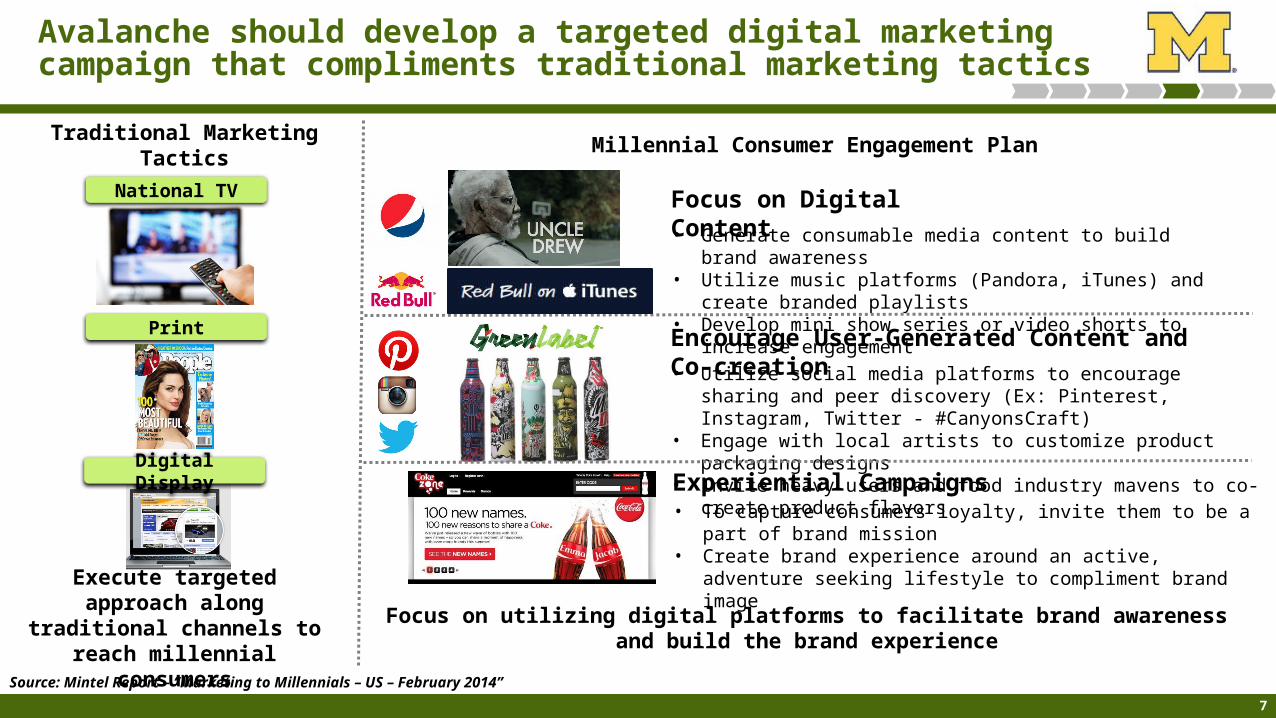
Traditional Marketing Tactics Millennial Consumer Engagement Plan
Focus on Digital Content• Generate consumable media content to build brand awareness • Utilize music platforms (Pandora, iTunes) and create branded playlists• Develop mini show series or video shorts to increase engagement
Encourage User-Generated Content and Co-creation• Utilize social media platforms to encourage sharing and peer discovery
(Ex: Pinterest, Instagram, Twitter - #CanyonsCraft)• Engage with local artists to customize product packaging designs• Invite heavy users and food industry mavens to co-create product flavors
Experiential Campaigns • To capture consumers loyalty, invite them to be a part of brand mission • Create brand experience around an active, adventure seeking lifestyle to
compliment brand image
National TV
Digital Display
Avalanche should develop a targeted digital marketing campaign that compliments traditional marketing tactics
Execute targeted approach along traditional channels to reach millennial consumers
Focus on utilizing digital platforms to facilitate brand awareness and build the brand experience
Source: Mintel Report – “Marketing to Millennials – US – February 2014”
8
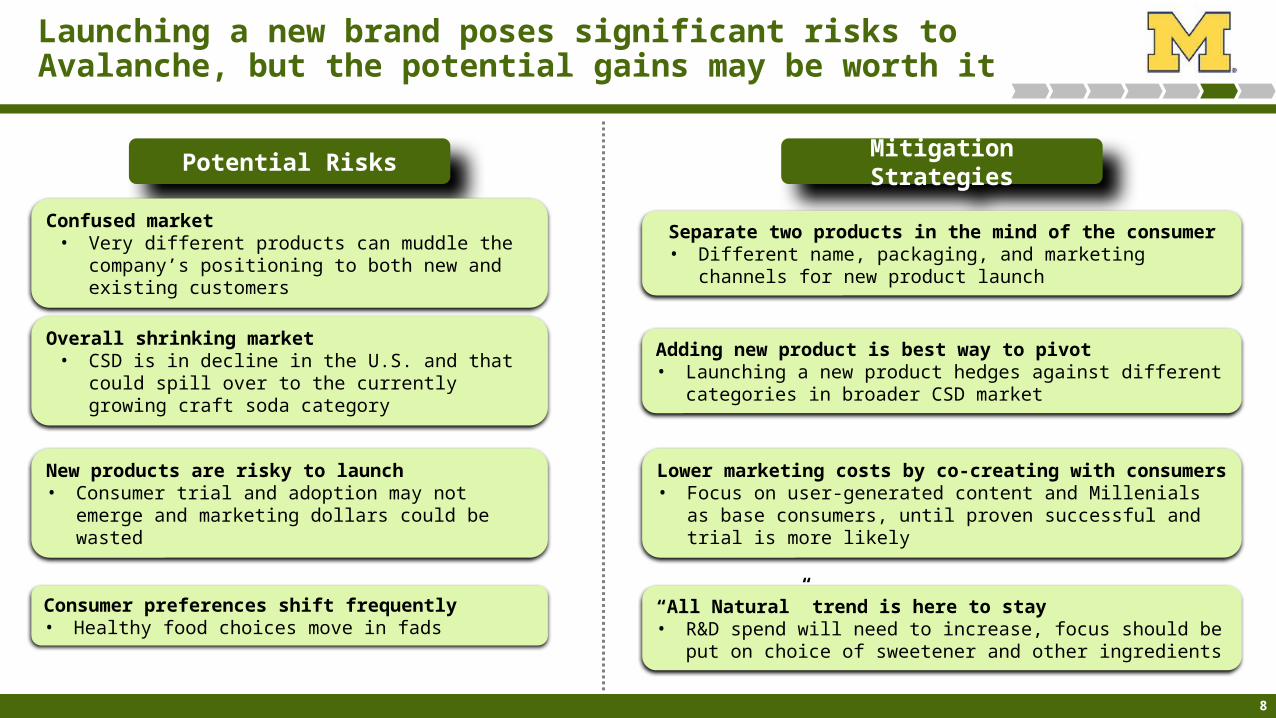
Launching a new brand poses significant risks to Avalanche, but the potential gains may be worth it
Potential Risks Mitigation Strategies
Confused market• Very different products can muddle the company’s
positioning to both new and existing customers
Overall shrinking market• CSD is in decline in the U.S. and that could spill over
to the currently growing craft soda category
Separate two products in the mind of the consumer• Different name, packaging, and marketing channels for new
product launch
Adding new product is best way to pivot • Launching a new product hedges against different categories in
broader CSD market
New products are risky to launch • Consumer trial and adoption may not emerge and
marketing dollars could be wasted
Lower marketing costs by co-creating with consumers• Focus on user-generated content and Millenials as base
consumers, until proven successful and trial is more likely
Consumer preferences shift frequently• Healthy food choices move in fads
“All Natural” trend is here to stay• R&D spend will need to increase, focus should be put on choice
of sweetener and other ingredients

9
Appendix
10
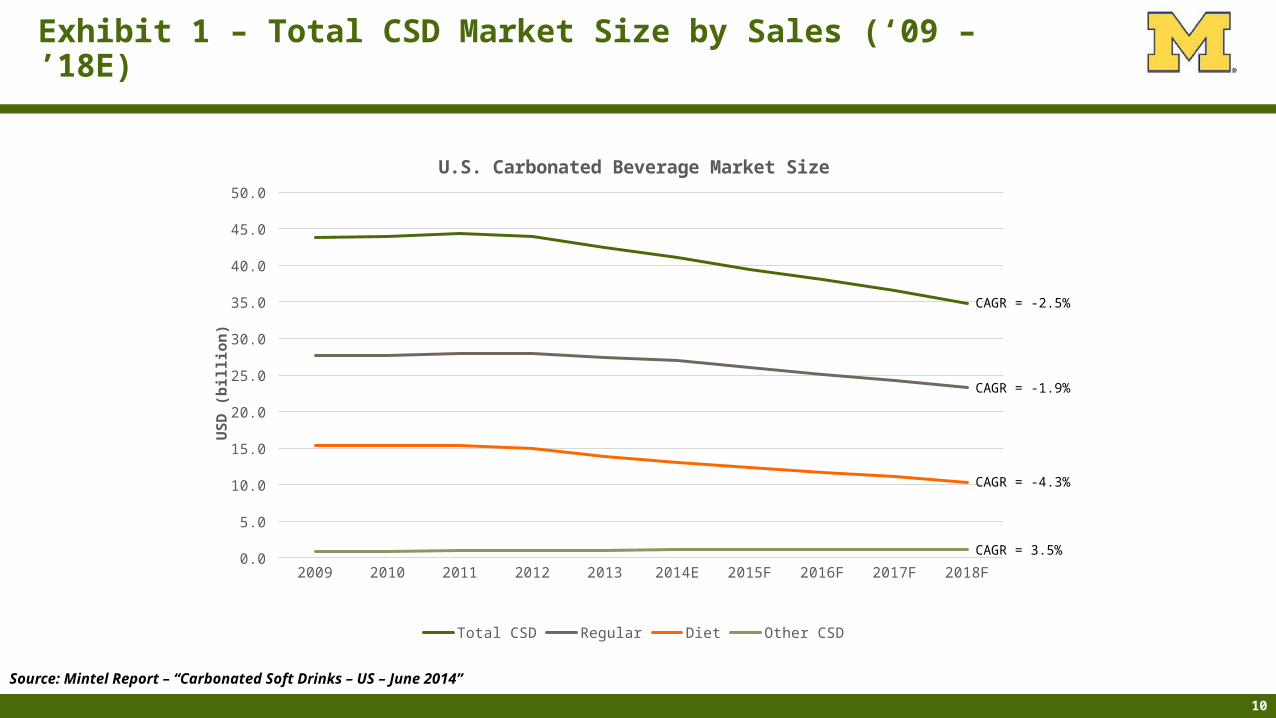
Exhibit 1 – Total CSD Market Size by Sales (‘09 – ’18E)
2009 2010 2011 2012 2013 2014E 2015F 2016F 2017F 2018F0.0
5.0
10.0
15.0
20.0
25.0
30.0
35.0
40.0
45.0
50.0
U.S. Carbonated Beverage Market Size
Total CSD Regular Diet Other CSD
US
D (
bill
ion
)
CAGR = -2.5%
CAGR = -1.9%
CAGR = -4.3%
CAGR = 3.5%
Source: Mintel Report – “Carbonated Soft Drinks – US – June 2014”
11
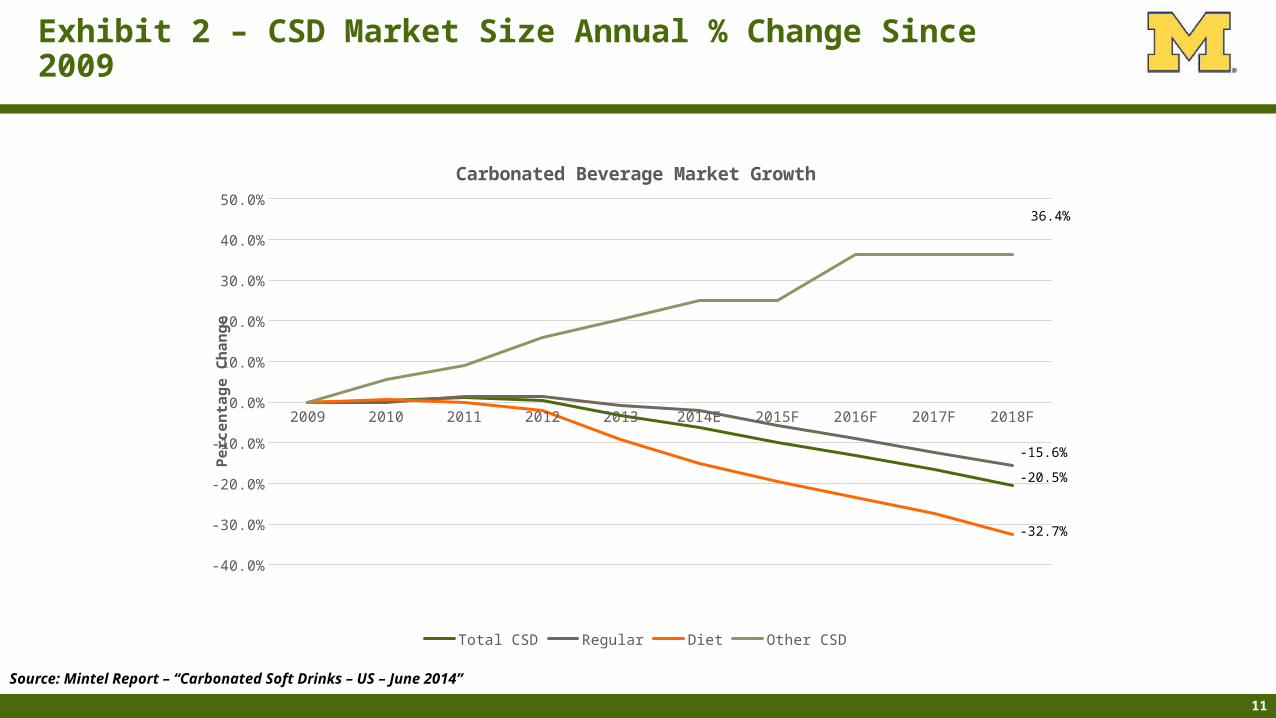
Exhibit 2 – CSD Market Size Annual % Change Since 2009
2009 2010 2011 2012 2013 2014E 2015F 2016F 2017F 2018F
-40.0%
-30.0%
-20.0%
-10.0%
0.0%
10.0%
20.0%
30.0%
40.0%
50.0%
Carbonated Beverage Market Growth
Total CSD Regular Diet Other CSD
Per
cen
tag
e C
han
ge
36.4%
-15.6%
-20.5%
-32.7%
Source: Mintel Report – “Carbonated Soft Drinks – US – June 2014”
12
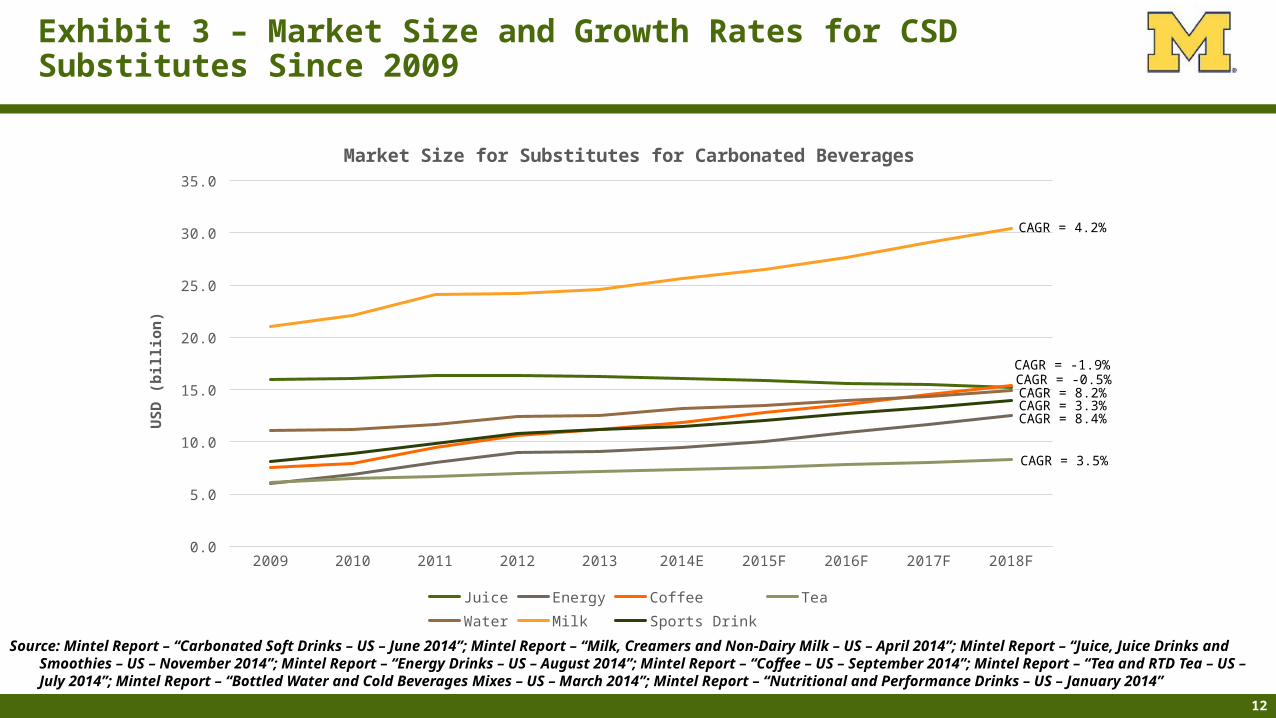
Exhibit 3 – Market Size and Growth Rates for CSD Substitutes Since 2009
2009 2010 2011 2012 2013 2014E 2015F 2016F 2017F 2018F0.0
5.0
10.0
15.0
20.0
25.0
30.0
35.0
Market Size for Substitutes for Carbonated Beverages
Juice Energy Coffee Tea Water Milk Sports Drink
US
D (
bill
ion
)
CAGR = -1.9%
CAGR = 4.2%
CAGR = -0.5%CAGR = 8.2%CAGR = 3.3%CAGR = 8.4%
CAGR = 3.5%
Source: Mintel Report – “Carbonated Soft Drinks – US – June 2014”; Mintel Report – “Milk, Creamers and Non-Dairy Milk – US – April 2014”; Mintel Report – “Juice, Juice Drinks and Smoothies – US – November 2014”; Mintel Report – “Energy Drinks – US – August 2014”; Mintel Report – “Coffee – US – September 2014”; Mintel Report – “Tea and RTD Tea – US – July 2014”; Mintel Report – “Bottled Water and Cold Beverages Mixes – US – March 2014”; Mintel Report – “Nutritional and Performance Drinks – US – January 2014”
13
Exhibit 4 – CSD Substitutes Market Size Annual Percent Change since 2009
2009 2010 2011 2012 2013 2014E 2015F 2016F 2017F 2018F
-20.0%
0.0%
20.0%
40.0%
60.0%
80.0%
100.0%
120.0%
Growth for Substitutes for Carbonated Beverages
Juice Energy Coffee Tea
Water Milk Sports Drink
Per
cen
tag
e C
han
ge
107.0%
-4.6%
103.7%
72.4%
44.6%
36.2%34.5%
Source: Mintel Report – “Carbonated Soft Drinks – US – June 2014”
14
Kosher
Environmentally FriendlyOrganic
Low/No/Reduced Allergen
No Additives/Preservatives
Gluten Free
All-Natural Product
Low/No/Reduced Calorie
Low/No/Reduced SugarPremium
0
10
20
30
40
50
60
3734
1210
14
9
1310 11
8
55
46
22 2220 20
16 16 1512
Claims Made with New Product Launches
2012 2013
Per
cen
tag
e o
f P
rod
uct
s (%
)
Exhibit 5 – Health and Wellness Trends (‘12 vs. ‘13)
Source: Mintel Report – “Beverage Packaging Trends – US – February 2014”
15
Exhibit 6 – Millennial Purchase Considerations vs. Average
Value
Positiv
e Exp
erie
nce
Discou
nts
Feel
ing
Good
Positiv
e Rev
iews
Onlin
e Pur
chas
e
Stand
ing
Out
Loca
l Sto
res
Recom
men
ded
New S
hops
In S
tyle
Adver
tised
Pro
ducts
0
10
20
30
40
50
60
70
80
74
4644
29
22 21
1714 13 12 11
8
71
5048
42
34
29
23 23 23 2219
16
Factors Influencing Purchase Decisions
All Millennials
Per
cen
tag
e R
esp
on
din
g "
Ver
y Im
po
rtan
t" t
o P
urc
has
e D
ecis
ion
Source: Mintel Report – “Marketing to Millennials – US – February 2014”
16
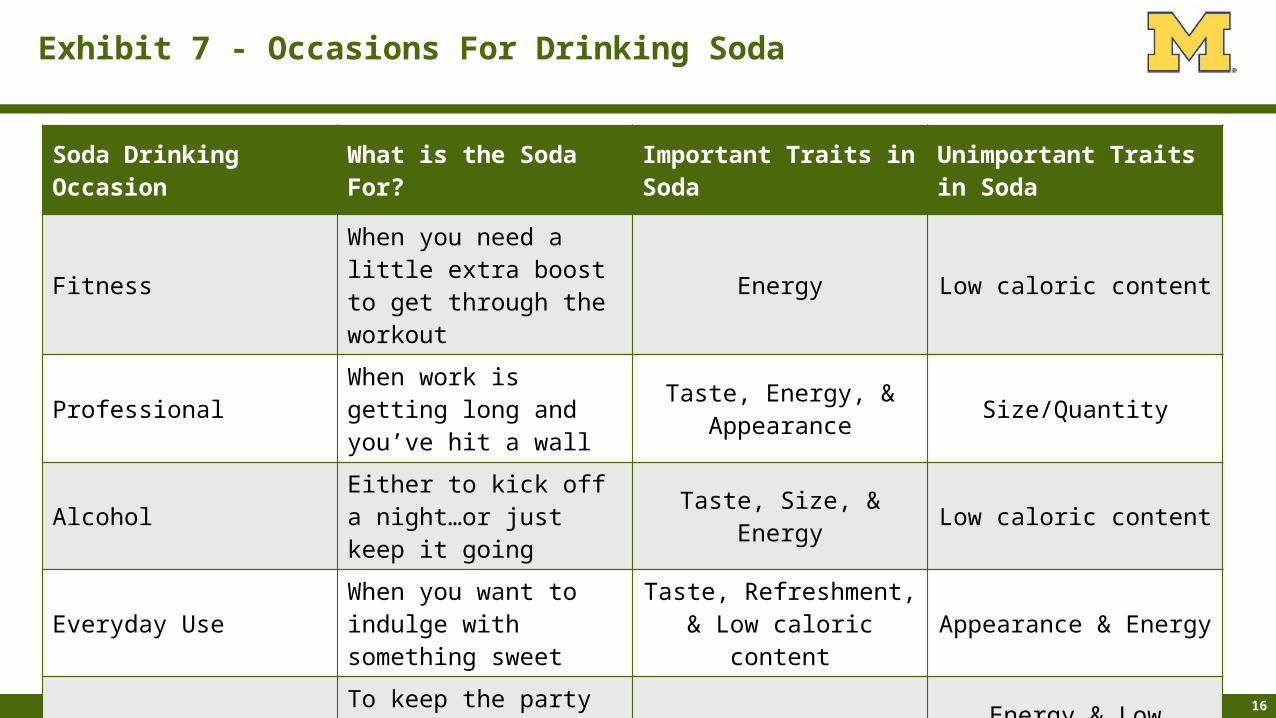
Exhibit 7 - Occasions For Drinking Soda
Soda Drinking Occasion
What is the Soda For? Important Traits in SodaUnimportant Traits in Soda
FitnessWhen you need a little extra boost to get through the workout
Energy Low caloric content
ProfessionalWhen work is getting long and you’ve hit a wall
Taste, Energy, & Appearance
Size/Quantity
AlcoholEither to kick off a night…or just keep it going
Taste, Size, & Energy Low caloric content
Everyday UseWhen you want to indulge with something sweet
Taste, Refreshment, & Low caloric content
Appearance & Energy
Social SettingTo keep the party going, but not with alcohol
Taste & AppearanceEnergy & Low caloric
content