PowerPoint 簡報 · 廚 餘 結語 垃圾分類與垃圾分類 正確回收方法 (含 法規) 06 資源垃圾的種類與回收辦法 紙類 紙餐具、紙杯、鋁箔包、貼膜海報及

Seite 1
中国生活垃圾的低碳发展Low-carbon Waste Management in China
中国城市生活垃圾处理领域国家适当减缓行动项目China Integrated Waste Management NAMA Project

Seite 2
Content
目录
• GHG reduction potential in the waste sector
中国垃圾领域的减排潜力
• NAMA Support Project – China Integrated
Waste Management NAMA
NAMA 基金会支持项目 – 中国城市生活垃圾领域国家适当减缓行动项目介绍
19.02.2019

Seite 3
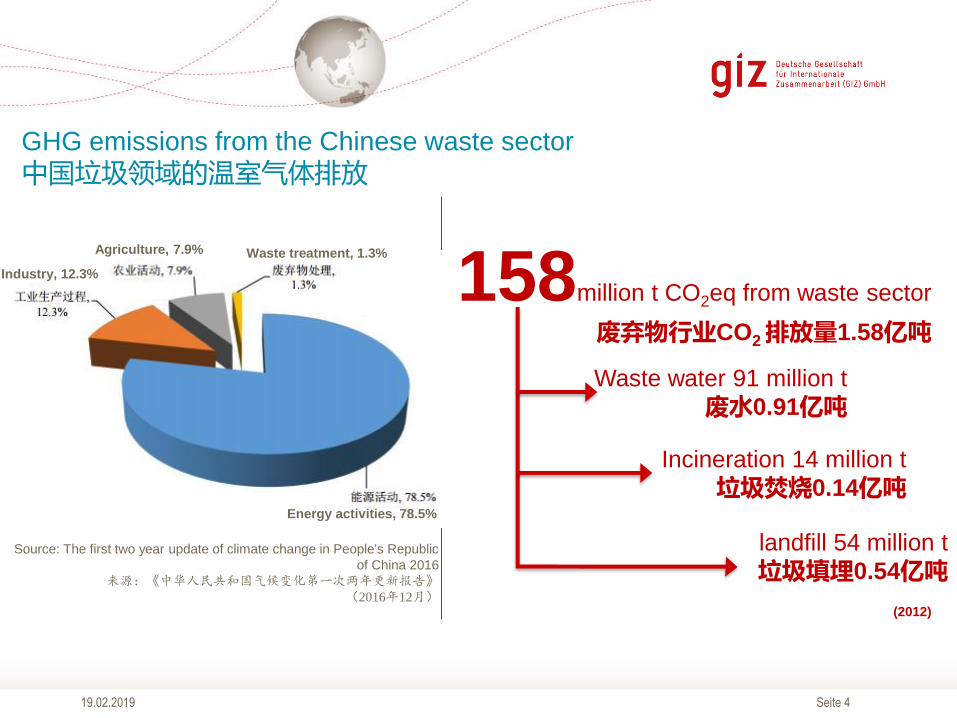
GHG reduction potential in the waste sector中国垃圾领域的减排潜力
19.02.2019
Seite 419.02.2019
158million t CO2eq from waste sector
废弃物行业CO2 排放量1.58亿吨
Incineration 14 million t
垃圾焚烧0.14亿吨
landfill 54 million t
垃圾填埋0.54亿吨
Waste water 91 million t
废水0.91亿吨
Source: The first two year update of climate change in People's Republic
of China 2016
来源:《中华人民共和国气候变化第一次两年更新报告》(2016年12月)
GHG emissions from the Chinese waste sector
中国垃圾领域的温室气体排放
Industry, 12.3%
Agriculture, 7.9% Waste treatment, 1.3%
Energy activities, 78.5%
(2012)
Seite 519.02.2019
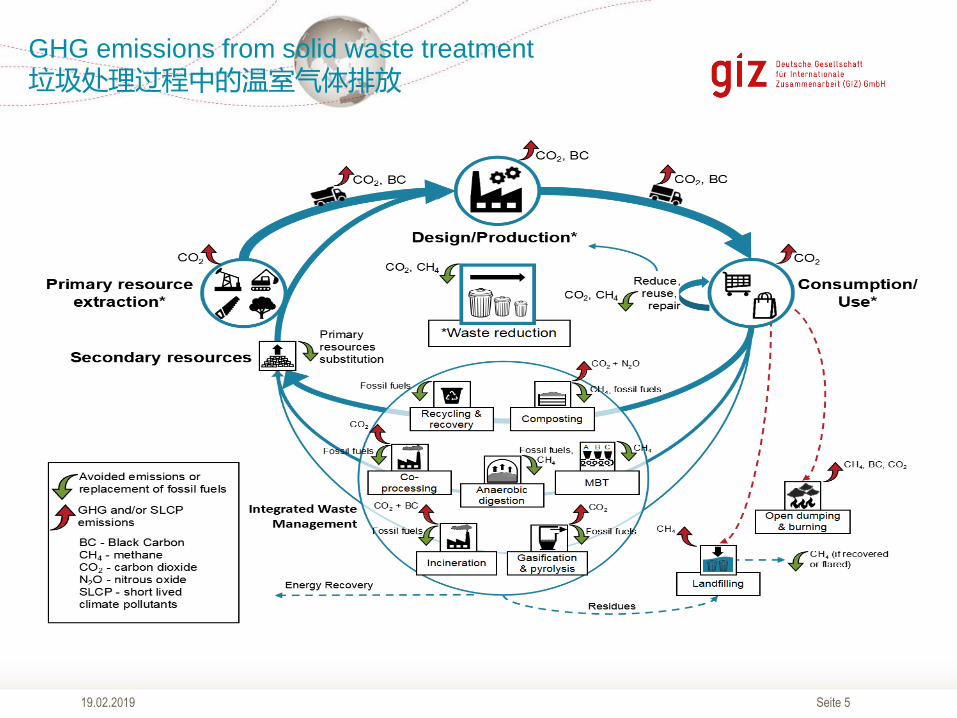
GHG emissions from solid waste treatment
垃圾处理过程中的温室气体排放
Seite 6
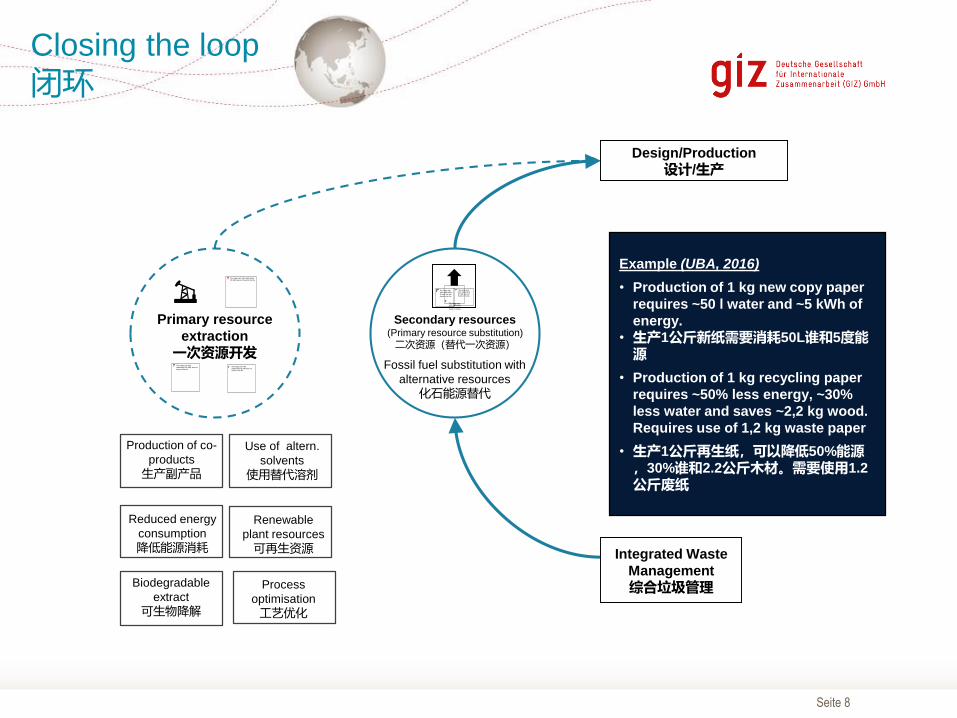
Primary resource
extraction
一次资源开采
Design/Production
设计/生产 Consumption/
Use
消费与使用
Integrated Waste
Management
综合垃圾管理
Secondary resources(Primary resource substitution)
二次资源(一次资源替代)
The Circular Economy
循环经济

Seite 7
Secondary Resources
二次资源
Recycling &
recovery
回收
Composting
堆肥
Co-processing
资源再生 Anaerobic
digestion
厌氧消化
A B C
MBT
Incineration
垃圾焚烧Gasification &
pyrolysis
热解气化
Energy Recovery 能源回收
Residues 残渣 Open dumping &
burning
无序堆放与焚烧
Landfilling
填埋
Consumption / Use
消费/使用
Integrated Waste Management
综合垃圾管理
Seite 8
Production of co-
products
生产副产品
Reduced energy
consumption
降低能源消耗
Renewable
plant resources
可再生资源
Use of altern.
solvents
使用替代溶剂
Process
optimisation
工艺优化
Biodegradable
extract
可生物降解
Primary resource
extraction
一次资源开发
Secondary resources(Primary resource substitution)
二次资源(替代一次资源)
Fossil fuel substitution with
alternative resources
化石能源替代
Design/Production
设计/生产
Integrated Waste
Management
综合垃圾管理
Example (UBA, 2016)
• Production of 1 kg new copy paper
requires ~50 l water and ~5 kWh of
energy.
• 生产1公斤新纸需要消耗50L谁和5度能源
• Production of 1 kg recycling paper
requires ~50% less energy, ~30%
less water and saves ~2,2 kg wood.
Requires use of 1,2 kg waste paper
• 生产1公斤再生纸,可以降低50%能源,30%谁和2.2公斤木材。需要使用1.2
公斤废纸
Closing the loop
闭环
Seite 9
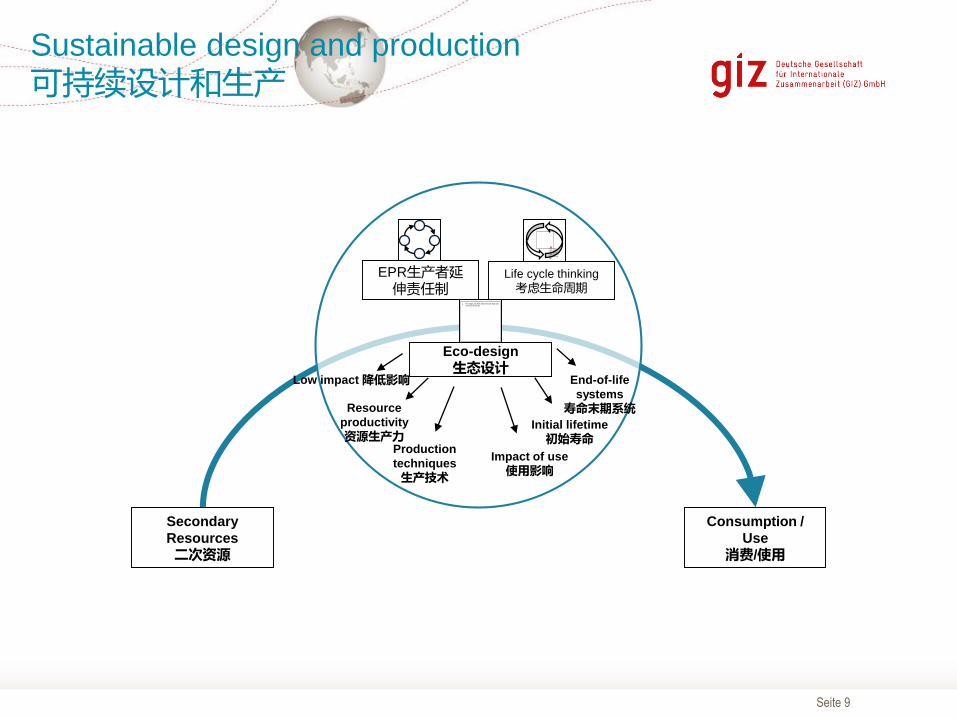
Life cycle thinking
考虑生命周期
Eco-design
生态设计Low impact 降低影响
Resource
productivity
资源生产力Production
techniques
生产技术
Impact of use
使用影响
Initial lifetime
初始寿命
End-of-life
systems
寿命末期系统
EPR生产者延伸责任制
Secondary
Resources
二次资源
Consumption /
Use
消费/使用
Sustainable design and production
可持续设计和生产

Seite 10
Reduce减少
Repair修理
Re-use再使用
Avoidance避免产生
Individuals个人
Public Authorities公共机构
Professionals专业机构
Engagement of three main actors三方约定
Consumption/Use
消费/使用
→ Green public
procurement, regulation,
eco labelling, …
绿色政府采购,规章制度,生态标签
→ Awareness,
sharing, leasing,
…
意识,共享,租赁
→ Awareness,
take back
mechanism, eco
labelling, …
意识,回收机制,生态标签
Recycling回收
Design/Production设计/生产
Integrated Waste Management综合垃圾管理
Conscious Consumption
自觉消费

Seite 11
one ton of MSW
1吨生活垃圾
Sanitation landfill 卫生填埋:1.22 tCO2 eq
Passive landfill 简易填埋:1.02 tCO2 eq
Composting 堆肥:0.14 tCO2 eq
AD 厌氧消化:-0.13 tCO2 eq
incineration焚烧:0.47 tCO2 eq
* Calculated by IWM NAMA Project based on the IPCC methodology and considering Chinese conditions
Integrated Waste Management
综合垃圾管理Secondary Resources
二次资源
Recycling &
recovery
回收
Composting
堆肥
Co-processing
资源再生 Anaerobic
digestion
厌氧消化
A B C
MBT
Incineration
垃圾焚烧Gasification &
pyrolysis
热解气化
Energy Recovery 能源回收
Residues 残渣 Open dumping &
burning
无序堆放与焚烧
Landfilling
填埋
Consumption / Use
消费/使用
Seite 12
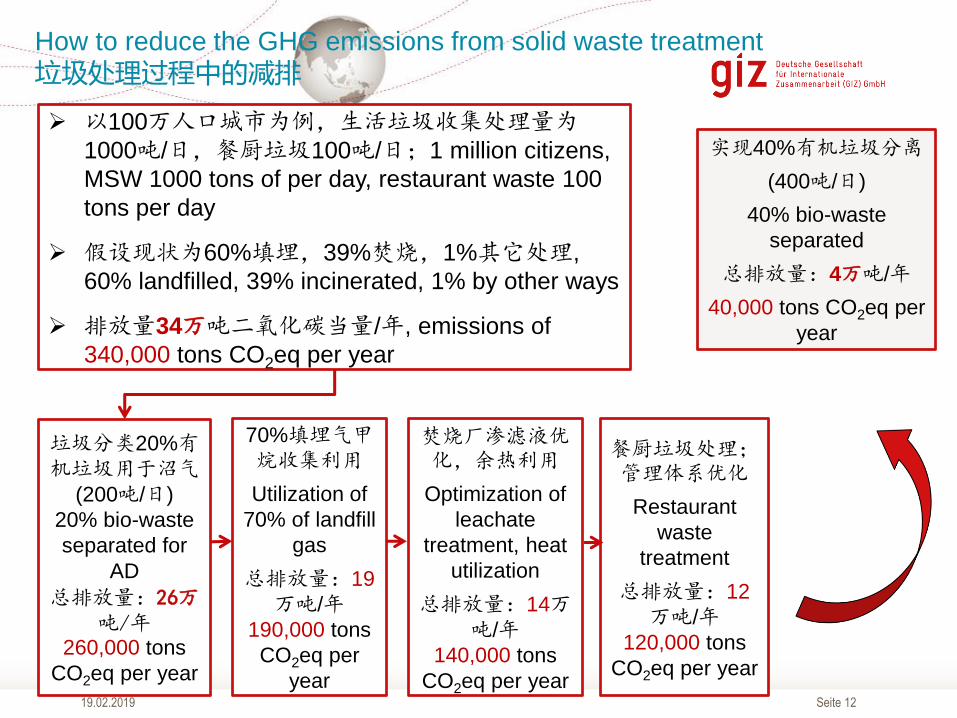
How to reduce the GHG emissions from solid waste treatment
垃圾处理过程中的减排
➢ 以100万人口城市为例,生活垃圾收集处理量为1000吨/日,餐厨垃圾100吨/日;1 million citizens,
MSW 1000 tons of per day, restaurant waste 100
tons per day
➢ 假设现状为60%填埋,39%焚烧,1%其它处理,
60% landfilled, 39% incinerated, 1% by other ways
➢ 排放量34万吨二氧化碳当量/年, emissions of
340,000 tons CO2eq per year
垃圾分类20%有机垃圾用于沼气
(200吨/日)
20% bio-waste
separated for
AD
总排放量:26万吨/年
260,000 tons
CO2eq per year
70%填埋气甲烷收集利用
Utilization of
70% of landfill
gas
总排放量:19
万吨/年190,000 tons
CO2eq per
year
焚烧厂渗滤液优化,余热利用
Optimization of
leachate
treatment, heat
utilization
总排放量:14万吨/年
140,000 tons
CO2eq per year
餐厨垃圾处理;管理体系优化
Restaurant
waste
treatment
总排放量:12
万吨/年120,000 tons
CO2eq per year
实现40%有机垃圾分离
(400吨/日)
40% bio-waste
separated
总排放量:4万吨/年
40,000 tons CO2eq per
year
19.02.2019

Seite 1319.02.2019
The potential of GHG reduction by waste treatment in China
中国城市生活垃圾处理的减排潜力
11.1%
Potential GHG reduction 352 million tons
减排潜力3.52亿吨
428 million tons of MSW collection in 2030
2030年垃圾清运量4.28亿吨17.6%
Potential GHG reduction 222 million tons
减排潜力2.22亿吨
270 million tons of MSW treated in 2016
2016年城市垃圾无害化处理量2.7亿吨
Source: the China municipal waste industry development report
中国生活垃圾处理行业发展报告
According to Chinese NDC
根据中国的NDC目标
GHG emissions reduction 2 billion t/yr
年减排20亿吨Source: China Policy Review 中国经济报告
Seite 1419.02.2019
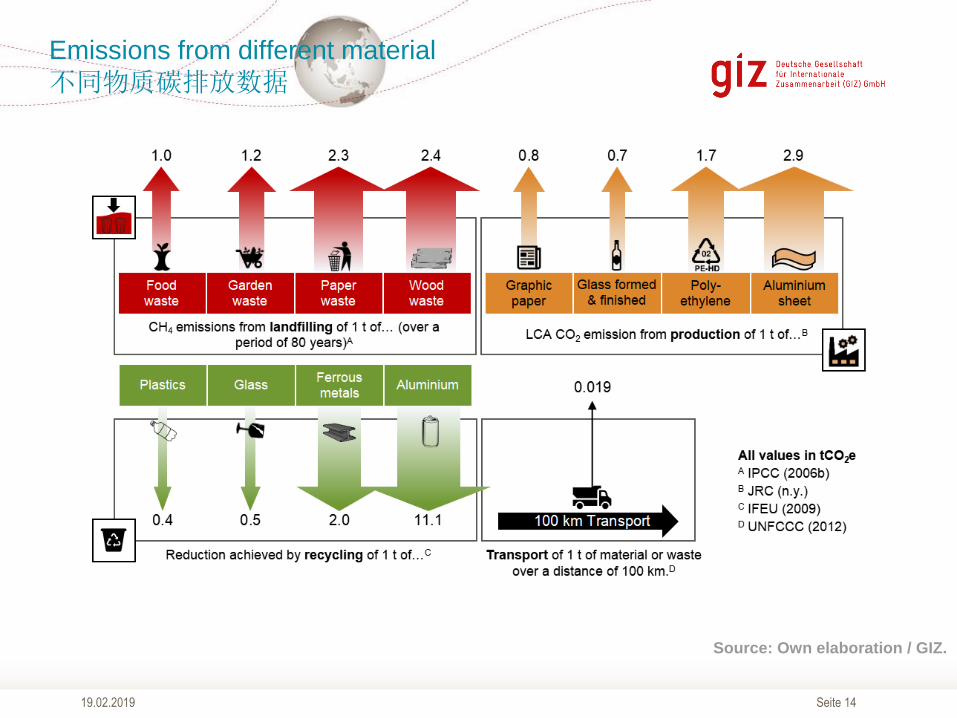
Emissions from different material
不同物质碳排放数据
Source: Own elaboration / GIZ.
Seite 15
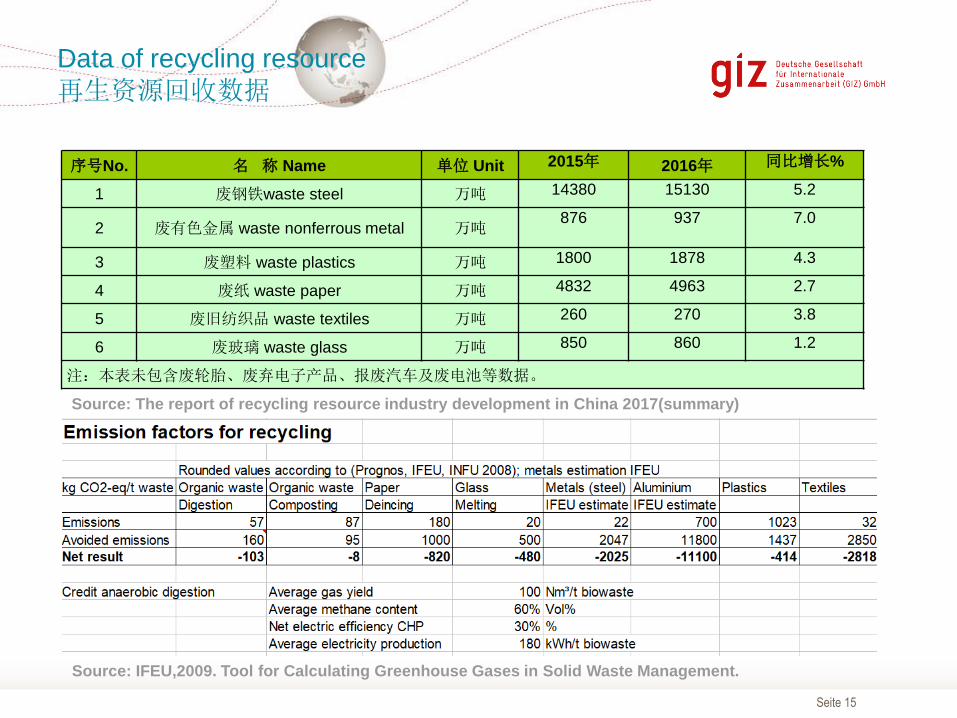
序号No. 名 称 Name 单位 Unit 2015年 2016年 同比增长%
1 废钢铁waste steel 万吨 14380 15130 5.2
2 废有色金属 waste nonferrous metal 万吨876 937 7.0
3 废塑料 waste plastics 万吨 1800 1878 4.3
4 废纸 waste paper 万吨 4832 4963 2.7
5 废旧纺织品 waste textiles 万吨 260 270 3.8
6 废玻璃 waste glass 万吨 850 860 1.2
注:本表未包含废轮胎、废弃电子产品、报废汽车及废电池等数据。
Data of recycling resource
再生资源回收数据
Source: The report of recycling resource industry development in China 2017(summary)
Source: IFEU,2009. Tool for Calculating Greenhouse Gases in Solid Waste Management.

Seite 1619.02.2019
Emissions reduction from waste recycling
垃圾回收减排量
Total
465.68Million tCO2e
Steel 金属
151.3*2.0
Paper 纸张
49.63*0.8
Plastics
塑料
18.78*0.4
Aluminium
铝制品
9.37*11.1
Textiles
纺织品
2.7*2.8
Glass玻璃
8.6*0.5
After the calculation
the GHG emissions
reduction amount is
465.68 Million tCO2e
in 2016, and the
increaing rate is
about 4% per year.
经计算,2016年我国可
回收垃圾减排量为4.65
亿吨二氧化碳当量,而
且该数据增速为每年
4%左右。
Seite 1719.02.2019
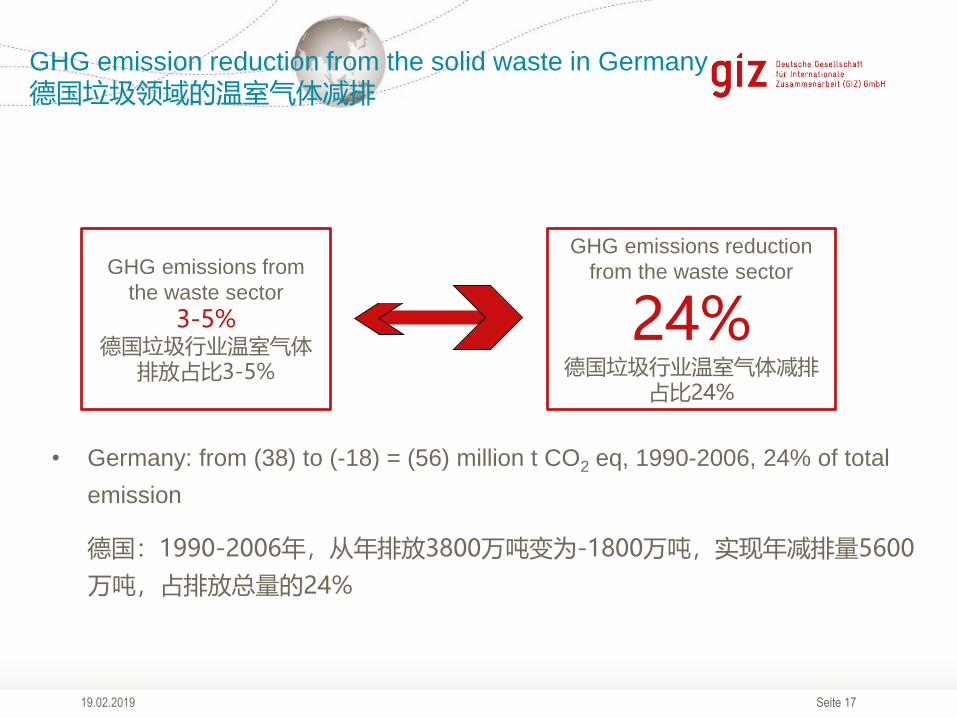
• Germany: from (38) to (-18) = (56) million t CO2 eq, 1990-2006, 24% of total
emission
德国:1990-2006年,从年排放3800万吨变为-1800万吨,实现年减排量5600
万吨,占排放总量的24%
GHG emissions from
the waste sector
3-5%德国垃圾行业温室气体
排放占比3-5%
GHG emissions reduction
from the waste sector
24%德国垃圾行业温室气体减排
占比24%
GHG emission reduction from the solid waste in Germany
德国垃圾领域的温室气体减排
Seite 1819.02.2019
GHG emission reduction from the solid waste in Germany
德国垃圾领域的温室气体减排
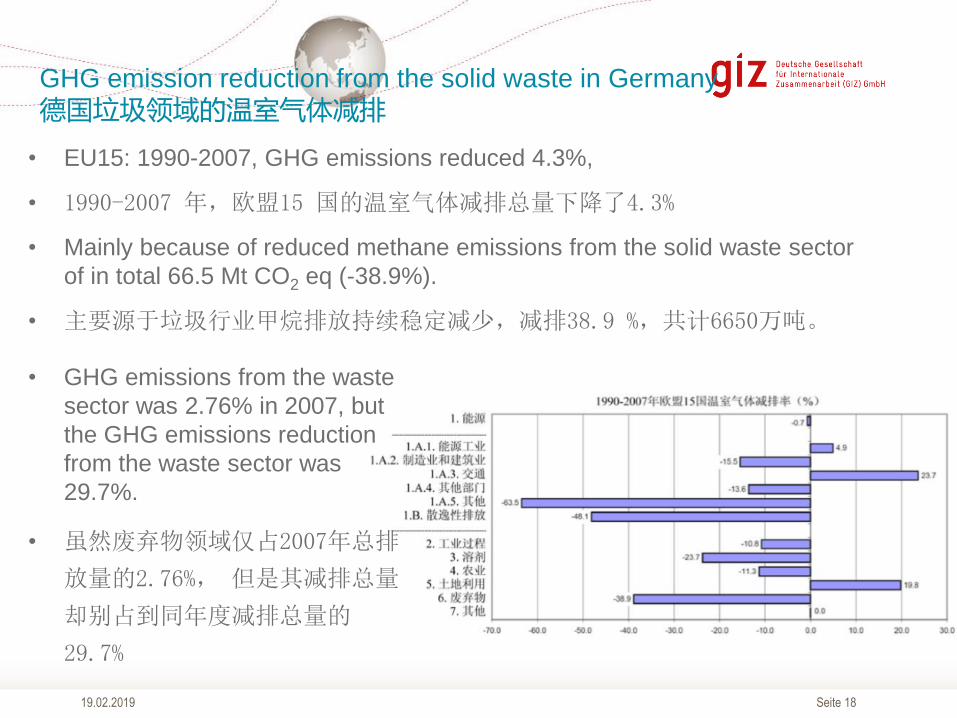
• EU15: 1990-2007, GHG emissions reduced 4.3%,
• 1990-2007 年,欧盟15 国的温室气体减排总量下降了4.3%
• Mainly because of reduced methane emissions from the solid waste sector
of in total 66.5 Mt CO2 eq (-38.9%).
• 主要源于垃圾行业甲烷排放持续稳定减少,减排38.9 %,共计6650万吨。
• GHG emissions from the waste
sector was 2.76% in 2007, but
the GHG emissions reduction
from the waste sector was
29.7%.
• 虽然废弃物领域仅占2007年总排
放量的2.76%, 但是其减排总量
却别占到同年度减排总量的
29.7%
Seite 19
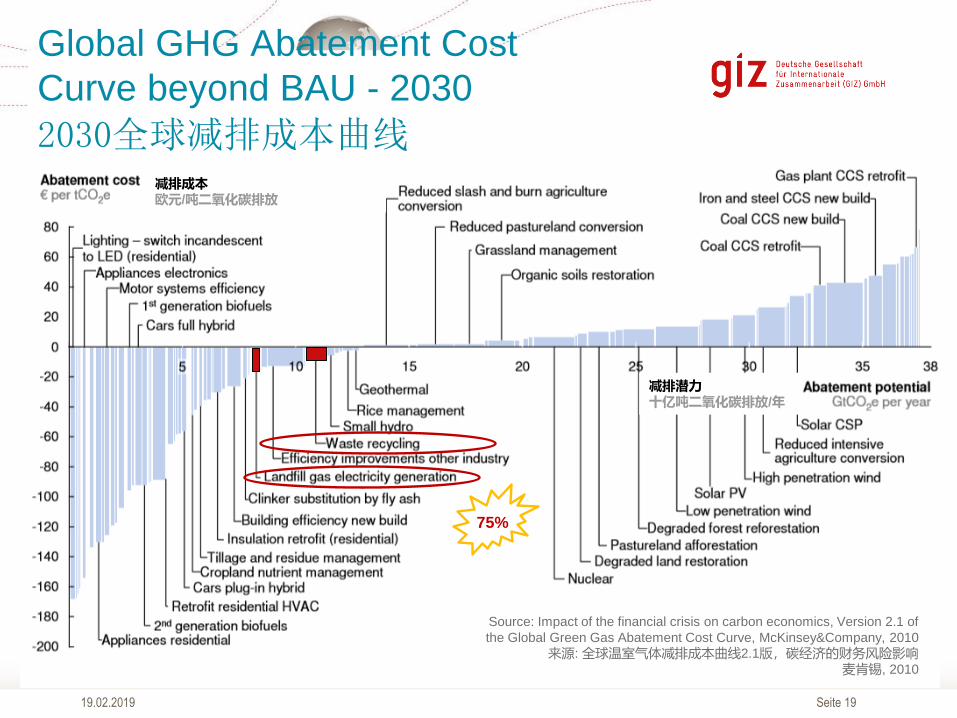
Source: Impact of the financial crisis on carbon economics, Version 2.1 of
the Global Green Gas Abatement Cost Curve, McKinsey&Company, 2010
来源: 全球温室气体减排成本曲线2.1版,碳经济的财务风险影响麦肯锡, 2010
减排成本欧元/吨二氧化碳排放
减排潜力十亿吨二氧化碳排放/年
19.02.2019
Global GHG Abatement Cost
Curve beyond BAU - 2030
2030全球减排成本曲线
75%
Seite 2019.02.2019
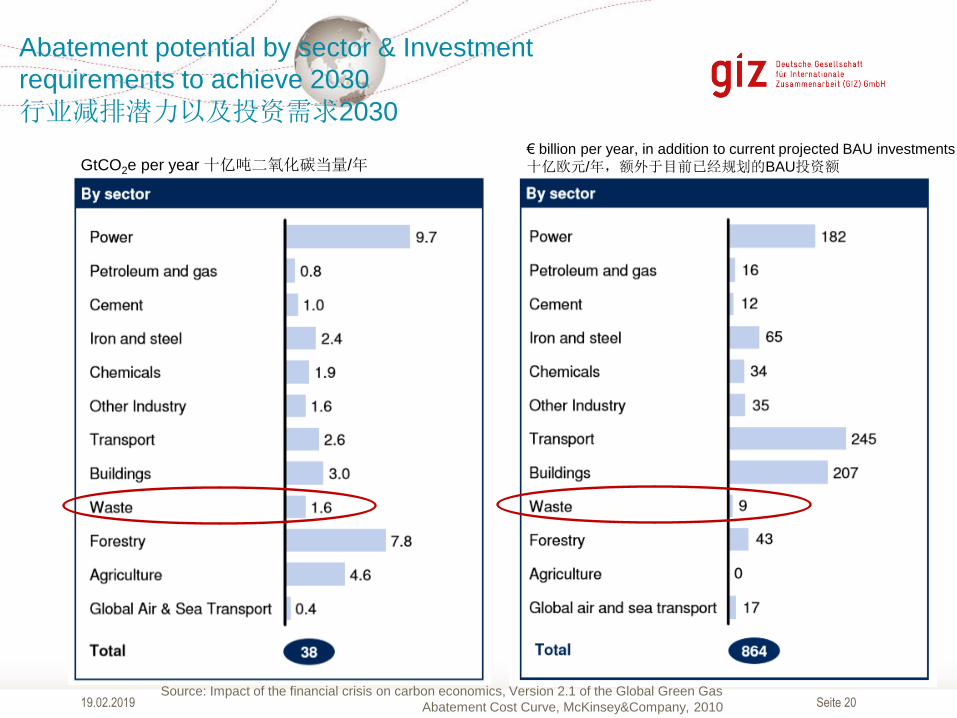
Abatement potential by sector & Investment
requirements to achieve 2030
行业减排潜力以及投资需求2030
€ billion per year, in addition to current projected BAU investments
十亿欧元/年,额外于目前已经规划的BAU投资额GtCO2e per year 十亿吨二氧化碳当量/年
Source: Impact of the financial crisis on carbon economics, Version 2.1 of the Global Green Gas
Abatement Cost Curve, McKinsey&Company, 2010

Seite 2119.02.2019
Capital intensity and abatement cost
资本密度以及减排成本
减排成本欧元/吨二氧化碳排放
资本密度欧元/吨二氧化碳排放

Seite 22
NAMA Support Project – IWM NAMAIWM NAMA 项目介绍
19.02.2019
Seite 23
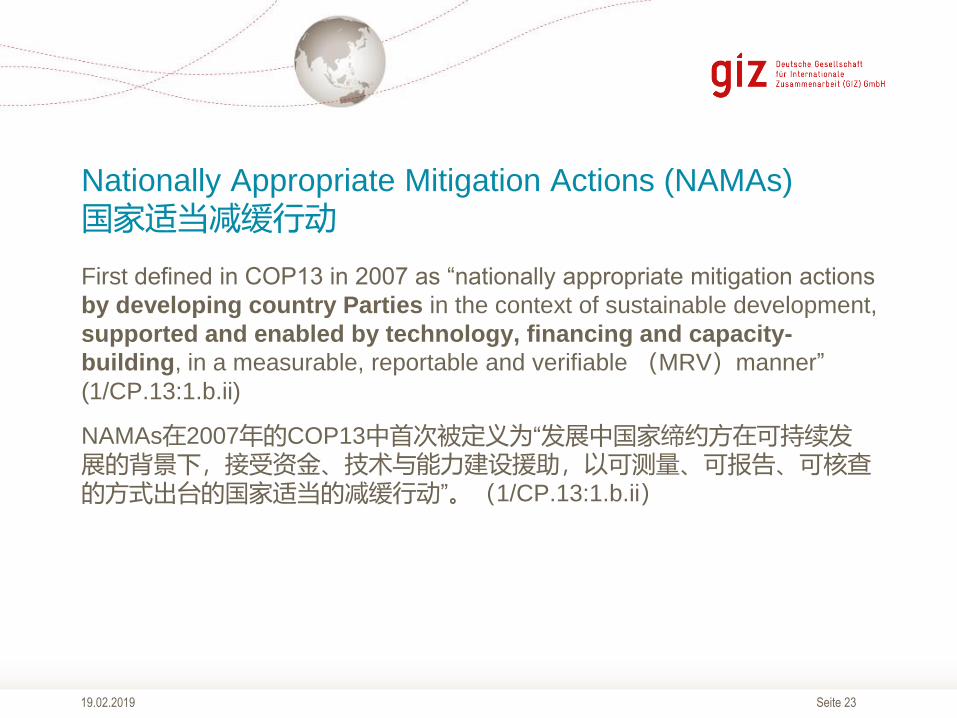
Nationally Appropriate Mitigation Actions (NAMAs)
国家适当减缓行动
19.02.2019
First defined in COP13 in 2007 as “nationally appropriate mitigation actions
by developing country Parties in the context of sustainable development,
supported and enabled by technology, financing and capacity-
building, in a measurable, reportable and verifiable (MRV)manner”
(1/CP.13:1.b.ii)
NAMAs在2007年的COP13中首次被定义为“发展中国家缔约方在可持续发展的背景下,接受资金、技术与能力建设援助,以可测量、可报告、可核查的方式出台的国家适当的减缓行动”。(1/CP.13:1.b.ii)

Seite 24
China‘s Nationally Appropriate Mitigation Actions (NAMAs)
中国的国家适当减缓行动
19.02.2019
CO2 reduction 40-45%
non-fossil 15%
Forest 1.3 billion m3
2020
19.02.2019
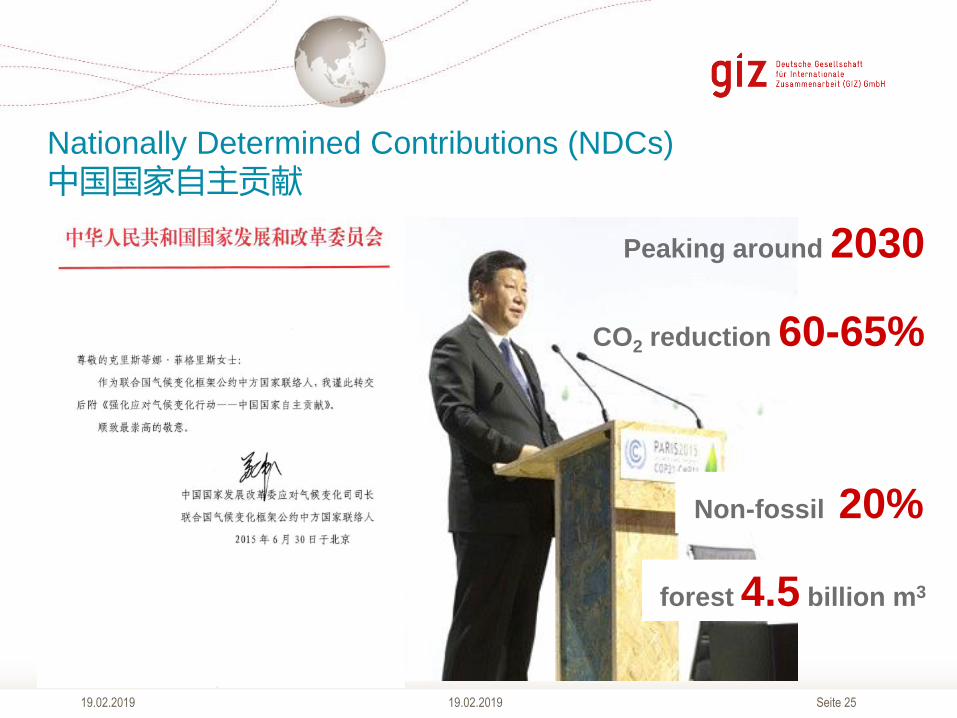
Seite 25
forest 4.5 billion m3
CO2 reduction 60-65%
Peaking around 2030
Non-fossil 20%
Nationally Determined Contributions (NDCs)
中国国家自主贡献
19.02.201919.02.2019
Seite 26
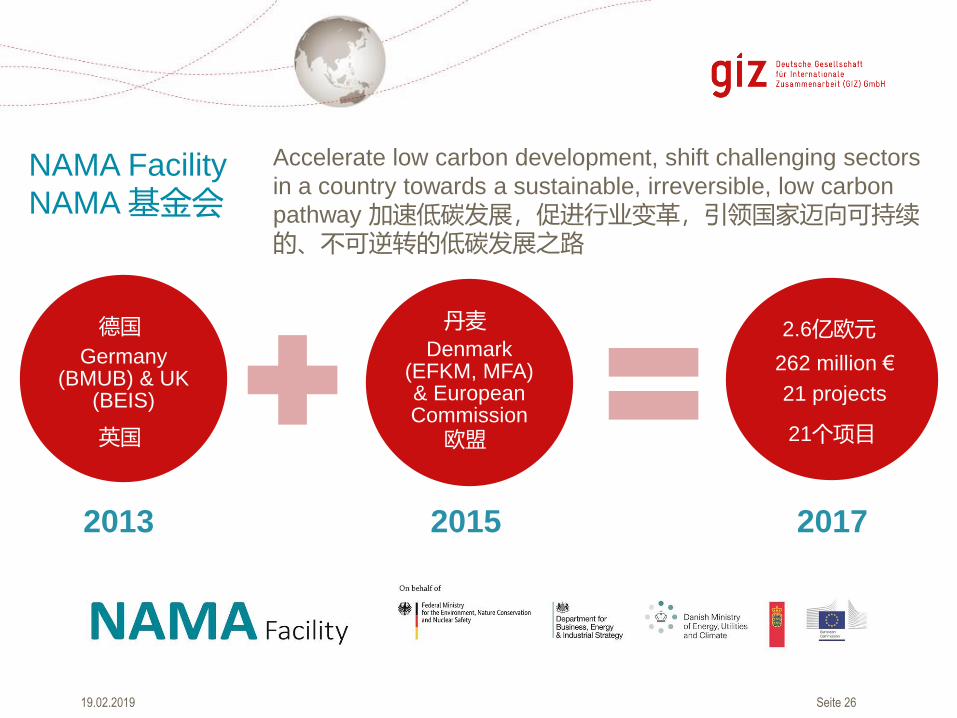
Germany (BMUB) & UK
(BEIS)
Denmark (EFKM, MFA) & European Commission
262 million €
21 projects
NAMA Facility
NAMA 基金会
2013 2015 2017
Accelerate low carbon development, shift challenging sectors
in a country towards a sustainable, irreversible, low carbon
pathway 加速低碳发展,促进行业变革,引领国家迈向可持续的、不可逆转的低碳发展之路
德国
英国
丹麦
欧盟
2.6亿欧元
21个项目
19.02.2019

Seite 27
China Integrated Waste
Management NAMA - glance
Duration:• September 2017 – August 2022
Budget:• 8,000,000 €
Political Partner:• Ministry of Housing and Urban-Rural
Development (MoHURD)
Implementation Partner:• China Association of Urban Environmental
Sanitation (CAUES)
Client: • NAMA Facility
中国城市生活垃圾领域国家适当减缓行动项目
执行期:• 2017年9月 –2022年8月
预算:• 8,000,000 €
政府支持单位:• 中国住房和城乡建设部
执行合作单位:• 中国城市环境卫生协会
委托方:• NAMA基金会
19.02.2019
Seite 28
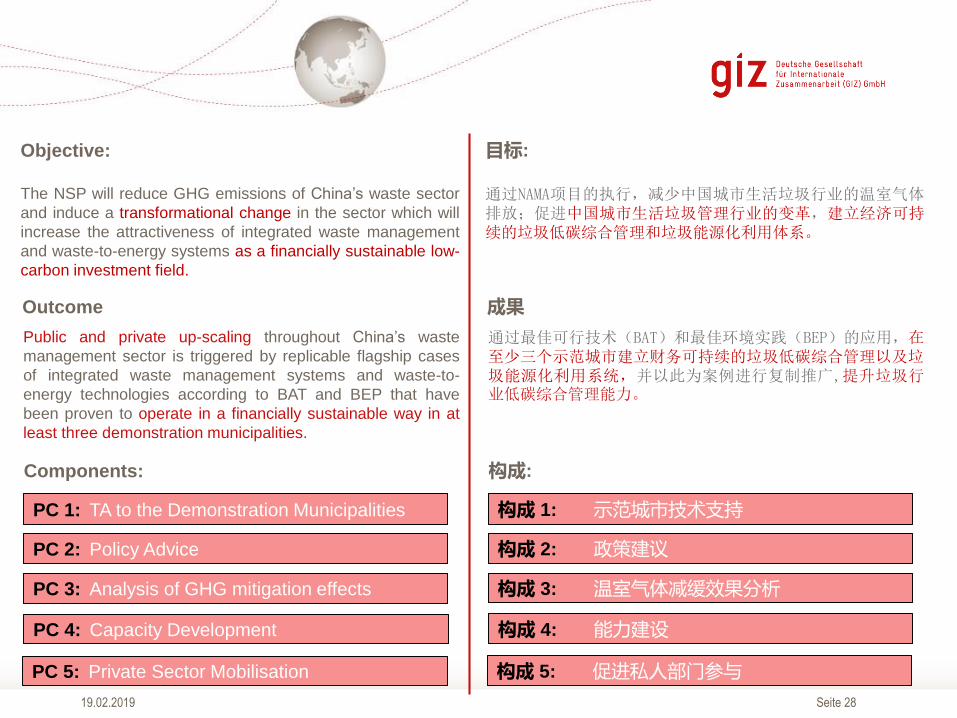
Objective:
The NSP will reduce GHG emissions of China’s waste sector
and induce a transformational change in the sector which will
increase the attractiveness of integrated waste management
and waste-to-energy systems as a financially sustainable low-
carbon investment field.
Components:
PC 1: TA to the Demonstration Municipalities
PC 2: Policy Advice
PC 3: Analysis of GHG mitigation effects
PC 4: Capacity Development
PC 5: Private Sector Mobilisation
Public and private up-scaling throughout China’s waste
management sector is triggered by replicable flagship cases
of integrated waste management systems and waste-to-
energy technologies according to BAT and BEP that have
been proven to operate in a financially sustainable way in at
least three demonstration municipalities.
Outcome
目标:
通过NAMA项目的执行,减少中国城市生活垃圾行业的温室气体排放;促进中国城市生活垃圾管理行业的变革,建立经济可持续的垃圾低碳综合管理和垃圾能源化利用体系。
构成:
构成 1: 示范城市技术支持
构成 2: 政策建议
构成 3: 温室气体减缓效果分析
构成 4: 能力建设
构成 5: 促进私人部门参与
通过最佳可行技术(BAT)和最佳环境实践(BEP)的应用,在至少三个示范城市建立财务可持续的垃圾低碳综合管理以及垃圾能源化利用系统,并以此为案例进行复制推广,提升垃圾行业低碳综合管理能力。
成果
19.02.2019

Seite 2919.02.2019
How to reduce the GHG emissions from solid waste - conclusion
固废领域温室气体减排之道 – 结论
• Waste prevention and reuse – awareness raising 垃圾减量与再利用 - 提升意识
• Waste recycling - combination between informal or formal sector 垃圾回收,官方&非官方
• Increase the utilization of landfill gas – from 20% to 70% 加大填埋气利用率 – 20%到70%
• Optimize the waste collection and transportation
优化垃圾收运
• Promote the utilization of green waste to organic fertilizer
推动绿化垃圾生产有机肥
• Waste segregation – biological way, not only incineration
垃圾分类,促进易腐垃圾处理,避免粗暴焚烧
Seite 3019.02.2019
Thank you for your attention !
钱名宇 Qian Mingyu
项目主任 Project Director
+ 86 (0)10 8527 5589 ext. 105
+ 86 13810529780
Sunflower Tower,
Maizidian Street 37, Chaoyang
District, 100125, Beijing, PR China
We-chat Account:
GIZ-IWMNAMA