
뇌파측정과 동적신경영상 이론 및...
108
뇌파측정과 동적신경영상 이론 및 응용 연세대학교 의료공학연구센터 단기교육강좌 강의자료
Transcript of 뇌파측정과 동적신경영상 이론 및...

뇌파측정과 동적신경영상 이론 및 응용
연세대학교의료공학연구센터단기교육강좌강의자료

2
Contents
1. 뇌파 기술 개론 및 역사
2. 뇌파의 발생 원리
3. 뇌파의 측정 기술
4. 뇌파의 응용 분야
5. 뇌파 분석 기술 소개
6. 동적 신경영상 개론

3
1. 뇌파기술개론및역사

4
Bioelectromagnetics
<naver English dictionary>
Bioelectromagnetics
Measurement(from body)
Stimulation(to body)
Brain Activity (EEG, MEG)Cardiac Activity (ECG, MCG)Gastric Activity (EGG, MGG)Bioimpedance (EIT, MIT, Microwave)etc.Brain Stimulation (TES, TMS)Nerve StimulationBiological Effect of Microwaveetc.

5
생체 전기 현상 연구의 역사 (1)
갈바니의 실험 (1791년)
동물의 활동과 전기 현상의 관련성을 최초로 보임. 전기적인 자극에의해서 근육의 수축이 일어날 수 있음을 증명.
아연(Z)과 구리(C)의 두 금속체가닿을 때 발생하는 정전기에 의해서개구리 다리 근육이 움직임을 보임.
볼타 (1800년) 정전류를 생성할 수있는 배터리를 최초로 발명하고 같은 실험에 적용.
6
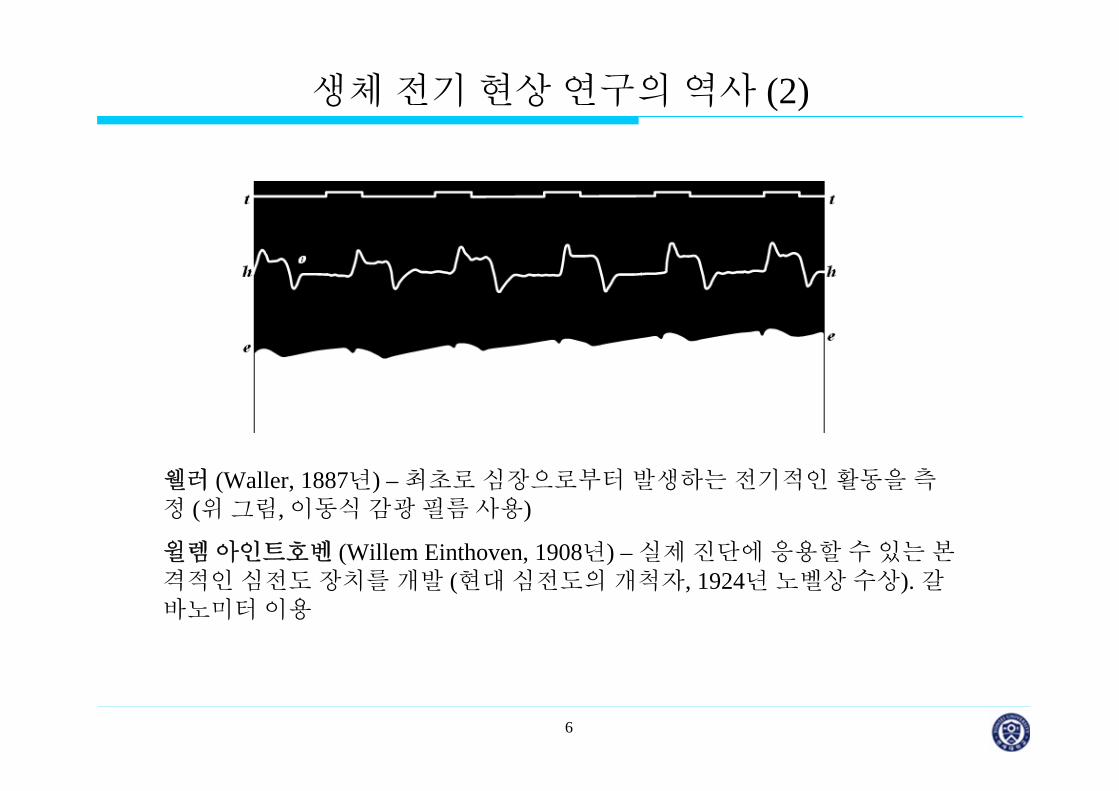
생체 전기 현상 연구의 역사 (2)
웰러 (Waller, 1887년) – 최초로 심장으로부터 발생하는 전기적인 활동을 측정 (위 그림, 이동식 감광 필름 사용)
윌렘 아인트호벤 (Willem Einthoven, 1908년) – 실제 진단에 응용할 수 있는 본격적인 심전도 장치를 개발 (현 심전도의 개척자, 1924년 노벨상 수상). 갈바노미터 이용
7
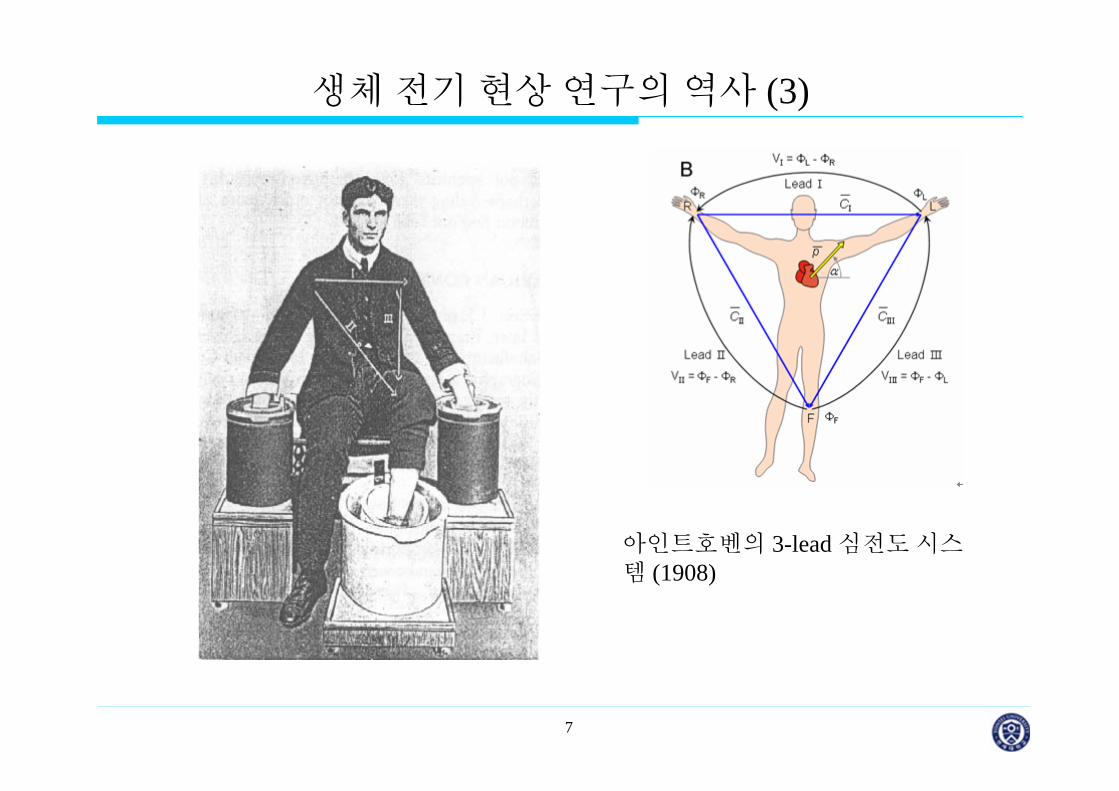
생체 전기 현상 연구의 역사 (3)
아인트호벤의 3-lead 심전도 시스템 (1908)
8
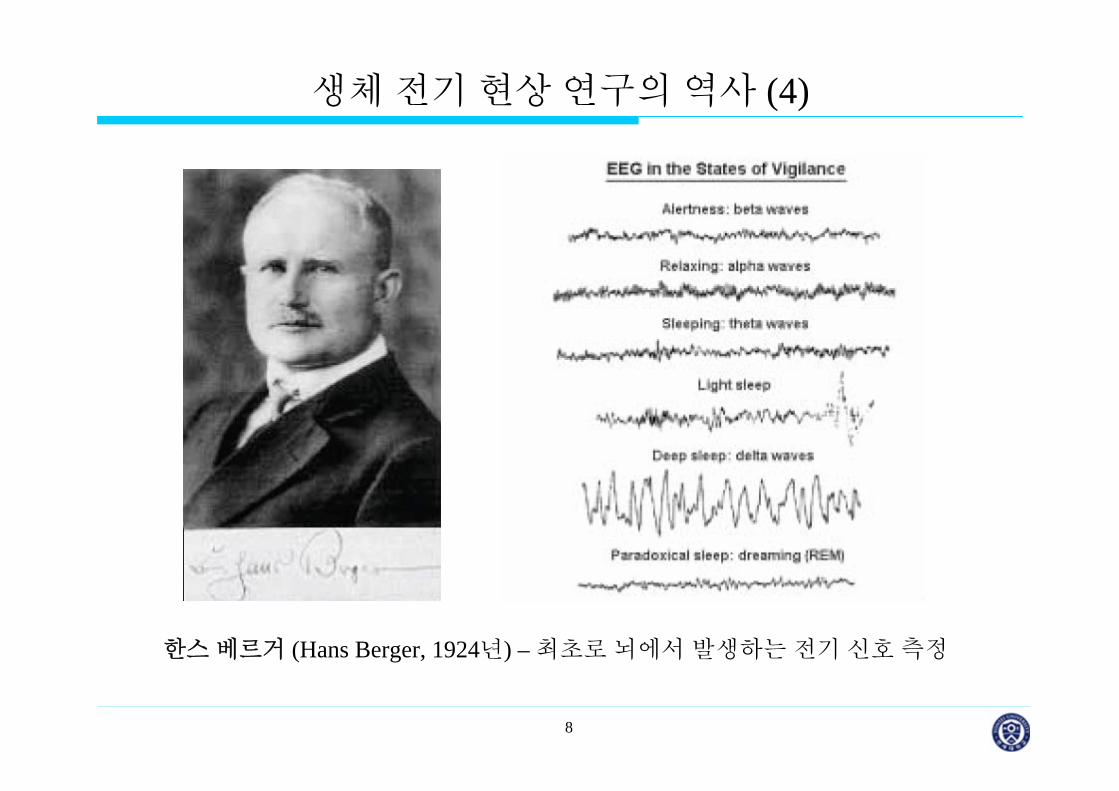
한스 베르거 (Hans Berger, 1924년) – 최초로 뇌에서 발생하는 전기 신호 측정
생체 전기 현상 연구의 역사 (4)

9
생체 전기 현상 연구의 역사 (5)
바울과 맥피 (Baule and McFee, 1963년) 최초로 인체(심장)에서 발생하는 생체 자기장 (심자도)을 측정, Gradiometer의 개념 사용
데이비드 코헨 (David Cohen, 1970년) 초전도양자간섭장치 (Superconducting Quantum Interference Device: SQUID)를 이용하여 MCG와 MEG를 측정. -269oC에서 작동 (liquid helium)
10
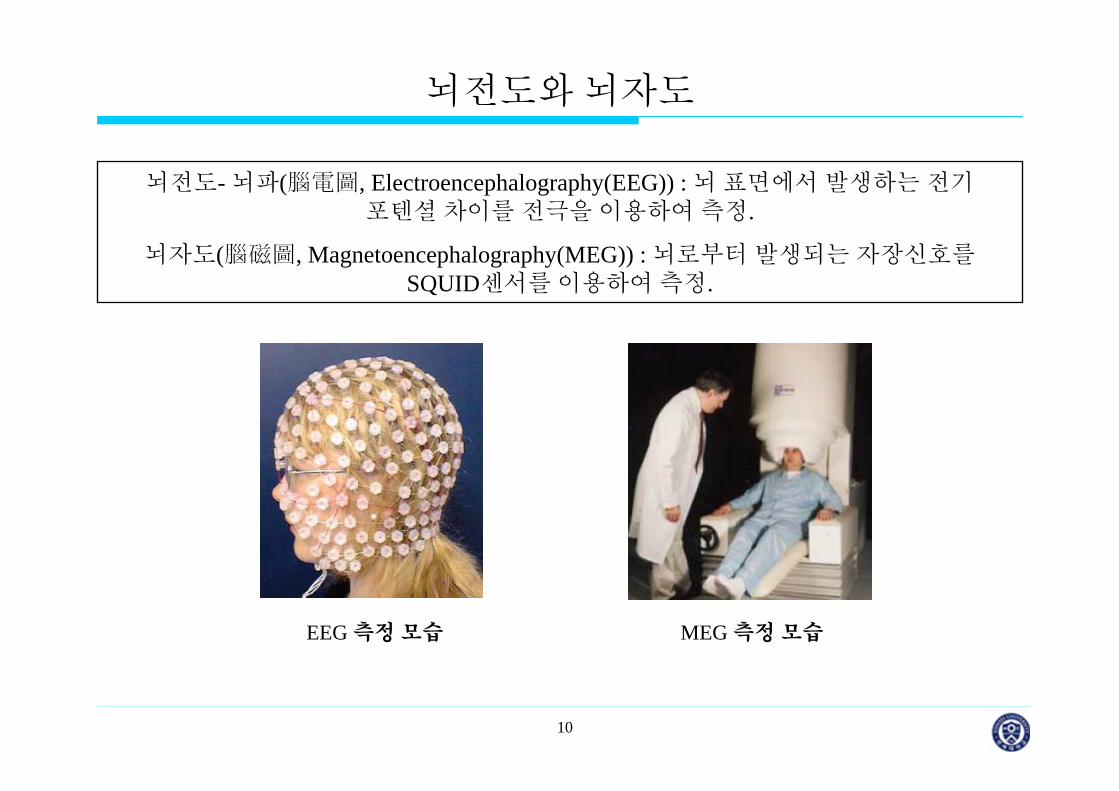
뇌전도와 뇌자도
EEG 측정 모습
뇌전도- 뇌파(腦電圖, Electroencephalography(EEG)) : 뇌 표면에서 발생하는 전기포텐셜 차이를 전극을 이용하여 측정.
뇌자도(腦磁圖, Magnetoencephalography(MEG)) : 뇌로부터 발생되는 자장신호를SQUID센서를 이용하여 측정.
MEG 측정 모습

11
뇌전도 (Electroencephalography: EEG)
• 머리 표면에 전극을 부착하여 머리 표면의 전위차를 측정함. 시스템 가격이저렴하고 설치가 간단하다.
• 뇌는 자기적으로 투명하지만 전기적으로는 투명하지 않아서 측정 신호가왜곡된다. 일반적으로 MEG보다 공간 분해능이 떨어지는 것으로 인식
electrode

12
뇌전도 (EEG)
하드웨어적 신호처리 (A/D변환, 증폭 등)
소프트웨어적 신호처리 (Baseline correction, Filtering, Artifact rejection, etc.)
13
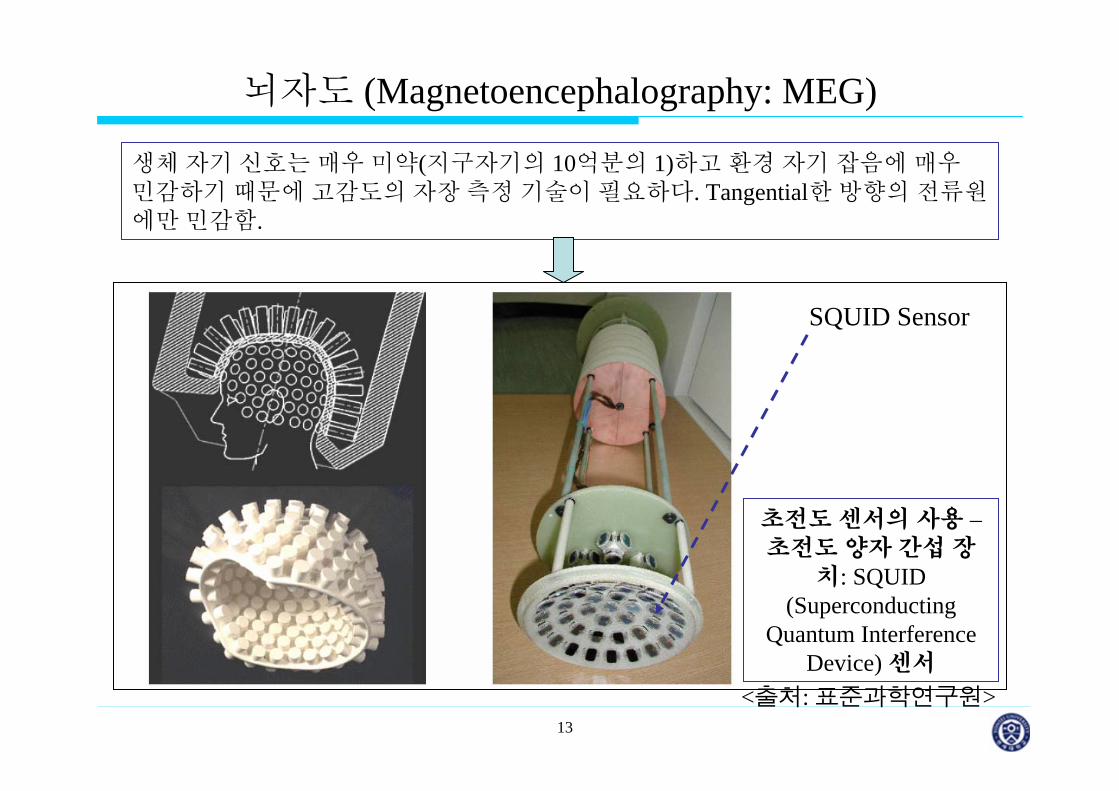
뇌자도 (Magnetoencephalography: MEG)
생체 자기 신호는 매우 미약(지구자기의 10억분의 1)하고 환경 자기 잡음에 매우민감하기 때문에 고감도의 자장 측정 기술이 필요하다. Tangential한 방향의 전류원에만 민감함.
초전도 센서의 사용 –초전도 양자 간섭 장
치: SQUID (Superconducting
Quantum Interference Device) 센서
SQUID Sensor
<출처: 표준과학연구원>

14
뇌자도 (MEG)의 측정
SQUID
Dewar
Magnetically shielded room
Control electronics
Signal processing
CTF- 150ch MEG system

15
여러 뇌기능 탐색 기법의 비교
EEG나 MEG는 비침습적이면서 뛰어난 시간 분해능을 가진다.
Temporal resolution (s)
Spa
tial r
esol
utio
n (m
m)
10-3 10-2 10-1 1 10 102 103 104
0
2
4
6
8
10
MEGfMRI
CTMRI
PET
SPECT
EEG
Invasiveness HighLow

16
2. 뇌파의발생원리

17
신경세포 (Neuron)
(출처: 네이버이미지)

18
세포막
지방
Ion channel

19
안정 막전위 (Resting potential)
안정막전위: 안정시 세포 내부가 세포외부에 비하여 60-90 mV의 음전하를띠고 있음. 외부 자극이 없는 상태에서 세포 안 밖에 존재하는 전위차를안정막전위라고 한다.
안정상태에서 세포 외액에는 Na+(소듐또는 나트륨)와 Cl-(염소)가 세포내액보다 높은 농도를 유지하고 K+ (포타슘)와 A-(음이온)는 세포 내액에 더 높은 농도로 존재한다.
각 이온들은 지방을 통해서 투과하지못하고 이온통로를 통해서 이동.
이온통로는 선택적 투과성을 가짐.

20
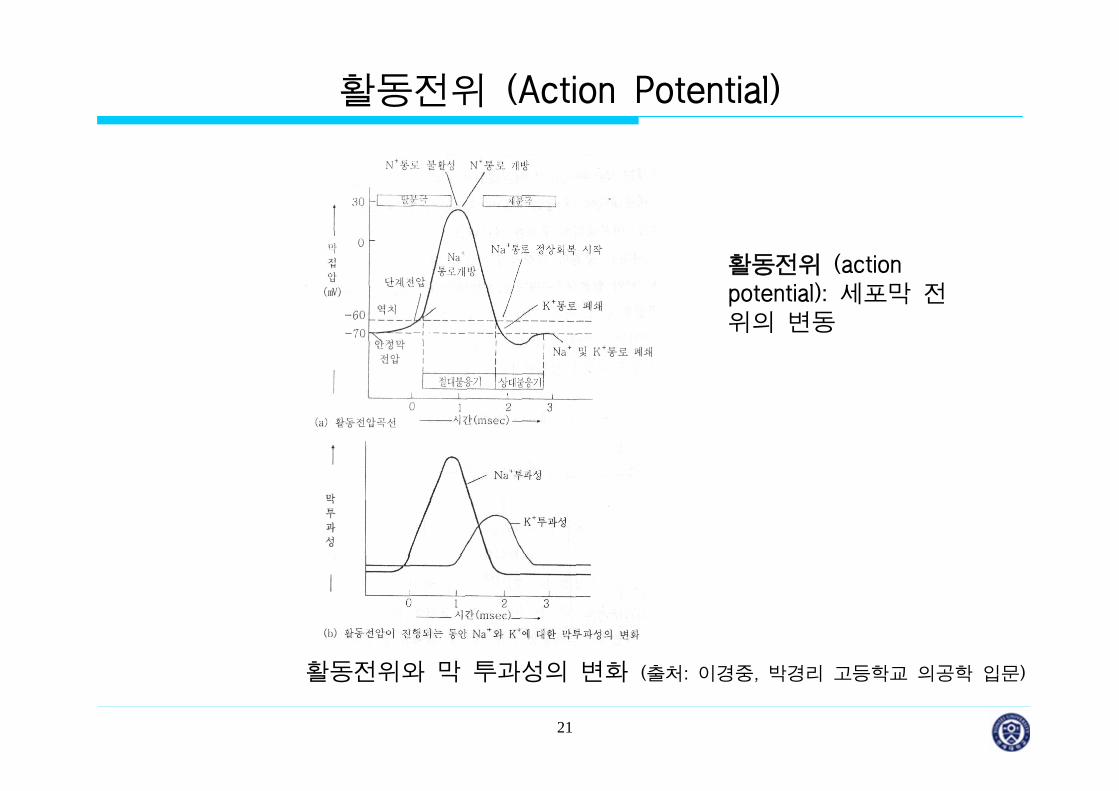
활동전위 (Action Potential)
탈분극
재분극
과분극
안정막전위
흥분성 조직에 문턱치 이상의 자극이 가해지면 세포막의Na+ 투과성이 증가하여 Na+가 세포 밖에서 안으로 빠르게들어가게 됨. 막전위가 감소 세포 안팎의 전위가 역전
세포막의 Na+ 통로가 닫히고 대신 K+ 통로가 열리면서 K+
가 세포 밖으로 나옴. 다시 세포막 전위 복원
과도한 K+ 의 유출로 인하여 안정막전위보다 더 낮게 세포내부가 음전하로 기울게 됨.
일정 시간 이후 다시 안정막전위 상태 복원.
21
활동전위 (Action Potential)
활동전위와 막 투과성의 변화 (출처: 이경중, 박경리 고등학교 의공학 입문)
활동전위 (action potential): 세포막 전위의 변동

22
활동 전위의 전파
인체 내에서의 정보 전달: 자극에 의해서 발생된 활동전위가 신경을 통하여전파됨. 활동전위의 전파는 인접 부위의 세포를 자극하고 이 자극이 활동전위를 발생시킬 수 있는 문턱치 이상이 되면 새로운 활동 전위를 발생.
실무율 (all-or-none law): 활동 전위가 발생하기 위해서는 문턱치 이상의 자극이 주어져야 하며, 일단 활동 전위가 발생하면 자극의 강도가 더 커지더라도 활동 전위의 크기는 일정하게 됨. 문턱치 이하의 자극에서는 활동 전위가 발생하지 않음.

23
활동 전위의 전파
세포 내에서의 활동전위의 전파 원리
(출처: 이경중, 박경리 고등학교 의공학 입문)

24
신경 전류의 전파
시속 400 km의 속도로 전파 (붉은색)
25
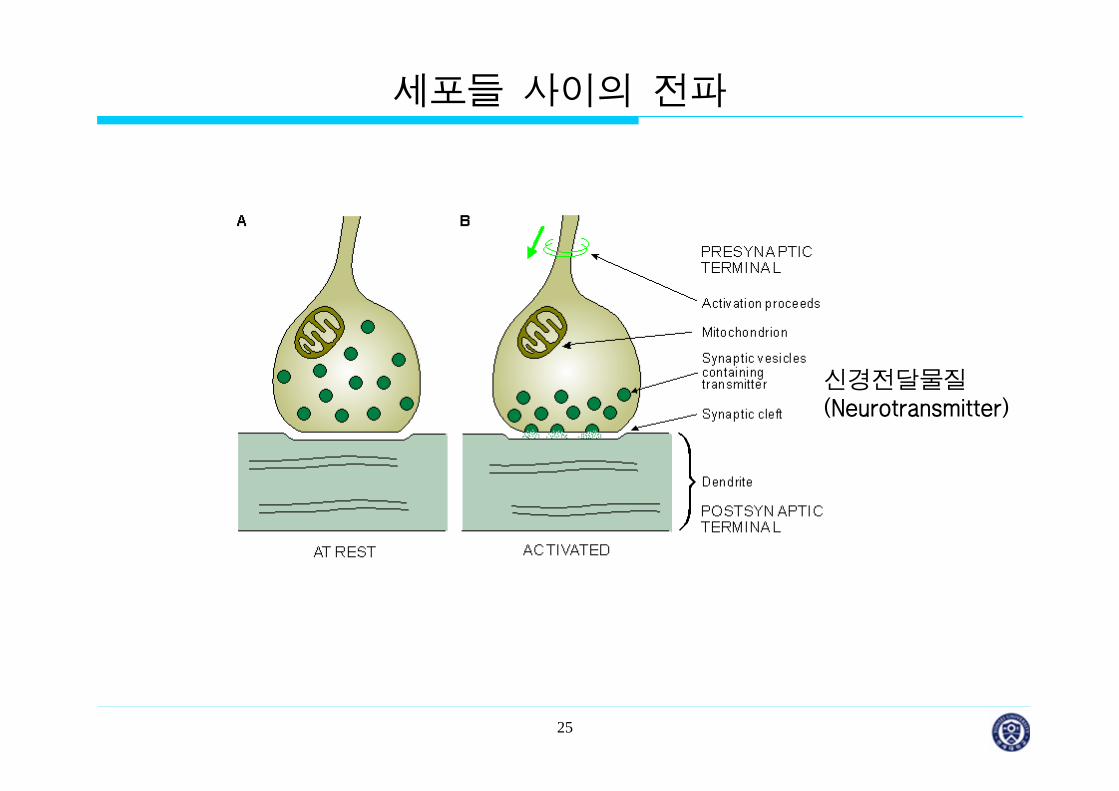
세포들 사이의 전파
신경전달물질(Neurotransmitter)
26
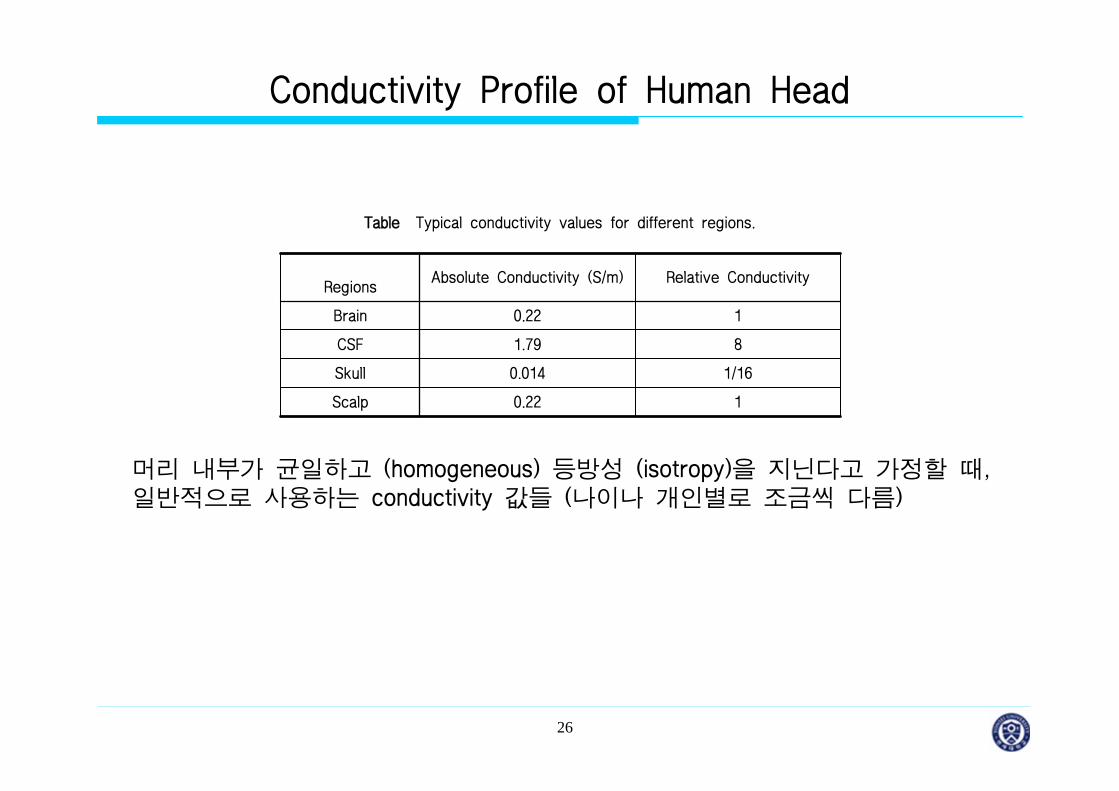
Conductivity Profile of Human Head
Table Typical conductivity values for different regions.
10.22Scalp
1/160.014Skull
81.79CSF
10.22Brain
Relative ConductivityAbsolute Conductivity (S/m)Regions
머리 내부가 균일하고 (homogeneous) 등방성 (isotropy)을 지닌다고 가정할 때, 일반적으로 사용하는 conductivity 값들 (나이나 개인별로 조금씩 다름)

27
Structure of a Human Head
Gray matter
White matter
scalp
skull
cerebrospinal fluid
brain (cerebral cortex)
28
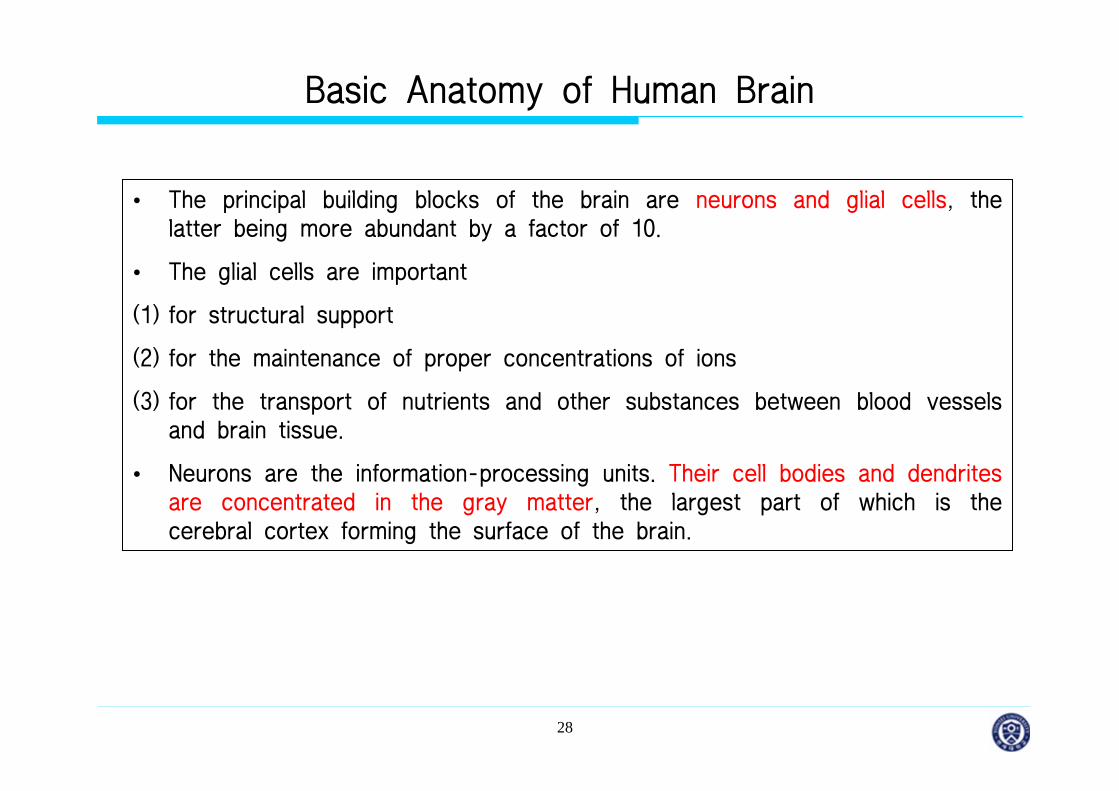
Basic Anatomy of Human Brain
• The principal building blocks of the brain are neurons and glial cells, the latter being more abundant by a factor of 10.
• The glial cells are important
(1) for structural support
(2) for the maintenance of proper concentrations of ions
(3) for the transport of nutrients and other substances between blood vessels and brain tissue.
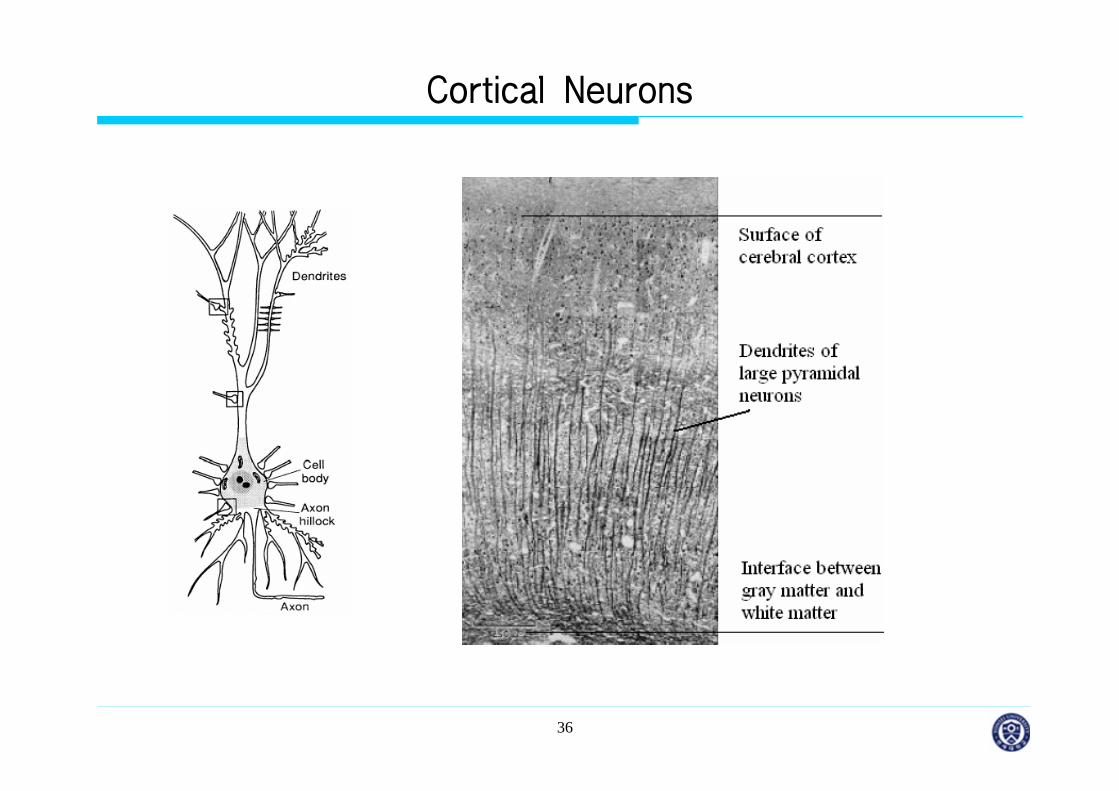
• Neurons are the information-processing units. Their cell bodies and dendrites are concentrated in the gray matter, the largest part of which is the cerebral cortex forming the surface of the brain.
29
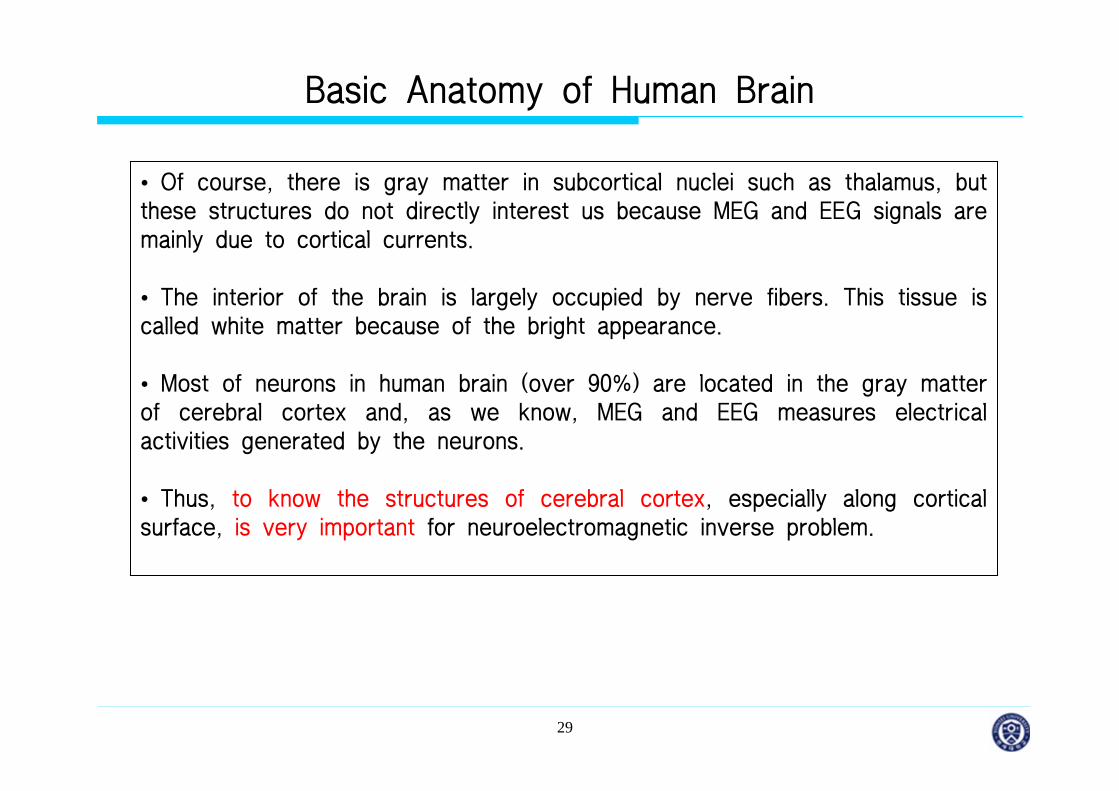
• Of course, there is gray matter in subcortical nuclei such as thalamus, but these structures do not directly interest us because MEG and EEG signals are mainly due to cortical currents.
• The interior of the brain is largely occupied by nerve fibers. This tissue is called white matter because of the bright appearance.
• Most of neurons in human brain (over 90%) are located in the gray matter of cerebral cortex and, as we know, MEG and EEG measures electrical activities generated by the neurons.
• Thus, to know the structures of cerebral cortex, especially along cortical surface, is very important for neuroelectromagnetic inverse problem.
Basic Anatomy of Human Brain

30
Basic Anatomy of Human Brain
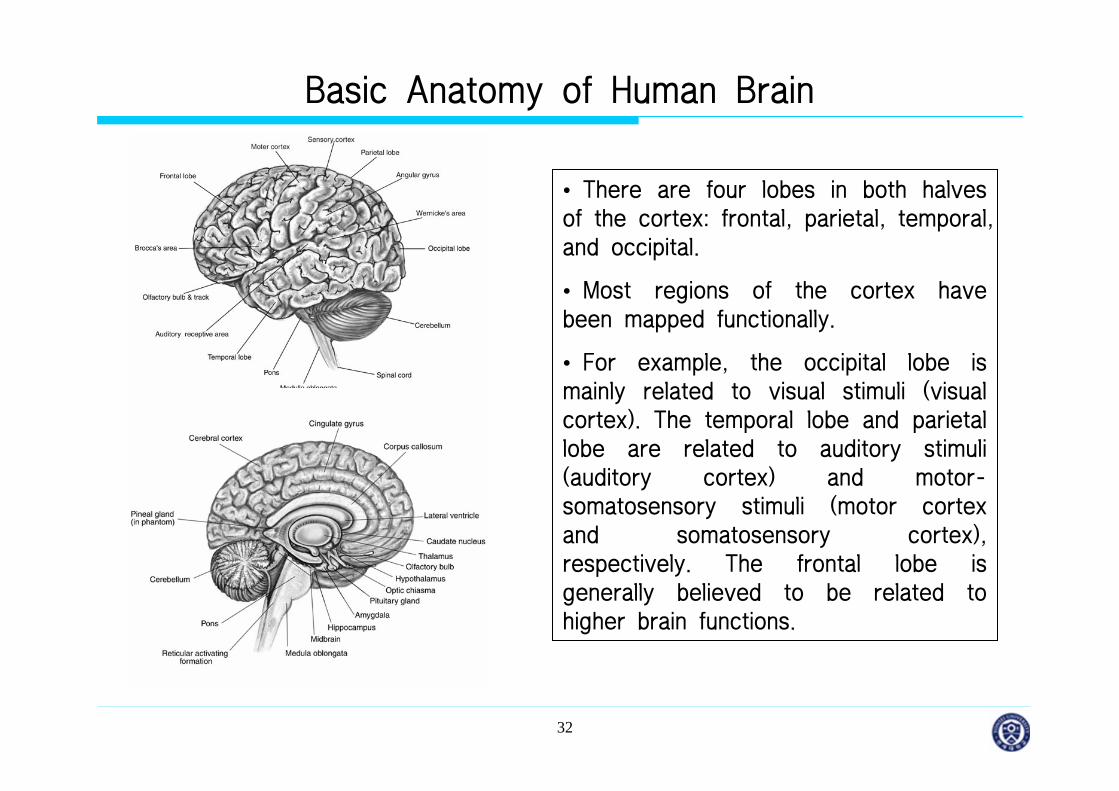
• Left figure shows a human brain viewed from the left side, with main anatomical features identified.
• In MEG and EEG, we are usually concerned with the uppermost layer of the brain, the cerebral cortex, which is a 2~4 mm thick sheet of gray matter.
• The cortex has a total surface area of about 2500cm2, folded in a very complicated way.

31
Basic Anatomy of Human Brain
• The folded cortex structure consists of small valleys (sulcus and gyrus) and large grooves called fissures.
• The longitudinal fissure divides the brain into two hemispheres.
• The left and right halves are divided into lobes by two deep grooves.
• The Rolandic fissure runs down the side of both hemispheres, while the Sylvain fissure is almost horizontal.
32
Basic Anatomy of Human Brain
• There are four lobes in both halves of the cortex: frontal, parietal, temporal, and occipital.
• Most regions of the cortex have been mapped functionally.
• For example, the occipital lobe is mainly related to visual stimuli (visual cortex). The temporal lobe and parietal lobe are related to auditory stimuli (auditory cortex) and motor-somatosensory stimuli (motor cortex and somatosensory cortex), respectively. The frontal lobe is generally believed to be related to higher brain functions.
33
Functional Map of Cerebral Cortex
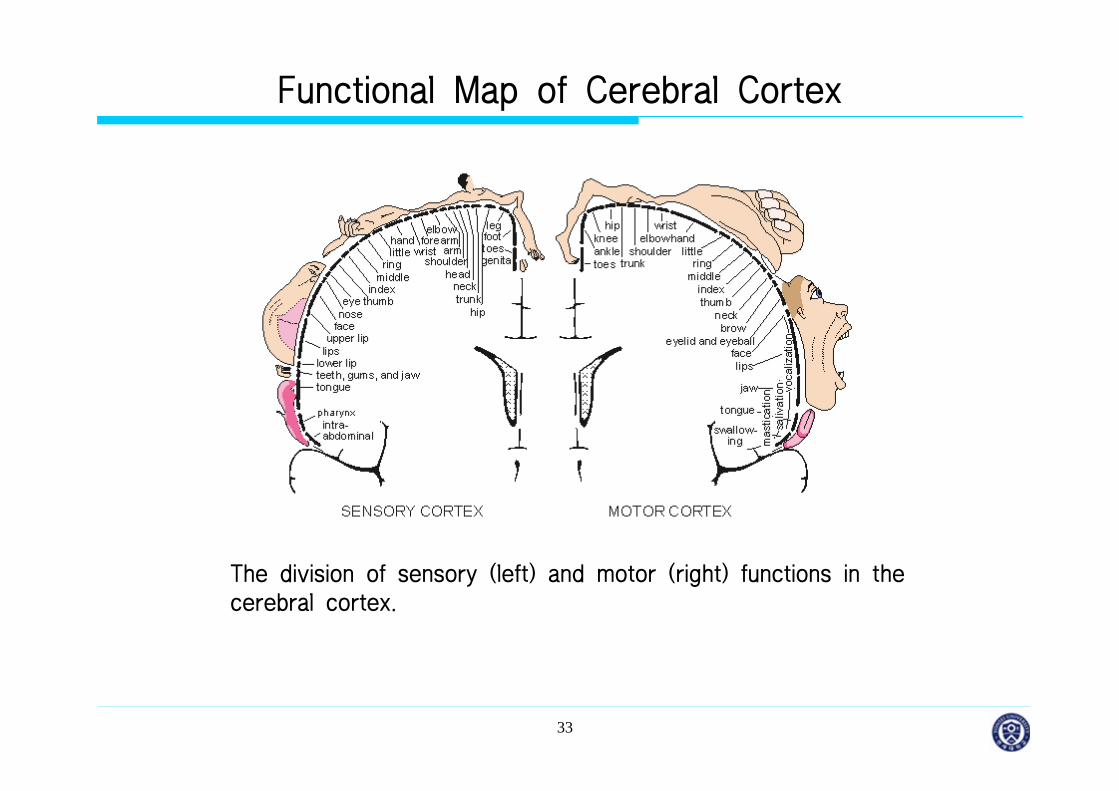
The division of sensory (left) and motor (right) functions in the cerebral cortex.
34
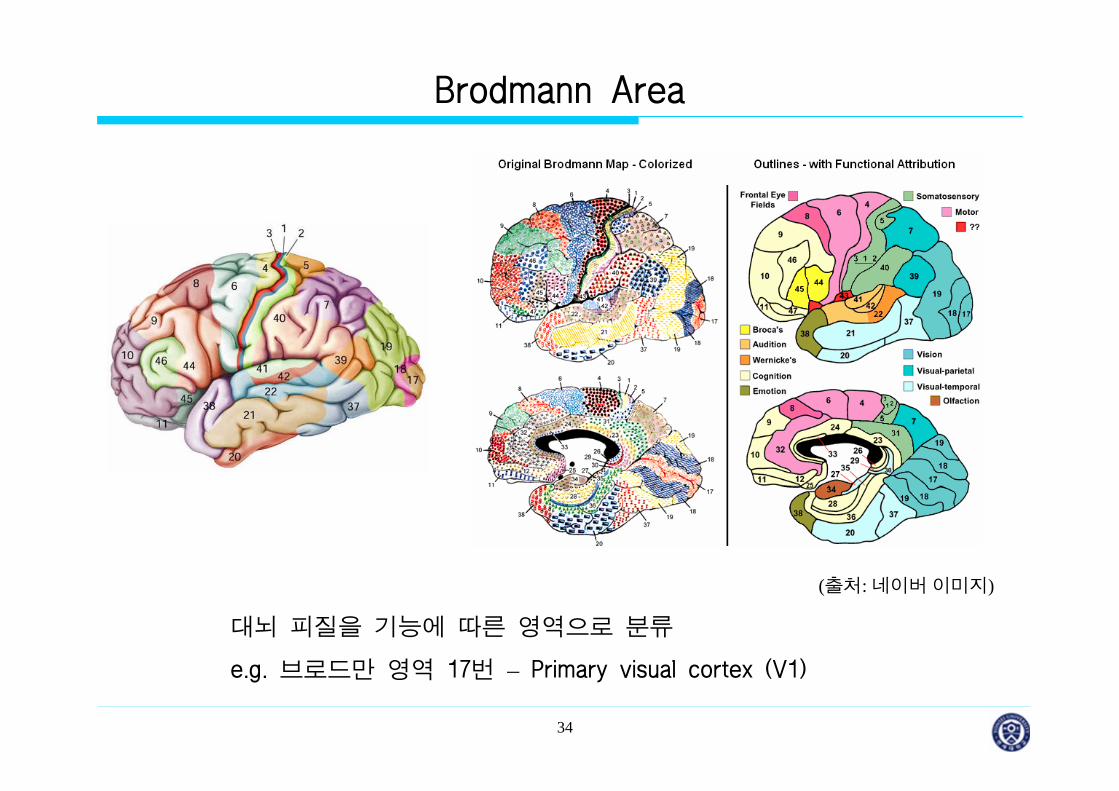
Brodmann Area
대뇌 피질을 기능에 따른 영역으로 분류
e.g. 브로드만 영역 17번 – Primary visual cortex (V1)
(출처: 네이버이미지)
35
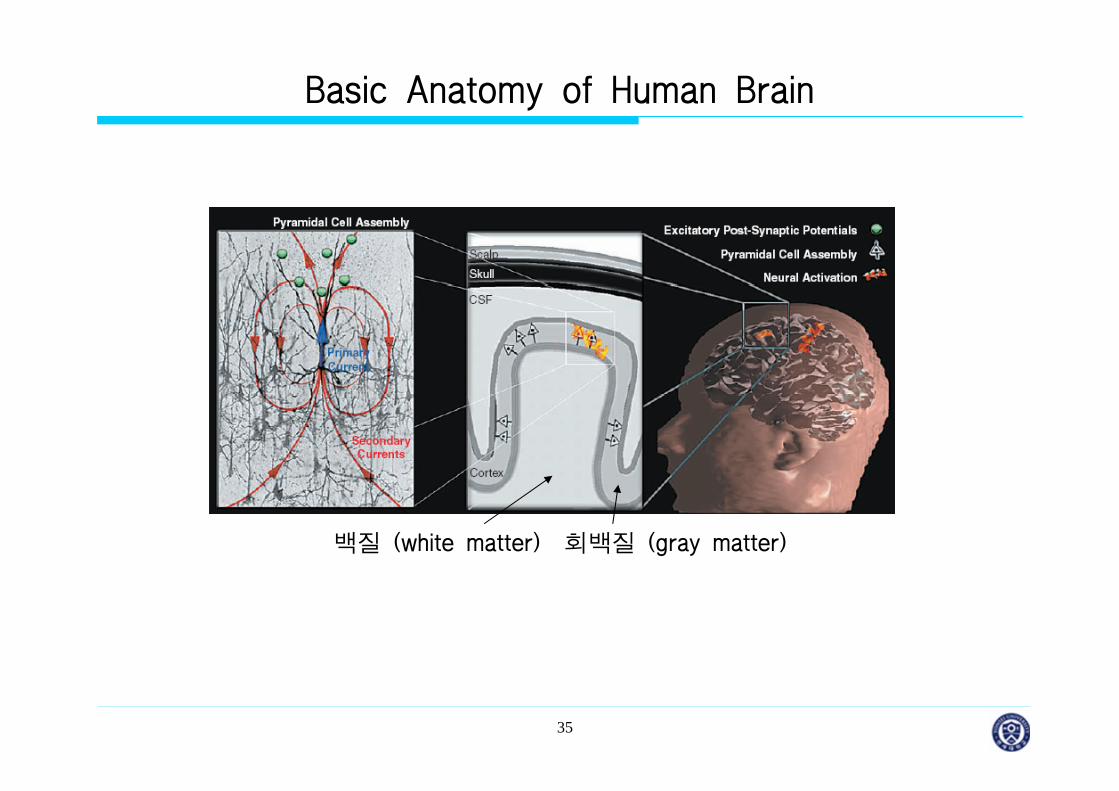
Basic Anatomy of Human Brain
백질 (white matter) 회백질 (gray matter)
36
Cortical Neurons
37
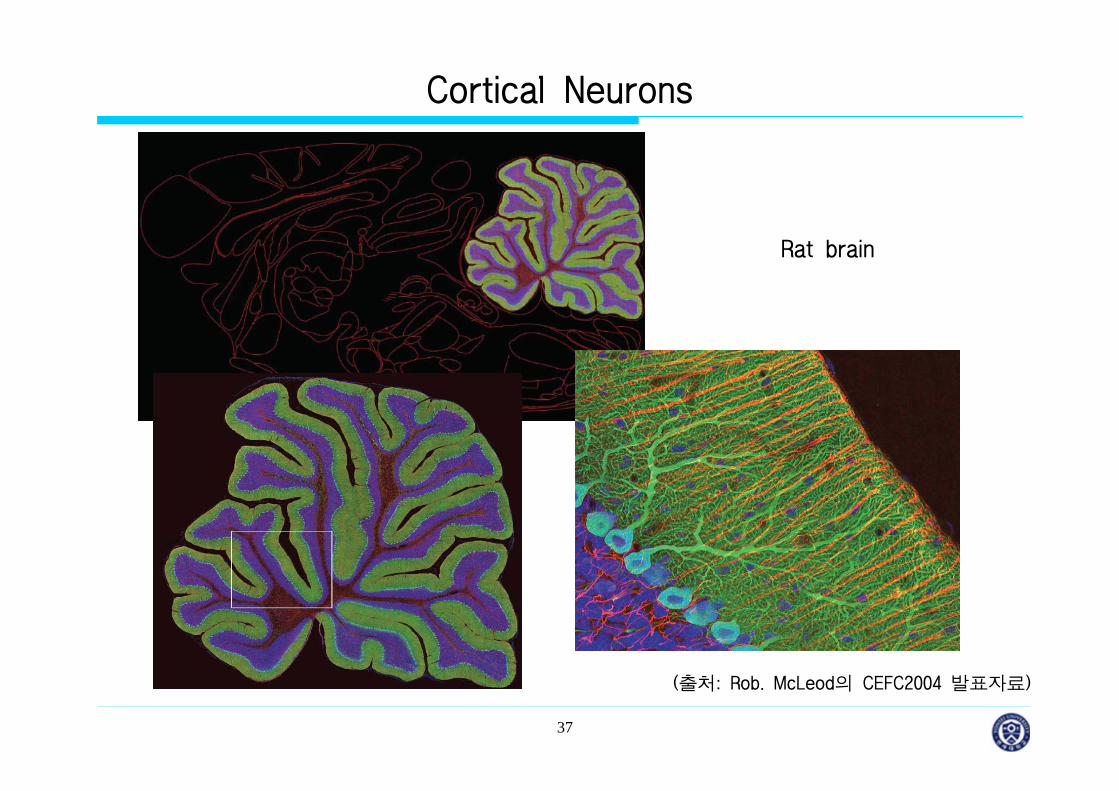
Cortical Neurons
Rat brain
(출처: Rob. McLeod의 CEFC2004 발표자료)
38
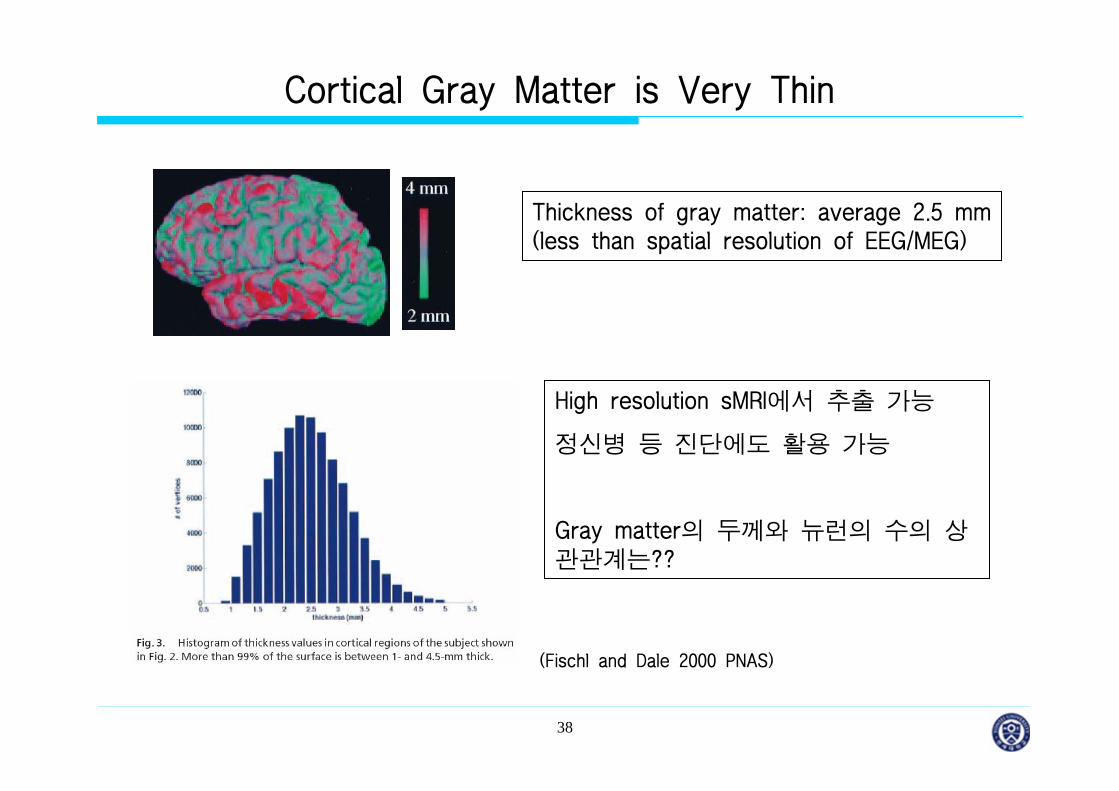
Cortical Gray Matter is Very Thin
Thickness of gray matter: average 2.5 mm(less than spatial resolution of EEG/MEG)
(Fischl and Dale 2000 PNAS)
High resolution sMRI에서 추출 가능
정신병 등 진단에도 활용 가능
Gray matter의 두께와 뉴런의 수의 상관관계는??
39
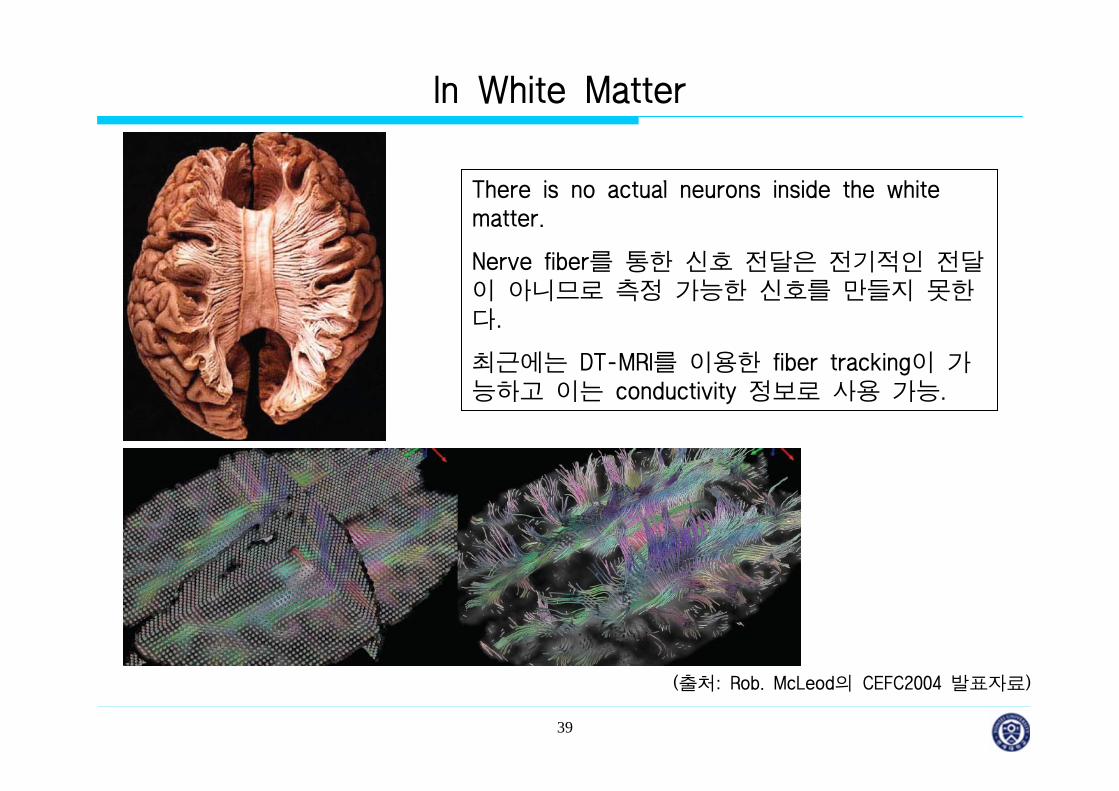
In White Matter
There is no actual neurons inside the white matter.
Nerve fiber를 통한 신호 전달은 전기적인 전달이 아니므로 측정 가능한 신호를 만들지 못한다.
최근에는 DT-MRI를 이용한 fiber tracking이 가능하고 이는 conductivity 정보로 사용 가능.
(출처: Rob. McLeod의 CEFC2004 발표자료)
40
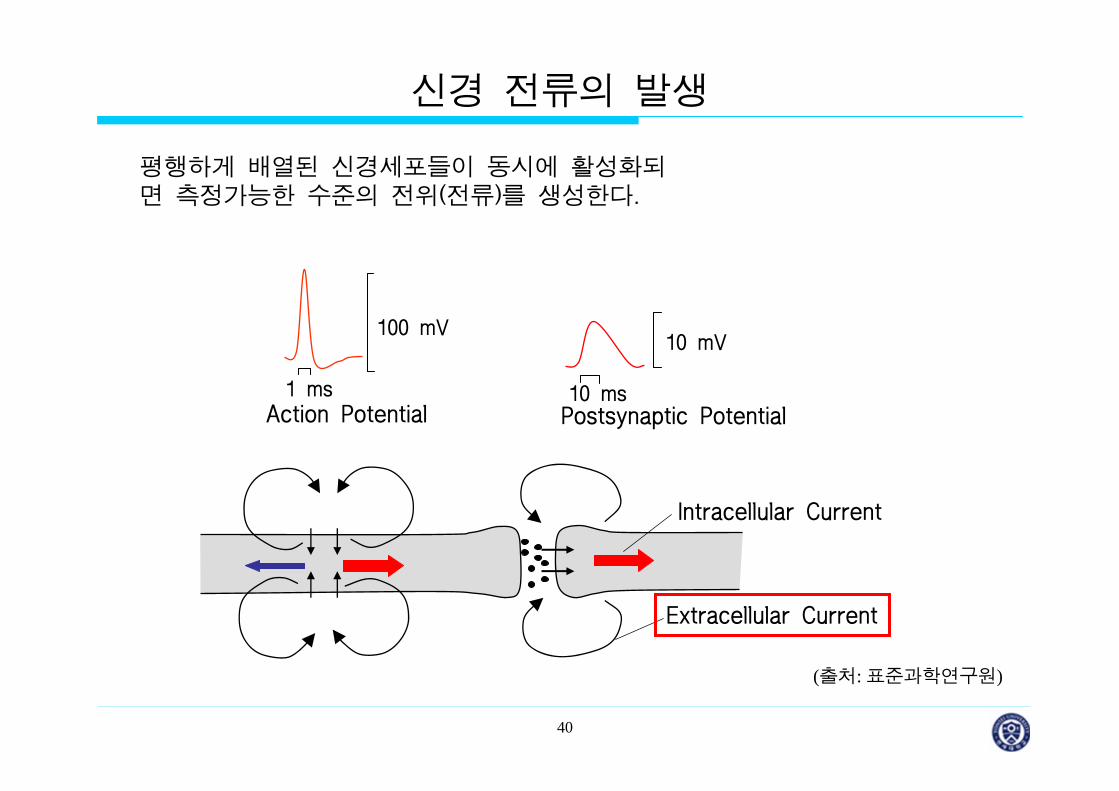
신경 전류의 발생
Action Potential Postsynaptic Potential
100 mV
1 ms 10 ms
10 mV
Extracellular Current
Intracellular Current
평행하게 배열된 신경세포들이 동시에 활성화되면 측정가능한 수준의 전위(전류)를 생성한다.
(출처: 표준과학연구원)

41
What Makes the Measurable Fields?
J
Action Potential Postsynaptic Potential
100 mV
1 ms 10 ms
10 mVor
42
What makes the measurable field?
• It is believed that most measurable extracranial fields are generated by the postsynaptic potential, not by the action potential, because the action potentials are not very likely to occur synchronously in large numbers.
• If, however, large numbers of dendrites are arranged in a parallel way, net effect can be observed. As stated before, dendrites of large pyramidal neurons are arranged perpendicularly to the cortical surface in gray matter.
• Therefore, if they are activated synchronously, measurable electromagnetic fields can be induced outside the head.

43
How Large is the Current?
• Previous studies showed that each synapse along a dendrite may contribute as a 20 fAm current source and current estimated at a location is on the order of 10 nAm.
• Hence, we can imagine that millions of synaptic junctions in a relatively small region are synchronously activated.
• According to Hämäläinen et al.’s calculation, the current density on the cortical surface is on the order of 100 nA/mm2.
44
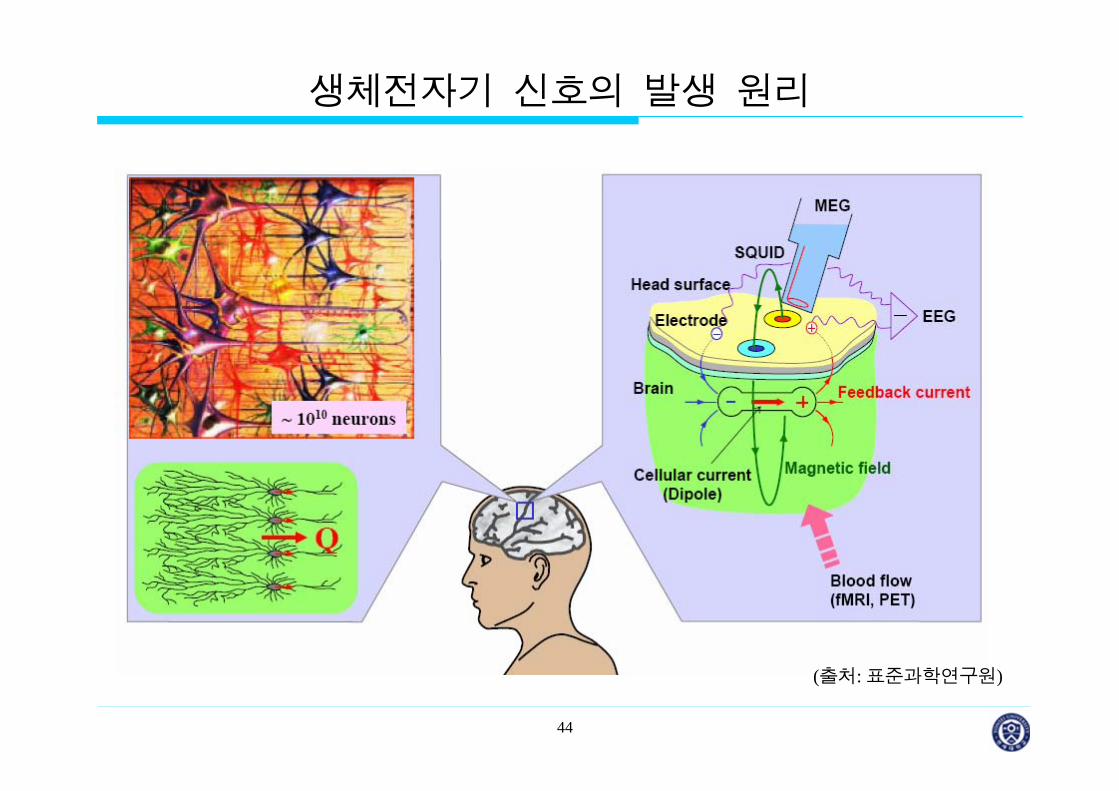
생체전자기 신호의 발생 원리
(출처: 표준과학연구원)

45
3. 뇌파의측정기술

46
EEG
Standard placements of electrodes on the human scalp: A, auricle; C, central; F, frontal; Fp, frontal pole; O, occipital; P, parietal; T, temporal.
47
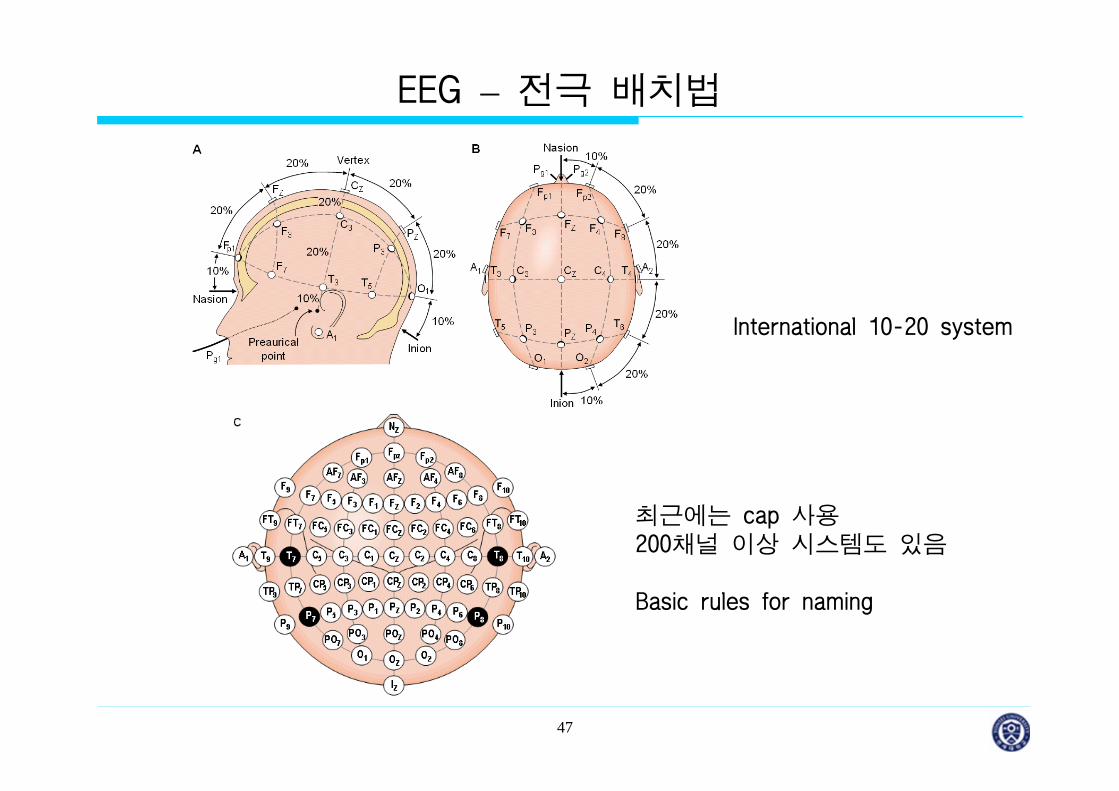
EEG – 전극 배치법
최근에는 cap 사용200채널 이상 시스템도 있음
Basic rules for naming
International 10-20 system

48
Where to put reference?
Why reference is needed??
Where to put reference??
Average reference??
1
1ˆ ( ) ( )MN
i i ref j refjM
V V V V VN =
= − − −∑

49
Some examples of EEG waves

50
EEGPower spectrum:

51
Spontaneous Brain Activity .vs. Evoked Activity
Brain Activity
-Spontaneous activity (cortical oscillation, rhythmic activity)
-Evoked activity : evoked potential (field) .vs. event related potential (field)
How to get EP or ERP???

52
Examples (1)
AEF (출처: 표준과학연구원)

53
Examples (2)
SEF
(출처: 표준과학연구원)

54
Examples (3)
VEP
55
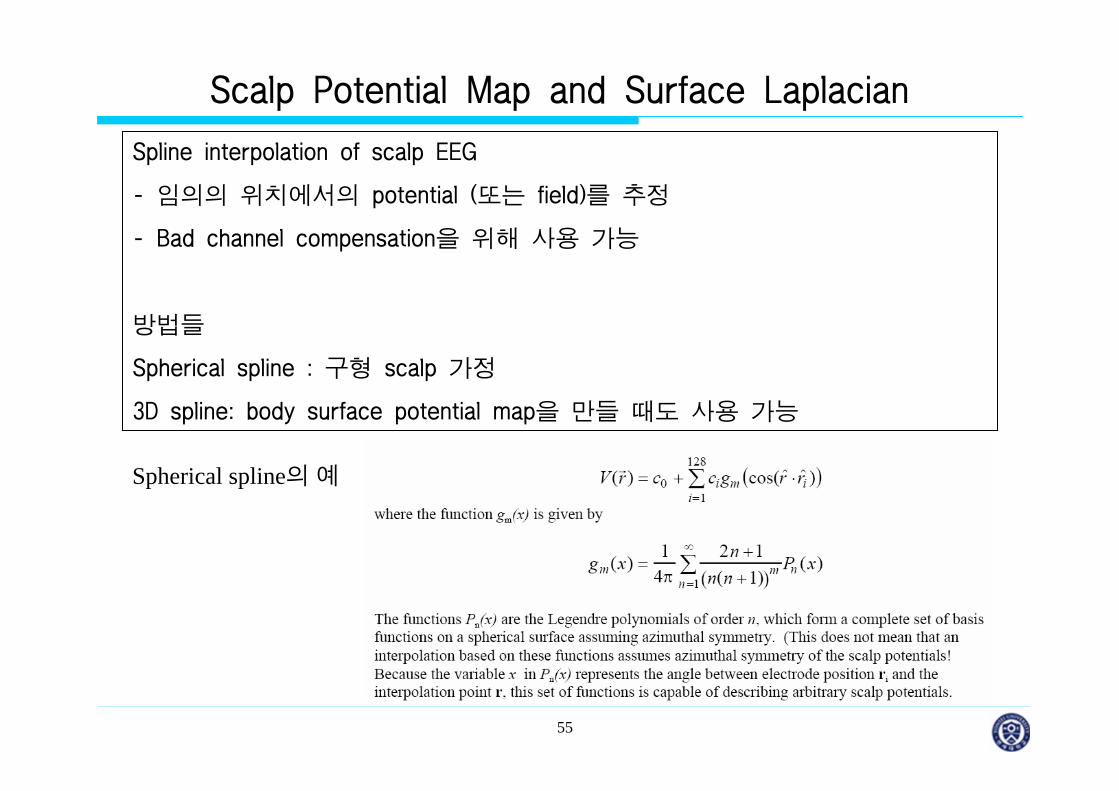
Scalp Potential Map and Surface Laplacian
Spline interpolation of scalp EEG
- 임의의 위치에서의 potential (또는 field)를 추정
- Bad channel compensation을 위해 사용 가능
방법들
Spherical spline : 구형 scalp 가정
3D spline: body surface potential map을 만들 때도 사용 가능
Spherical spline의예

56
Scalp Potential Map and Surface Laplacian
Potential Map의 문제점
1. Reference electrode에 크게 영향을 받음. Average reference를 사용하더라도 유한한 sampling density와 전체를 cover하지 못하는 성질 때문에정확도가 떨어짐
2. Scalp potential은 skull때문에 cortex의 potential에 비해서 blurring이 됨.

57
Scalp Potential Map and Surface Laplacian
Spline interpolation에 의해서 계산된 scalp potential map에 Laplacian을 취하면 보다 해상도가 높은 이미지를 얻을 수 있음.
Head model이나 전기적인 현상을 전혀 고려하지 않아도 됨.
원리: current density의 divergence는 potential의 Laplacian과 같다. (conductivity는 scalp에서 일정하다고 가정) scalp surface를 빠져나가는current density를 본다고 생각하면 됨.
(B. He et al., 1996, IEEE T-BME)
58
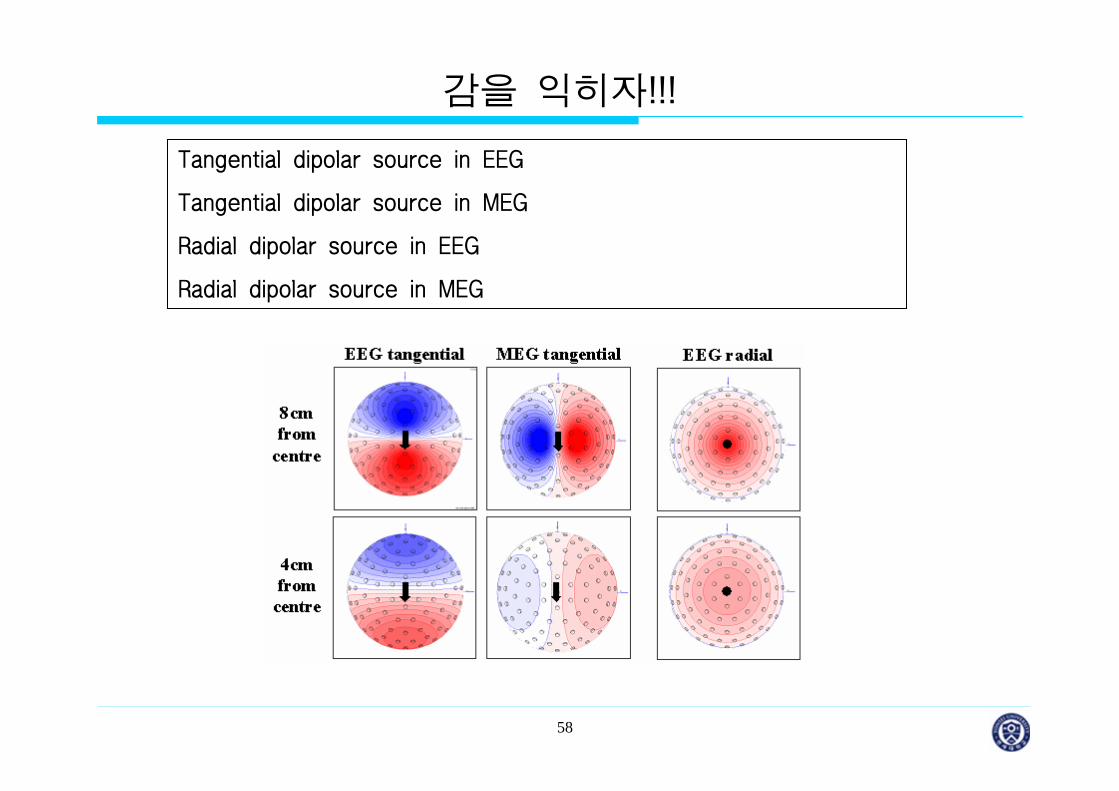
감을 익히자!!!
Tangential dipolar source in EEG
Tangential dipolar source in MEG
Radial dipolar source in EEG
Radial dipolar source in MEG
59
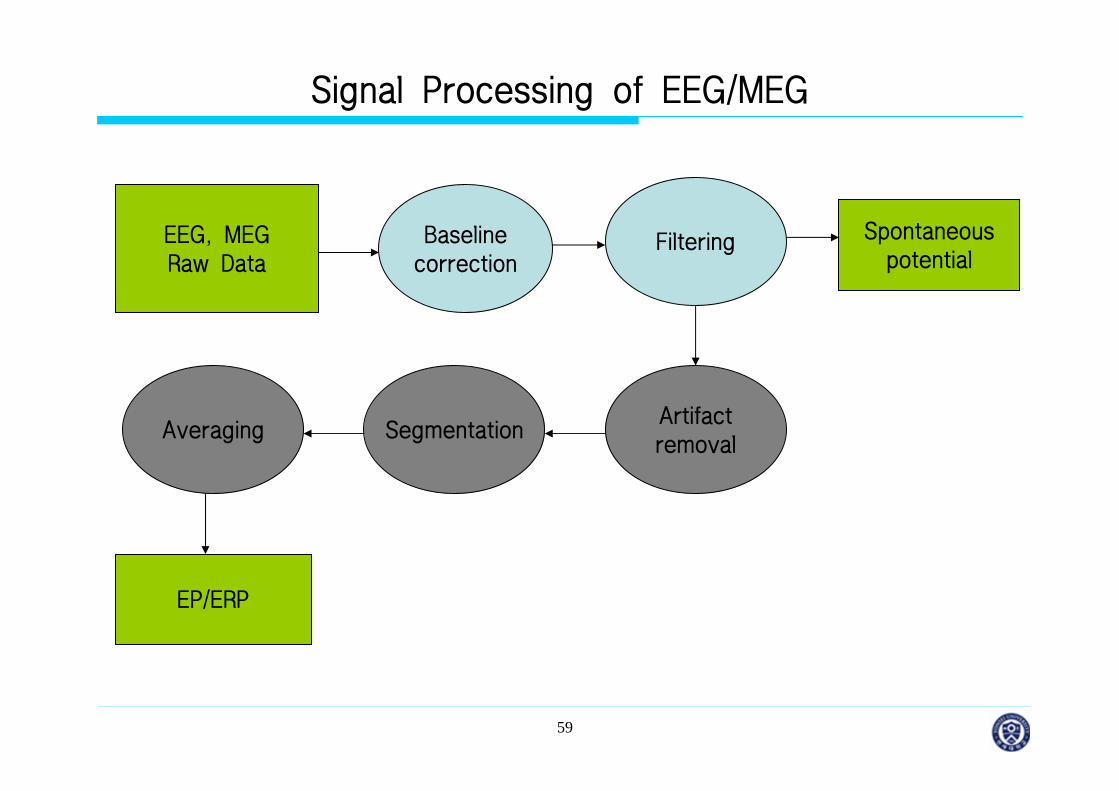
Signal Processing of EEG/MEG
EEG, MEGRaw Data
Baselinecorrection
Filtering
SegmentationArtifactremoval
Averaging
EP/ERP
Spontaneouspotential

60
Baseline Correction
Baseline: 측정 도중 발생하는 shift 현상. (채널마다 zero level이 달라지는 현상) 원인: Noise, brain activity, muscle tension, sweating (EEG)
Baseline correctionor Trend removing

61
Baseline correction 1. 자극을 주기전의 파형을 baseline interval이라고 하고이 동안의 신호를 채널 별로 평균을 계산하여 빼준다.
Constant trend
Baseline correction 2. 전체 신호에 걸쳐 나타나는 선형적인 trend를 제거
Linear trend
Baseline Correction

62
Filtering
sin[2 (5) ] sin[2 (15) ]f t tπ π= +
Bandpass filtering : 1Hz~10Hz
Test function :
f
Filtering 후
일반적으로 Bandpass Filter 사용
테스트

63
Filtering
Bandpass filtering(1 – 30 Hz)

64
Artifact Removal
왜 발생하는가?
어떻게 제거하는가?
65
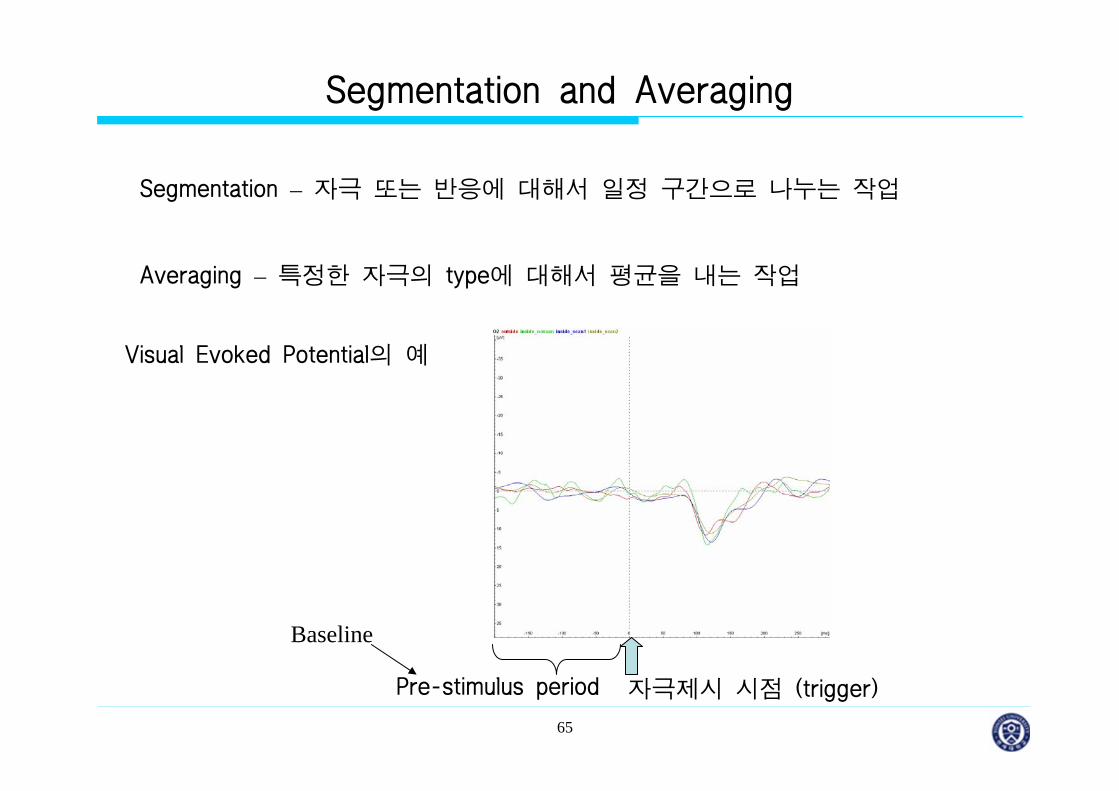
Segmentation and Averaging
Segmentation – 자극 또는 반응에 대해서 일정 구간으로 나누는 작업
Averaging – 특정한 자극의 type에 대해서 평균을 내는 작업
Visual Evoked Potential의 예
자극제시 시점 (trigger)Pre-stimulus period
Baseline
66
4. 뇌파의응용분야

67
EEG, MEG의 응용
• 뇌질환 진단수술 전 수술부위의 기능 매핑 : 수술 후 기능손실 최소화간질발생부위 국소화소아 정신질환 : 학습장애, 독서장애, 자폐증기능성 뇌질환 : 강박증, 실어증알츠하이머 : 뇌위축의 조기발견유아 청각장애 진단
• 뇌기능 연구인지과학 : 기억, 학습, 언어능력, 감성고차 체성감각중추 및 운동중추태아 뇌기능 장애의 조기진단
68
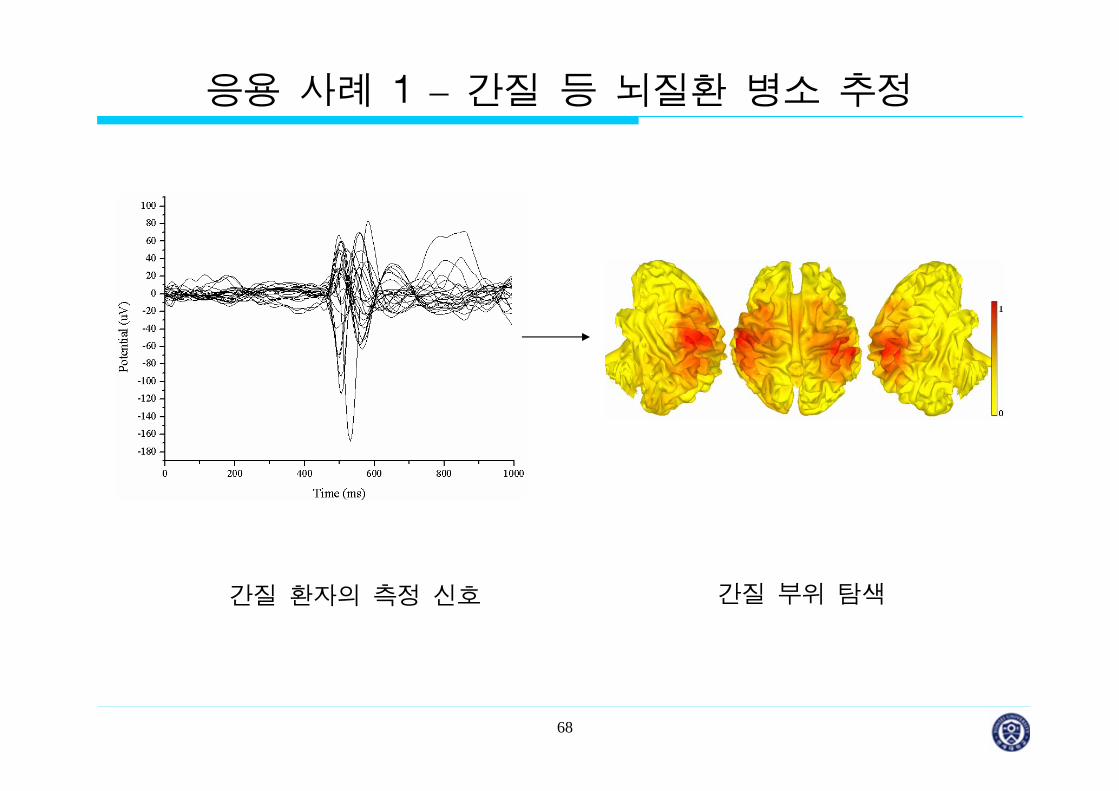
응용 사례 1 – 간질 등 뇌질환 병소 추정
간질 환자의 측정 신호 간질 부위 탐색
69
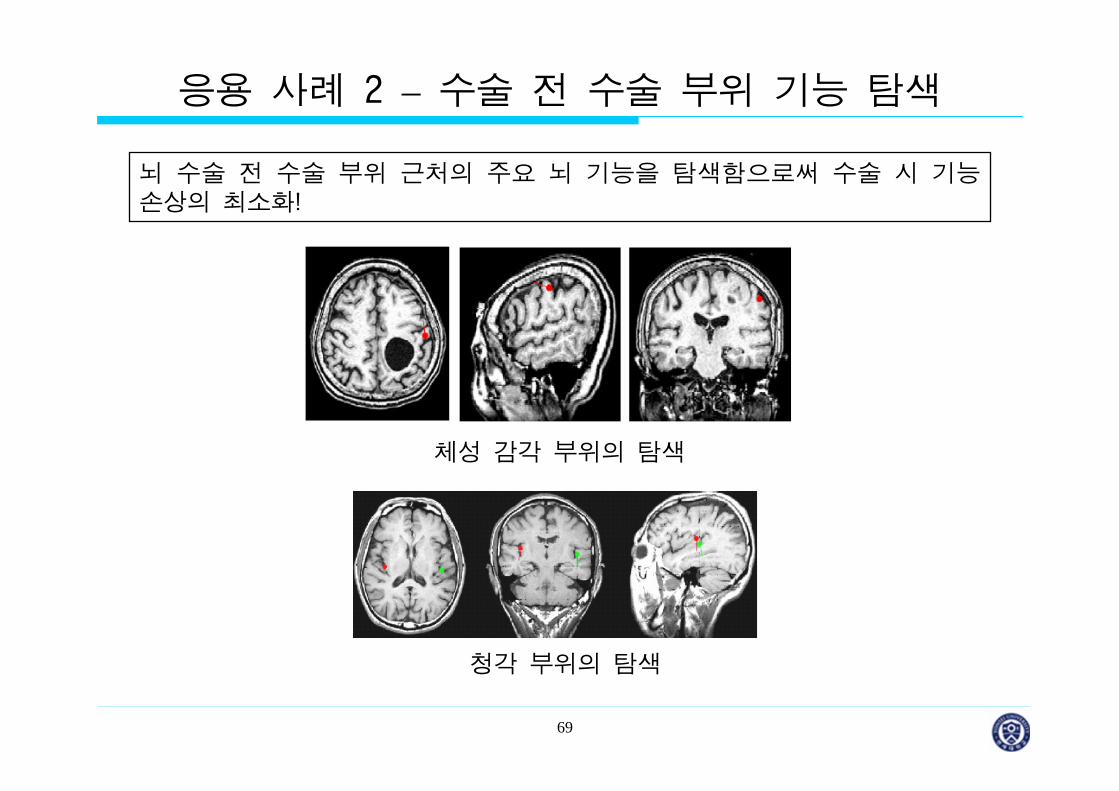
응용 사례 2 – 수술 전 수술 부위 기능 탐색
뇌 수술 전 수술 부위 근처의 주요 뇌 기능을 탐색함으로써 수술 시 기능손상의 최소화!
체성 감각 부위의 탐색
청각 부위의 탐색

70
응용 사례 3 – 정신 질환 진단
• 소아 정신 질환의 정기적인 모니터링, 학습 장애의 조기 진단, 알츠하이머 질환의 조기 진단 (심각한 장애가 나타나기 전에 증상의 변화 조사 가능)
• 기타 강박증, 정신 분열증 환자의 진단 목적으로 사용.
정상인(왼쪽)과 정신 분열증 환자(오른쪽)의 청각 영역 탐색 결과

71
응용 사례 4 – 인지 과학 응용
언어, 음악, 기억, 사고 등의 고차 인지 과정이 어떻게 일어나는지를 확인
언어 인지 과정에서 시간에 따른 좌뇌의 시간에 따른 활성 부위 변화
(미국 MGH 그룹, A. Dale et al.)
시간적인 뇌 활성화 변화를 모니터링 할 수 있다.
72
기타 응용 분야들
1. Neurofeedback
비침습적인 방법으로 특정 뇌파 또는 뇌 활성화를 유도하는 Neuromodulation의 일종
게임을 이용하는 방법이 일반적임
2. EEG/MEG 기반 Brain-Computer Interface (BCI)
상상 (또는 생각)을 통하여 기계 또는 컴퓨터를 제어하는 기술
머리 속에 chip을 이식하는 방식에 비해서 비침습적이나 공간 분해능이 떨어짐

73
기타 응용 분야들
3. 감성공학, 수면감시 (수면장애) – Rhythmic Activity 이용
4. 뇌질환진단
치매환자의진단
74
<참고> 뇌파의 분류
1. 델타파
0.2~4Hz의 주파수와 20~200 V의 진폭을 가지며, 정상인의 깊은 수면상태나 신생아에서 주로 나타난다. 그리고 델타파 상태에서는 많은 양의 성장 호르몬을 생성시키는 것으로 알려져있다. 성장기 청소년이 잠잘 때 키가 큰다는 이야기는 이러한 과학적인 사실이 뒷면에 존재하고 있다.
2. 쎄타파
4~8Hz의 주파수와 20~100 V의 진폭을 가지며, 정서적으로 안정된 상태나 수면에빠지기 전에 나타난다. 그래서 세타파를 흔히 지각과 꿈의 경계상태라고도 부른다. 이 상태에서는 예기치 않은 꿈과 같은 마음의 이미지를 종종 동반하게 되고 그 이미지는 생생한 기억으로 이어지는 경험을 하게 된다. 이것은 곧 갑작스러운 통찰력 또는 창조적 아이디어로 연결되기도 하고 초능력이라는 비현실적이고 미스터리한 환상적 상태로 비춰지기도 한다. 때로는 우리가 오랫동안 어려움을 겪었던 문제해결의아이디어를 제공하는 창조적인 힘이 되기도 한다.

75
3. 알파파
8~13Hz의 주파수와 20~60 V의 진폭을 가지며, 명상 같은 편안한 상태에서 나타나며 스트레스 해소 및 집중력 향상에 도움을 준다. 우리가 눈을 감고 몸을 이완시키면, 뇌파의 활동은 속도를 완화시킨다. 이때 우리 뇌는 알파파를 생산하게 되고, 뇌는 알파상태가 된다. 건강하고 스트레스 없는 상태의 사람들은 알파파 활동상태가 많이 생성되는 경향이 있다. 이러한 알파파를 이용하여 ‘MC 스퀘어’학습 보조용장비가 개발되기도 했다.
4. 베타파
13~30Hz의 주파수와 2~20 V의 진폭을 가지며, 긴장, 흥분 상태 등 활동할 때에나타난다. 운동력 향상에 도움을 주고, 의식이 깨어 있을 때의 뇌파이다. 우리가 눈을 뜨고, 걷고, 흥분하고, 외부 세계에 초점을 맞추고 있는 상태에서는 베타파가 주로 나타난다.
5. 감마파
30~50Hz의 주파수와 2~20 V의 진폭을 가지며, 주로 흥분했을 때 나타난다.
<참고> 뇌파의 분류 (계속)

76
5. 뇌파분석기술소개

77
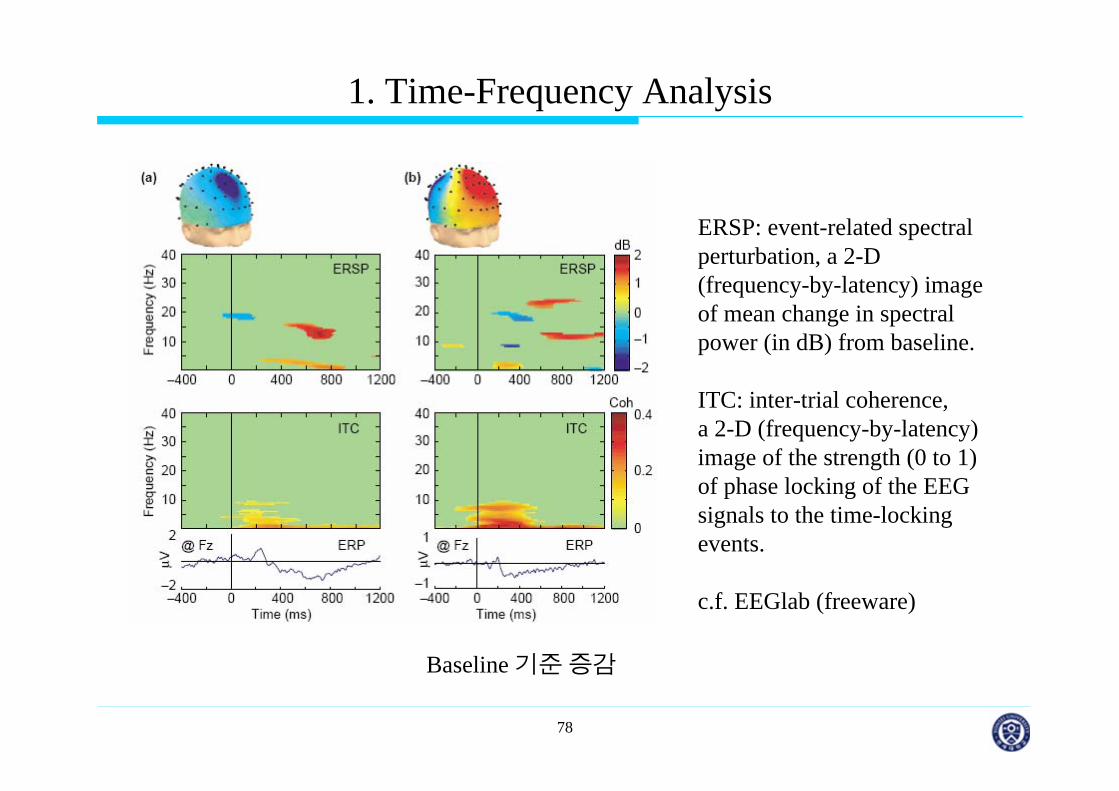
1. Time-Frequency Analysis
FFT(or wavelet), Moving Window
Gamma-band response를이용한뇌정보처리과정분석, 뇌질환진단
78
1. Time-Frequency Analysis
ERSP: event-related spectral perturbation, a 2-D (frequency-by-latency) image of mean change in spectral power (in dB) from baseline.
ITC: inter-trial coherence, a 2-D (frequency-by-latency) image of the strength (0 to 1) of phase locking of the EEG signals to the time-locking events.
c.f. EEGlab (freeware)
Baseline 기준증감

79
2. ICA
ICA: Independent Component Analysis
복합된신호를서로 independent한component들로 분리
각신호원별로 source imaging 또는noise 성분을제거하기위해사용

80
3. EEG Topography
대략적인 source의 a priori knowledge를파악하기위하여사용가능
Pattern을파악하는용도로사용가능

81
4. Brain-Computer Interface
e.g. Motor imagination can make the same brain activation as the real movement.

82
5. Connectivity and Causality
coherence, phase coherence 등을이용한신호들사이의 connectivity 분석. Causality measure를이용한각영역(전극) 사이의인과관계분석 뇌기능분석및뇌질환진단

83
6. 동적신경영상개론
84
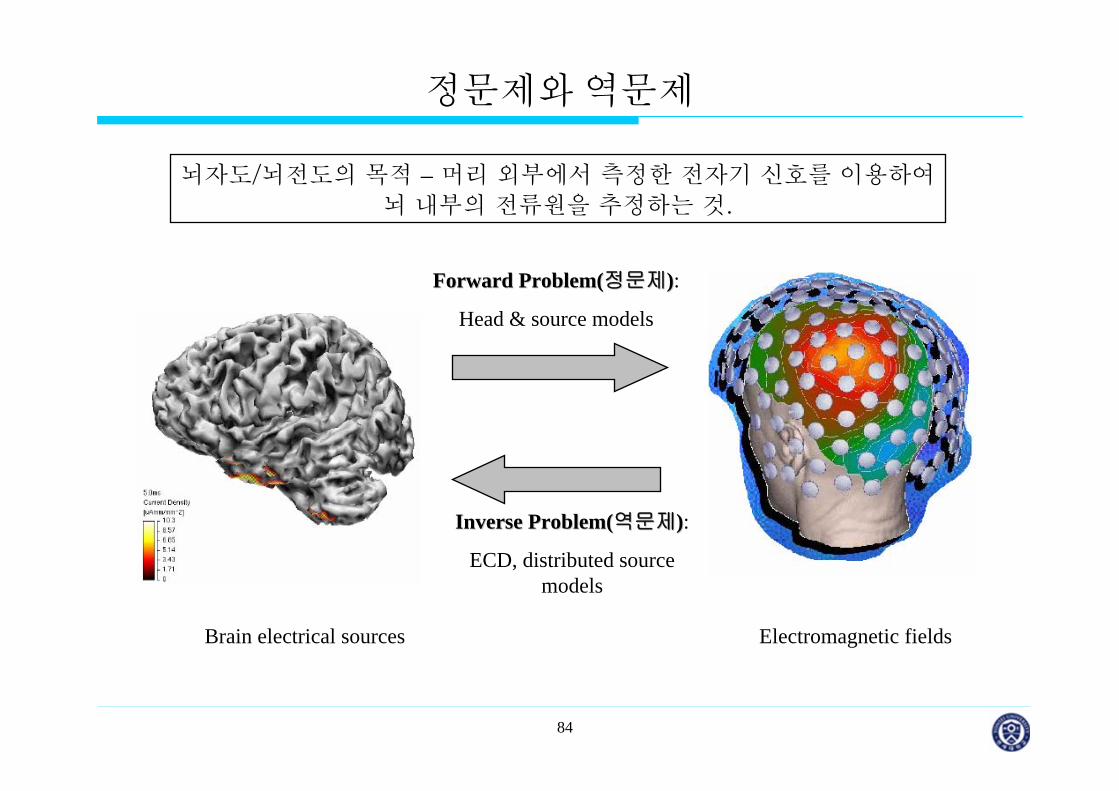
정문제와 역문제
Brain electrical sources Electromagnetic fields
Forward Problem(Forward Problem(정문제정문제)):
Head & source models
Inverse Problem(Inverse Problem(역문제역문제)):
ECD, distributed source models
뇌자도/뇌전도의 목적 – 머리 외부에서 측정한 전자기 신호를 이용하여뇌 내부의 전류원을 추정하는 것.

85
Why Cortical Source Imaging is Required
1. EEG or MEG topographies cannot be directly attributed to the underlying cortical regions since sensors may contain information from multiple brain sources, some of which might overlap, and the topographic maps might be smeared out due to the inhomogeneous conductivity distributions in the human head.
How many sources are there???
(정답: 3개)
86
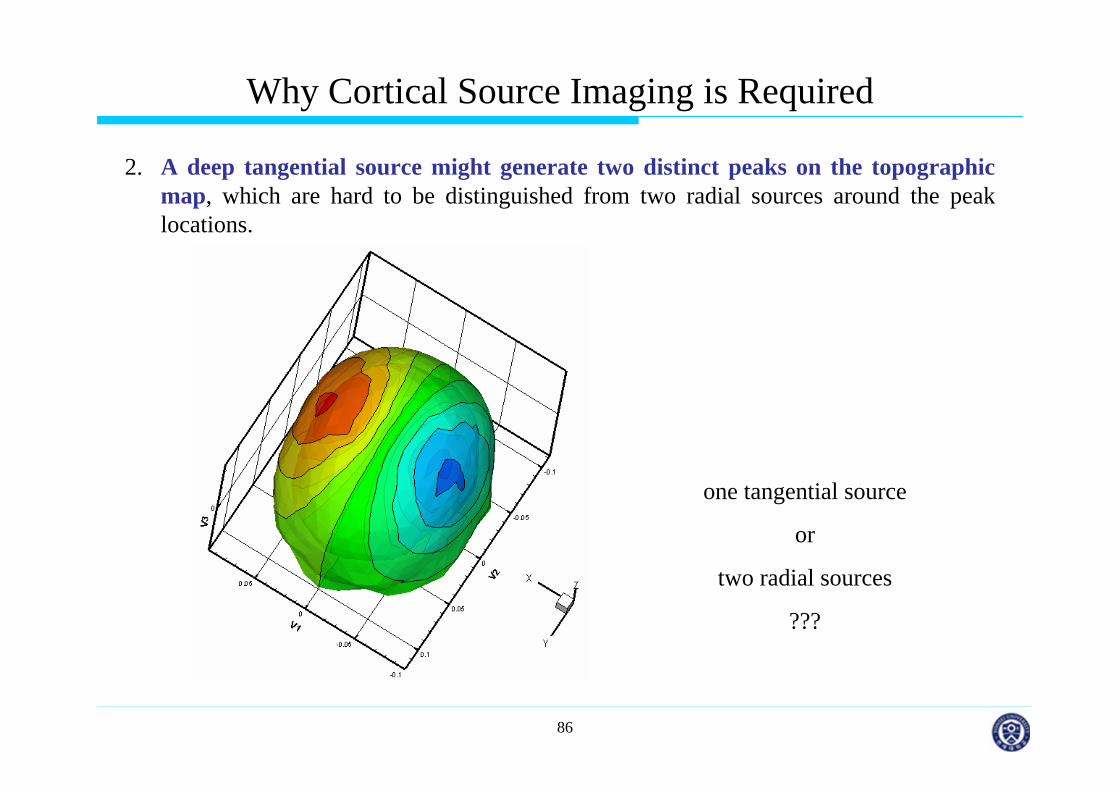
2. A deep tangential source might generate two distinct peaks on the topographic map, which are hard to be distinguished from two radial sources around the peak locations.
one tangential source
or
two radial sources
???
Why Cortical Source Imaging is Required
87
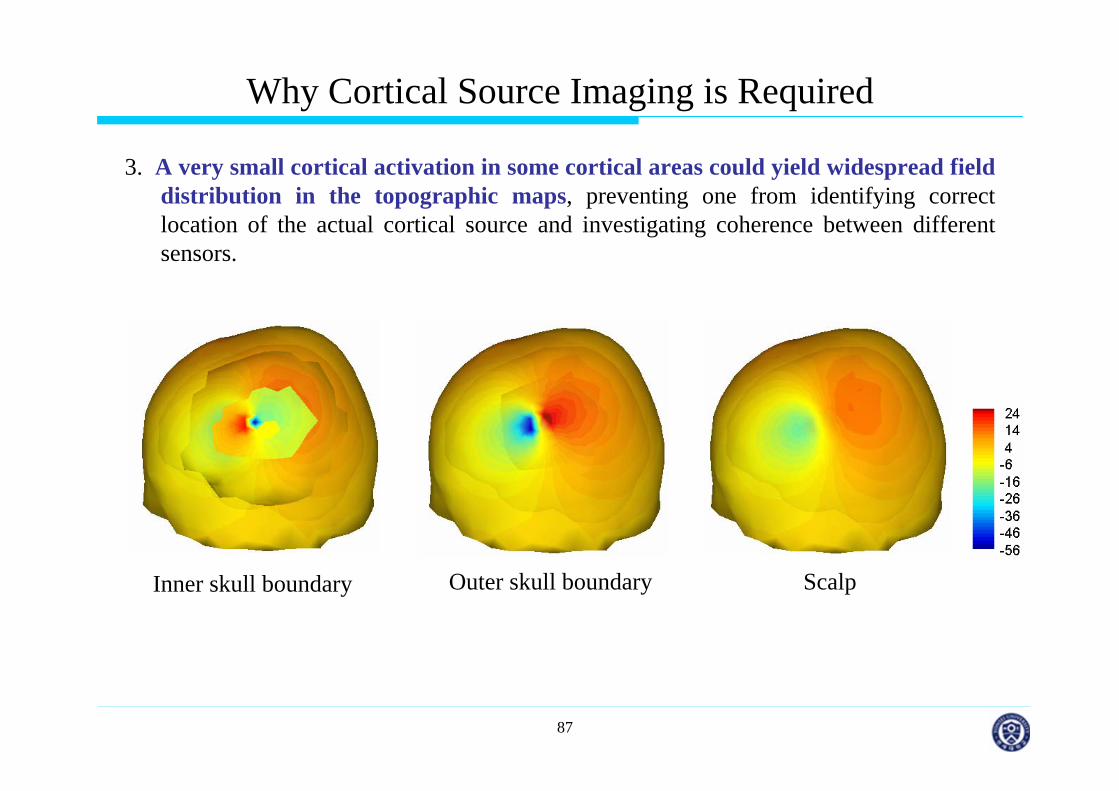
3. A very small cortical activation in some cortical areas could yield widespread field distribution in the topographic maps, preventing one from identifying correct location of the actual cortical source and investigating coherence between different sensors.
Inner skull boundary Outer skull boundary Scalp
Why Cortical Source Imaging is Required
88
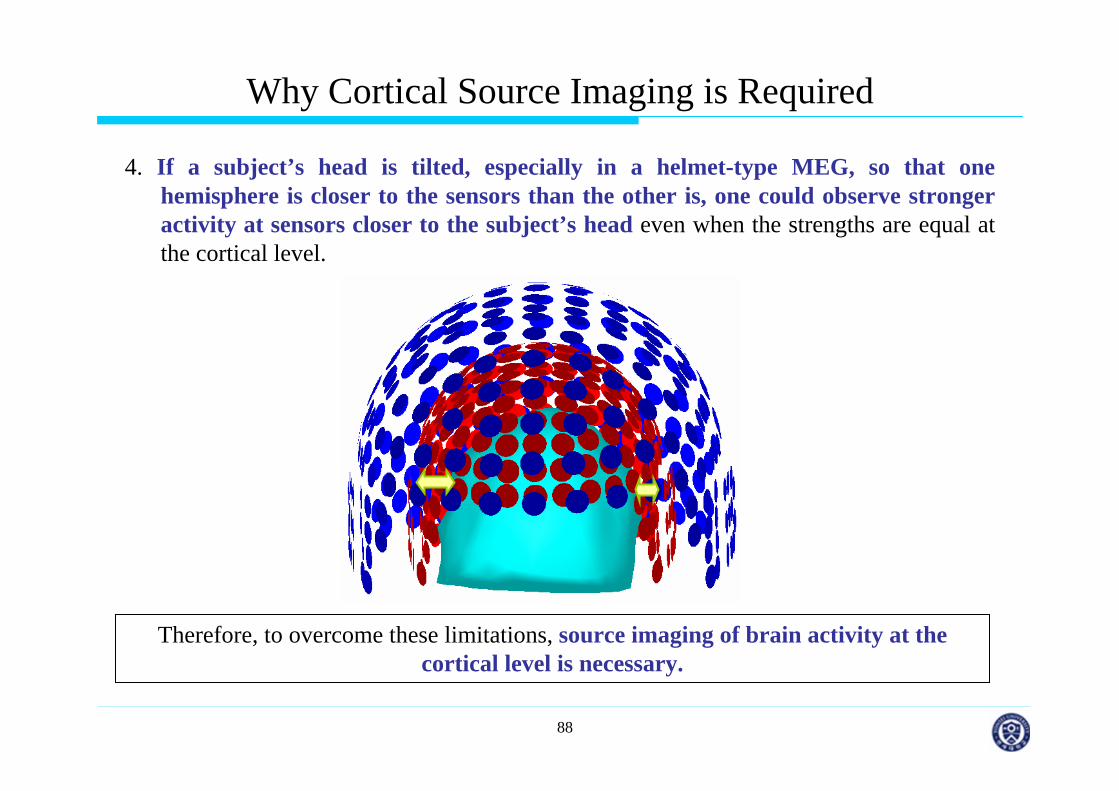
4. If a subject’s head is tilted, especially in a helmet-type MEG, so that one hemisphere is closer to the sensors than the other is, one could observe stronger activity at sensors closer to the subject’s head even when the strengths are equal at the cortical level.
Therefore, to overcome these limitations, source imaging of brain activity at the cortical level is necessary.
Why Cortical Source Imaging is Required

89
Forward Problem 1 – Homogeneous Sphere Model
MEG (J. Sarvas, 1987)
EEG (D. Yao, 2000)
03 2
0
cos1{ 2 [ ]}4 cosp p p
r RVr R r R r r
ϕπσ ϕ
− −= + +
+ −0 0R r R rP Ri
EEG의 경우에 비해 비교적 정확함.
축 방향 성분은 외부 자장을 생성하지 않음
실제 문제에 적용하기에는 부적합함.
02
( ) ( , )( )
4 ( , )Q Q Q
Q
F FB r
Fμπ
× − × ⋅ ∇=
Q r Q r r r rr r
2( , ) ( )Q QF a ra r= + − ⋅r r r r
90
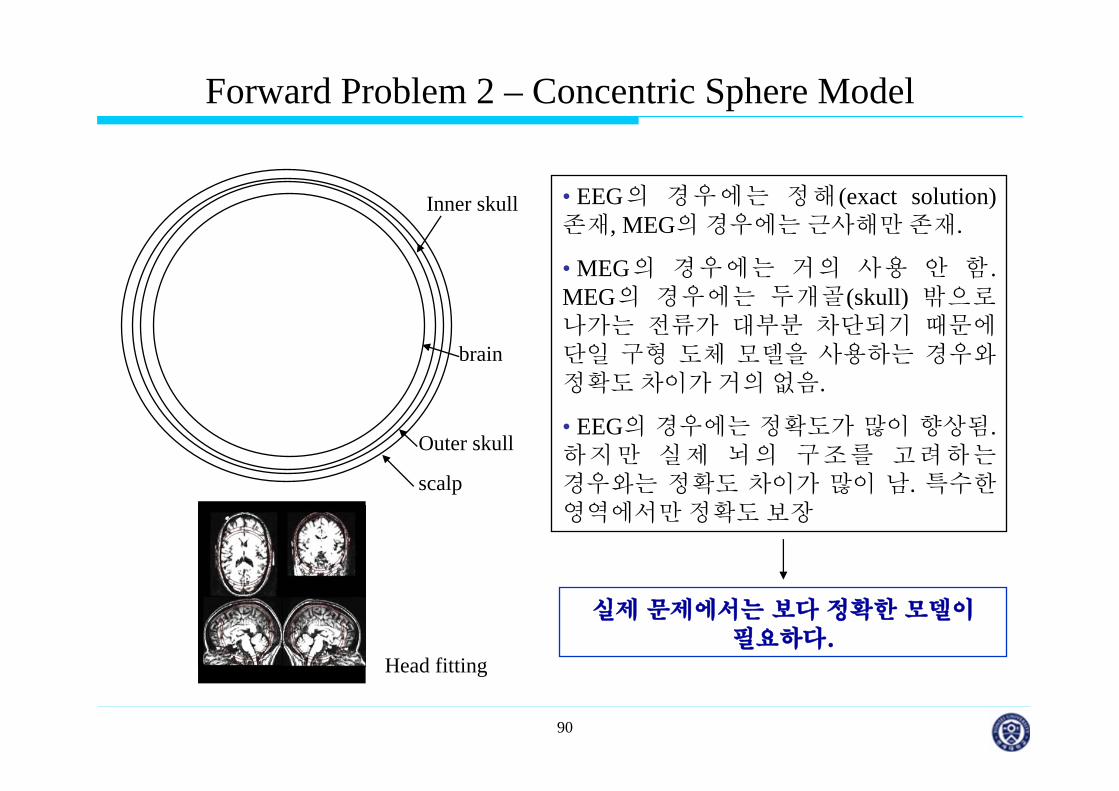
Forward Problem 2 – Concentric Sphere Model
brain
Inner skull
Outer skull
scalp
• EEG의 경우에는 정해(exact solution) 존재, MEG의 경우에는 근사해만 존재.
• MEG의 경우에는 거의 사용 안 함 . MEG의 경우에는 두개골(skull) 밖으로나가는 전류가 부분 차단되기 때문에단일 구형 도체 모델을 사용하는 경우와정확도 차이가 거의 없음.
• EEG의 경우에는 정확도가 많이 향상됨. 하지만 실제 뇌의 구조를 고려하는경우와는 정확도 차이가 많이 남. 특수한영역에서만 정확도 보장
실제 문제에서는 보다 정확한 모델이필요하다.
Head fitting

91
Forward Problem 3 – 경계요소법
0 0( ) ( ) 2 ( )
1 '( ) ( ') ( ') ,2 ij
i j
i j Sij
V V
V d
σ σ σ
σ σπ
+ =
+ − Ω∑ ∫ r
r r
r r ∫⋅∇
=G
p
dvR
V ')'('4
1)(0
0rJr
πσ
∑ ∫ ×−+=ij
S ijjiij RV 'dSRrrBrB 3
00 )'()(
4)()( σσ
πμ
∫ ×= ')'(4
)( 30
0 dvR
pG
RrJrBπμ
In EEG
In MEG, after solving EEG problem
일반적으로 3~4층의 다른 전기전도도를 지니는 영역으로 분류
하고 각 영역은 균일하고isotropic conductivity를 가진다
고 가정함.
뇌자도는 일반적으로 두개골 안쪽 경계 부분만 사용

92
Forward Problem 4 – 유한요소법 (유한차분법)
백질(white matter)의 이방성: Diffuse tensor MRI 이용 - 아직 연구 중인 topic
두개골의 이방성
(축방향 전도도가 더 크다)
유한요소법 (FEM), 유한차분법 (FDM)
• 요소 분할이 어려움 (folded surface)
• 현재 기술로 정확한 이방성 추정 어려움
pV J⋅∇=∇⋅∇ )(σ

93
Neuroelectromagnetic Inverse Problem
1. 뇌자도나 뇌전도 신호는 매우 작은 값을 가지기 때문에 다양한 외란이나 잡음의
영향을 많이 받는다. 따라서 원하지 않는 신호들의 영향을 최소화하는 기법들이
필수적이다.
2. 충분한 사전 정보가 없을 경우, 해의 유일성이 보장되지 않는다.
3. 실제 뇌 내의 정확한 전류 분포를 확인할 방법이 없다. 두개골 모형(phantom)을
이용한 실험을 통해 알고리즘을 검증하거나 실제적인 forward data를 만들어서
결과를 검증한다.
Inverse Methods
• 등가 전류 쌍극자 (equivalent current dipole: ECD) 모델
• 분산 전류원 모델 (distributed source model)

94
Equivalent Current Dipole Localization
ECD MethodDistributed sources are concentrated at some discrete points
K. Uutela, M. Hämäläinen and R. Salmelin, “Global optimization in the localization of neuromagnetic sources,”
IEEE Trans. Biomed. Eng., vol. 45 pp.716-723, 1998.
• 가장 간단하면서 오래된 방법
• Dipole 의 위치 (x, y, z)및 dipole moment vector (Qx,Qy,Qz) 의 값 을최적화 알고리즘을 이용하여 찾음.
• 최근에는 spatio-temporal dipole fit을많이 사용함.
• Deterministic algorithms: Levenberg-Marquardt method, Downhill simplex search, etc. – 국소 최적점에 수렴할가능성 크다.
• Global optimization algorithms: Genetic Algorithm (GA), Simulated Annealing (SA), etc. – 많 은 수 의dipole을 localize하기 힘들다.

95
Equivalent Current Dipole Localization (Cont’d)
Instantaneous Dipole Fit vs Spatio-temporal Dipole Fit
Spatio-temporal Dipole Fit이 Noise 성분에 대해 보다 robust하다 (대부분 사용).
2|| ( ) ||FE = −x A p sError Function
where x is the measured electromagnetic signals, A lead field matrix that relates sensor positions and source locations, p location parameters of dipoles, and s corresponding dipole moment vectors.

96
Equivalent Current Dipole Localization (Cont’d)
Limitations of the ECD method
1. ECD의 개수를 미리 추정할 수 없다 – 가장 큰 문제!
2. ECD의 초기 위치가 실제 해와 차이가 클 경우 국소 최적점에 수렴할 가능성이 크다. Global optimization algorithm은 다수의 ECD에 적용하기에 부적합하다.
3. 기존의 ECD법은 해부학적인 사전 정보를 사용하지 않기 때문에 cerebral cortex바깥 영역에 localize되는 경우가 흔히 발생한다.
BESA라는 상용 소프트웨어를 이용한결과. (4, 5번 dipole의 위치가 cortex를벗어남.)

97
(Cortically) Distributed Source ModelDirectly reconstruct the distribution of current sources
C. H. Im, K. O. An, H. K. Jung, H. Kwon and Y. H. Lee, “Assessment criteria for MEG/EEG cortical patch tests,”
Phys. Med. Biol., Vol. 48, pp. 2561-2573, 2003.
• 많은 수의 ECD를 cortical surface에수직하게 배치한다 . 선형(L2) 또는 비선형(L1) 역산 과정 각ECD의 moment vector를 복원한다.
• ECD의 위치나 개수에 대한 사전정보가 필요 없다.
• 해부학적 정보를 사용하기 때문에ECD법에 비해서 생리학적으로 더실제적이다.
• 최근 많이 사용되고 있는 방법임.
Distributed Source Model
Localization Imaging
98
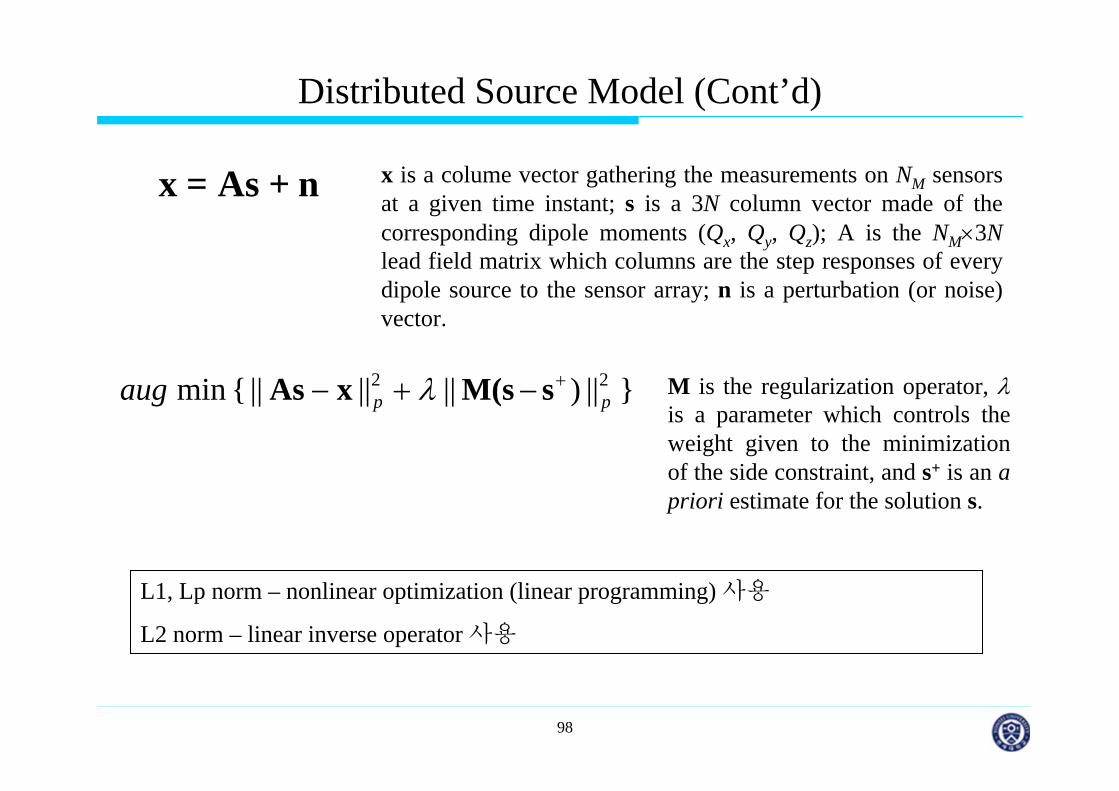
Distributed Source Model (Cont’d)
x = As + n x is a colume vector gathering the measurements on NM sensors at a given time instant; s is a 3N column vector made of the corresponding dipole moments (Qx, Qy, Qz); A is the NM×3Nlead field matrix which columns are the step responses of every dipole source to the sensor array; n is a perturbation (or noise) vector.
}||)||||||{min 22ppaug +−+− sM(sxAs λ M is the regularization operator, λ
is a parameter which controls the weight given to the minimization of the side constraint, and s+ is an a priori estimate for the solution s.
L1, Lp norm – nonlinear optimization (linear programming) 사용
L2 norm – linear inverse operator 사용

99
Distributed Source Model (Cont’d)
}||)||||||{min 22ppaug +−+− sM(sxAs λ
λ(hyperparamter)의 결정: L-curve method, cross-validation method, and other
iterative methods
적절한 a priori term의 결정: 일반적인 Minimum Norm (L2) Estimation
M = I, s+ = 0
LORETA(Low resolution electromagnetic tomography)
M = , s+ = 0
Leadfield Normalization: Leadfield에 sensitivity를 고려한 weighting을 곱해줌.
FOCUSS (Focal underdetermined system solution): recursive하게 weighting update
기타, multiresolution method, LORETA-FOCUSS, Cortical imaging technique, Self-coherent enhancement algorithm 등 다양한 방법이 제안되고 있음.
2∇

100
Distributed Source Model (Cont’d)
Wagner et al., in BIOMAG 2000
여러 방법들의 비교
보다 focal함 보다 smooth함L2 norm estimation

101
Localization of Rhythmic Activity
Importance of Cortical Rhythmic (Spontaneous) Activity
- Cortical rhythmic activity is related to various human movements (limb movements, tactile stimulation, eye movement, etc.), behavioral state (attentive, drowsy, sleeping), and various diseases (Alzheimer, depression, schizophrenia, etc.) .
Necessity of Rhythmic Activity Localization
(1) Induced Potential Problem (Higher cognitive functions)
(2) Field 또는 potential map만으로는 평가가 어려운 경우가 발생함 (e.g. MEG에서head-sensor 위치가 불균일한 경우, EEG에서는 skull에 의한 파형 왜곡)
(3) Task-related modulation을 관찰할 때, suppression/rebound의 시점을 정확하게 추정하기 위해서는 rhythmic activity가 발생하는 지점을 localize할 필요가 있음
(4) Application to Brain-Computer Interface (BCI): 보다 정확한 cortical rhythmic activity 관찰
(5) Task-related cortical synchronization의 변화가 hemodynamic response와 잘 일치한다는 연구결과들이 지속적으로 발표되고 있음.

102
Localization of Rhythmic Activity (Cont’d)
Techniques to localize rhythmic activity
(1) ECD Approach – 특정 frequency band의 신호에 해서 dipole source localization (e.g. 10 ms마다) dipole density plot으로 도시함
(2) Dynamic Imaging of Coherent Sources (DICS) – Sensor들 간의 Cross-spectral density를 적절한 forward relationship을 이용하여 brain grid로 mapping 특정주파수에서의 각 brain grid point끼리의 coherence를 계산함 특정 주파수 의neural interaction을 파악할 수 있음
(3) 특정 주파수에서의 spatial power pattern이용한 Minimum Norm Estimation: Frequency-Domain Minimum Current Estimation (MCE-FD), Spectral Spatiotemporal MNE, etc.
(4) Synthetic Aperture Magnetometry (SAM) – each voxel in the brain is linked to the detection array using an optimal spatial filter for that voxel. The MEG or EEG data is then projected through this spatial filter to give a measure of current density, as a function of time, in the target voxel. 각 voxel별로 Time-Frequency Analysis

103
Localization of Rhythmic Activity (Cont’d)
Niljestrom et al., Neuroimage, 2005
Group averaged SAM image(Singh et al., Neuroimage, 2002)
Typical MNE (Lin et al., Neuroimage, 2004)
104
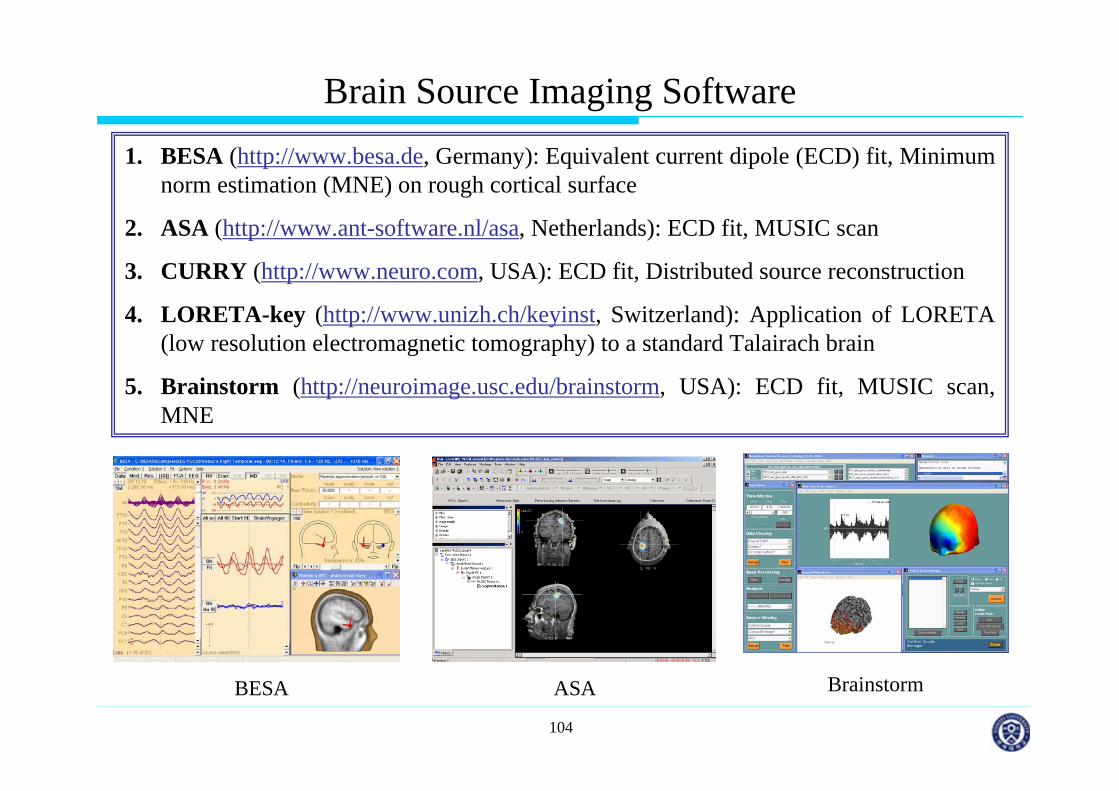
Brain Source Imaging Software1. BESA (http://www.besa.de, Germany): Equivalent current dipole (ECD) fit, Minimum
norm estimation (MNE) on rough cortical surface
2. ASA (http://www.ant-software.nl/asa, Netherlands): ECD fit, MUSIC scan
3. CURRY (http://www.neuro.com, USA): ECD fit, Distributed source reconstruction
4. LORETA-key (http://www.unizh.ch/keyinst, Switzerland): Application of LORETA (low resolution electromagnetic tomography) to a standard Talairach brain
5. Brainstorm (http://neuroimage.usc.edu/brainstorm, USA): ECD fit, MUSIC scan, MNE
BESA ASA Brainstorm
105
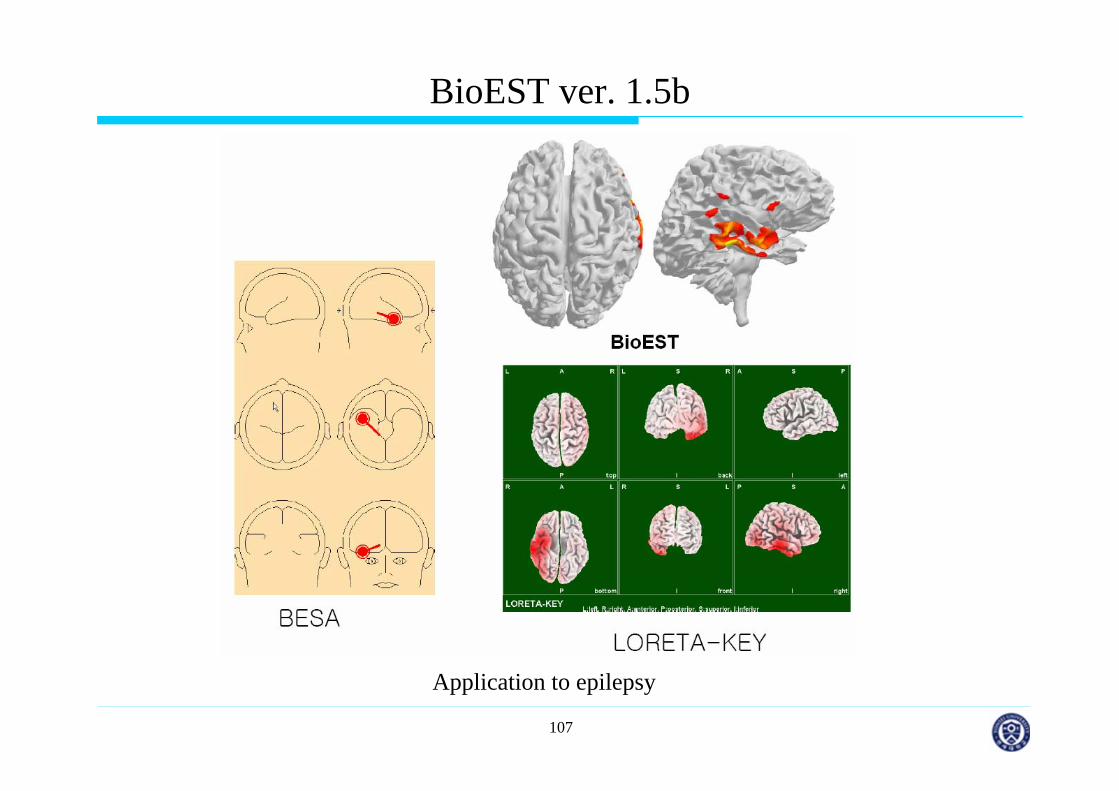
BioEST ver. 1.5b
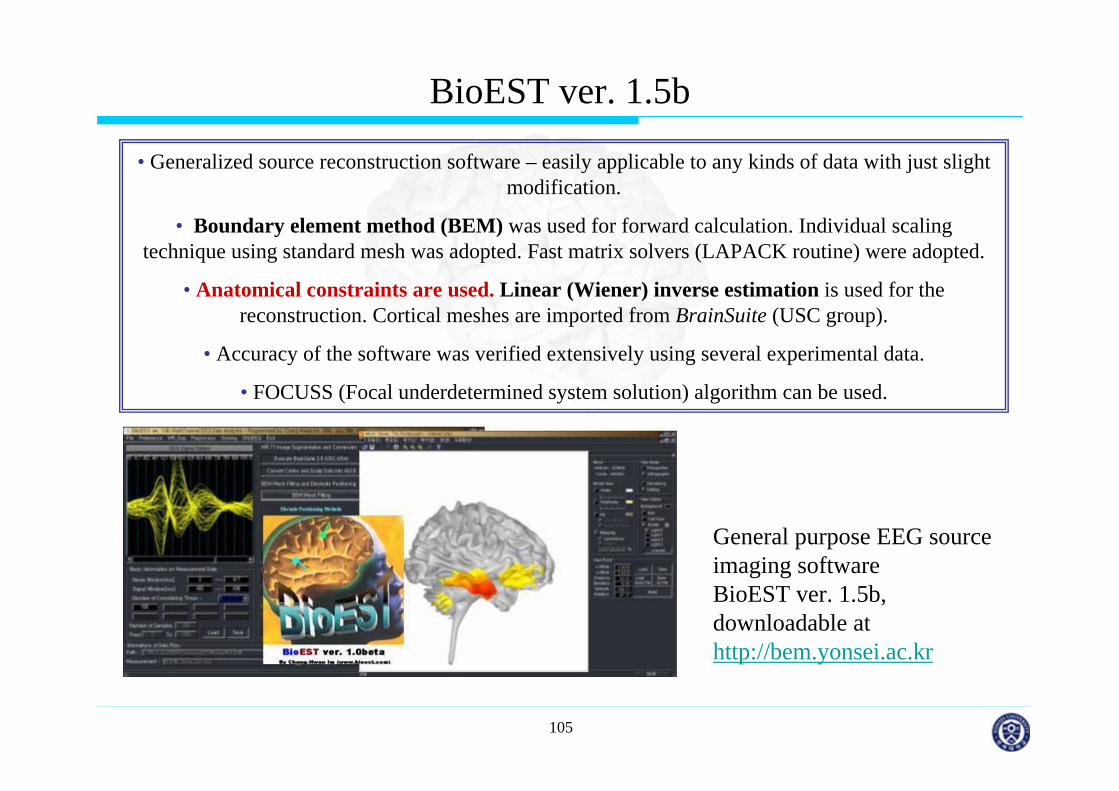
• Generalized source reconstruction software – easily applicable to any kinds of data with just slight modification.
• Boundary element method (BEM) was used for forward calculation. Individual scaling technique using standard mesh was adopted. Fast matrix solvers (LAPACK routine) were adopted.
• Anatomical constraints are used. Linear (Wiener) inverse estimation is used for the reconstruction. Cortical meshes are imported from BrainSuite (USC group).
• Accuracy of the software was verified extensively using several experimental data.
• FOCUSS (Focal underdetermined system solution) algorithm can be used.
General purpose EEG source imaging softwareBioEST ver. 1.5b, downloadable at http://bem.yonsei.ac.kr

106
BioEST ver. 1.5b
Application to a simple visual process
107
BioEST ver. 1.5b
Application to epilepsy

108
BioEST-MEG version 0.5b
Integrating fMRI and MEG


![[백종현]헤겔의 '윤리국가' 이론](https://static.fdocument.pub/doc/165x107/55cf9ca0550346d033aa79b9/-55cf9ca0550346d033aa79b9.jpg)