台大農藝系 遺傳學 601 20000 Chapter 13 slide 1 CHAPTER 13 Gene Mapping In Eukaryotes Peter...
59
台台台台台 台台台 601 20000 Chapter 13 slide 1 CHAPTER 13 Gene Mapping In Eukaryotes Peter J. Russell edited by Yue-Wen Wang Ph. D. Dept. of Agronomy, NTU
-
Upload
stuart-lambert -
Category
Documents
-
view
221 -
download
1
Transcript of 台大農藝系 遺傳學 601 20000 Chapter 13 slide 1 CHAPTER 13 Gene Mapping In Eukaryotes Peter...
台大農藝系 遺傳學 601 20000 Chapter 13 slide 1
CHAPTER 13Gene Mapping In
Eukaryotes
Peter J. Russell
edited by Yue-Wen Wang Ph. D.Dept. of Agronomy, NTU

台大農藝系 遺傳學 601 20000 Chapter 13 slide 2
Discovery of Genetic Linkage1. Genes on non-homologous chromosomes assort
independently, but genes on the same chromosome (syntenic genes) may instead be inherited together (linked), and belong to a linkage group.
2. Classical genetics analyzes the frequency of allele recombination in progeny of genetic crosses.a. New associations of parental alleles are recombinants,
produced by genetic recombination.
b. Testcrosses determine which genes are linked, and a linkage map (genetic map) is constructed for each chromosome.
c. Genetic maps are useful in recombinant DNA research and experiments dealing with genes and their flanking sequences.
3. Current high-resolution maps include both gene markers from testcrosses, and DNA markers composed of genomic regions that differ detectably between individuals.
台大農藝系 遺傳學 601 20000 Chapter 13 slide 3
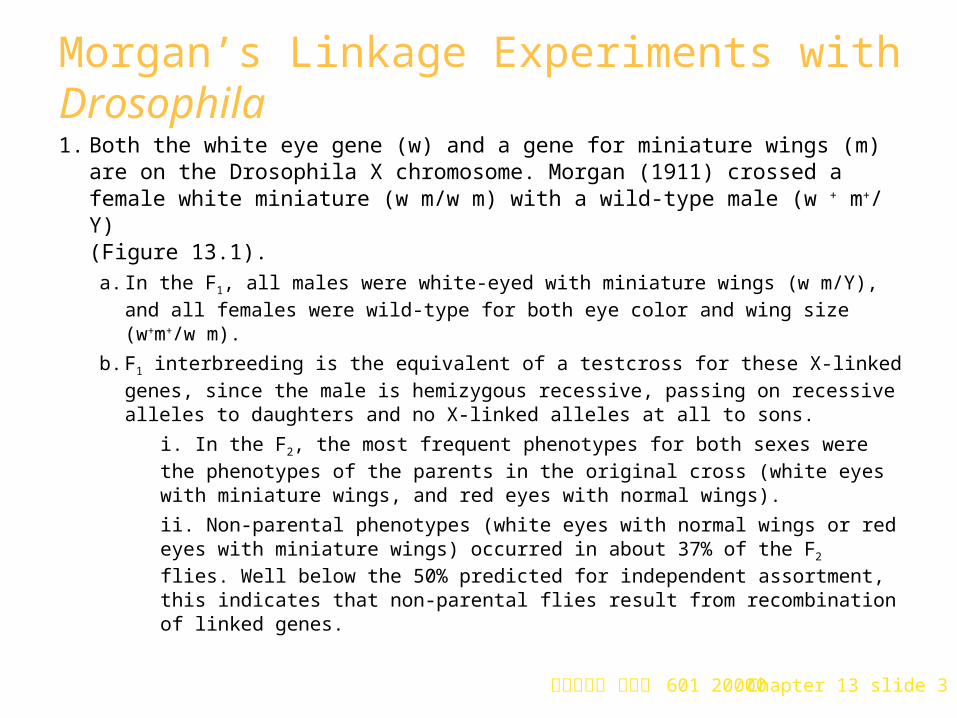
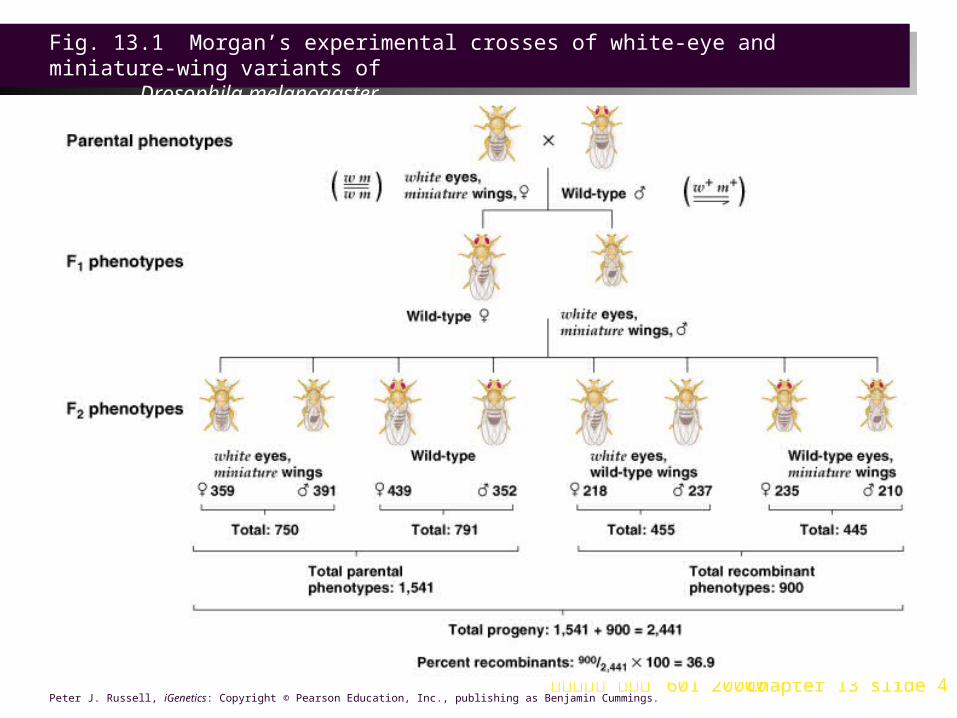
Morgan’s Linkage Experiments with Drosophila1. Both the white eye gene (w) and a gene for miniature wings (m) are
on the Drosophila X chromosome. Morgan (1911) crossed a female white miniature (w m/w m) with a wild-type male (w + m+/ Y) (Figure 13.1).a. In the F1, all males were white-eyed with miniature wings (w m/Y), and
all females were wild-type for both eye color and wing size (w+m+/w m).
b. F1 interbreeding is the equivalent of a testcross for these X-linked genes, since the male is hemizygous recessive, passing on recessive alleles to daughters and no X-linked alleles at all to sons.
i. In the F2, the most frequent phenotypes for both sexes were the phenotypes of the parents in the original cross (white eyes with miniature wings, and red eyes with normal wings).
ii. Non-parental phenotypes (white eyes with normal wings or red eyes with miniature wings) occurred in about 37% of the F2 flies. Well below the 50% predicted for independent assortment, this indicates that non-parental flies result from recombination of linked genes.
台大農藝系 遺傳學 601 20000 Chapter 13 slide 4Peter J. Russell, iGenetics: Copyright © Pearson Education, Inc., publishing as Benjamin Cummings.
Fig. 13.1 Morgan’s experimental crosses of white-eye and miniature-wing variants of
Drosophila melanogaster

台大農藝系 遺傳學 601 20000 Chapter 13 slide 5
c. Morgan proposed that:
i. During meiosis alleles of some genes assort together because they are near each other on the same chromosome.
ii. Recombination occurs when genes are exchanged between the X chromosomes of the F1 females.
d. A series of experiments supported Morgan’s hypothesis. In each case, parental phenotypes were the most frequent, while recombinant phenotypes occurred less frequently.
e. Some relevant terminology:
i. A chiasma (plural chiasmata) is the site on the homologous chromosomes where crossover occurs.
ii. Crossing-over is the reciprocal exchange of homologous chromatid segments, involving the breaking and rejoining of DNA.
iii. Crossing-over is also the event leading to genetic recombination between linked genes in both prokaryotes and eukaryotes.
f. Crossing-over occurs at the four-chromatid stage of prophase I in meiosis. Each crossover event involves two of the four chromatids. All chromatids may be involved in crossing-over, as chiasmata form along the aligned chromosomes (Figure 13.2).

台大農藝系 遺傳學 601 20000 Chapter 13 slide 6Peter J. Russell, iGenetics: Copyright © Pearson Education, Inc., publishing as Benjamin Cummings.
Fig. 13.2 Mechanism of crossing-over
台大農藝系 遺傳學 601 20000 Chapter 13 slide 7
Gene Recombination and the Role of chromosomal Exchange
1. Morgan’s results were only circumstantial evidence. Proof that physical exchange between chromosomes results in genetic recombination came in the 1930s.
Animation: Relationship Between Genetic Recombination and Chromosomal Exchange
台大農藝系 遺傳學 601 20000 Chapter 13 slide 8
Corn Experiments 1. Creighton and McClintock (1931) worked with corn (Zea mays) plants in which the two chromosomes
under study differed cytologically.
2. The study used a corn strain heterozygous for two genes on chromosome 9 (Figure 13.3):
a. One gene determines seed color (C for colored seeds, c for colorless).
b. The other gene is involved in starch synthesis. The wild-type allele (Wx) produces amylose, and the combination of amylose and amylopectin forms normal starch in a corn seed. The waxy mutant (wx) lacks amylose, and has waxy starch containing only amylopectin.
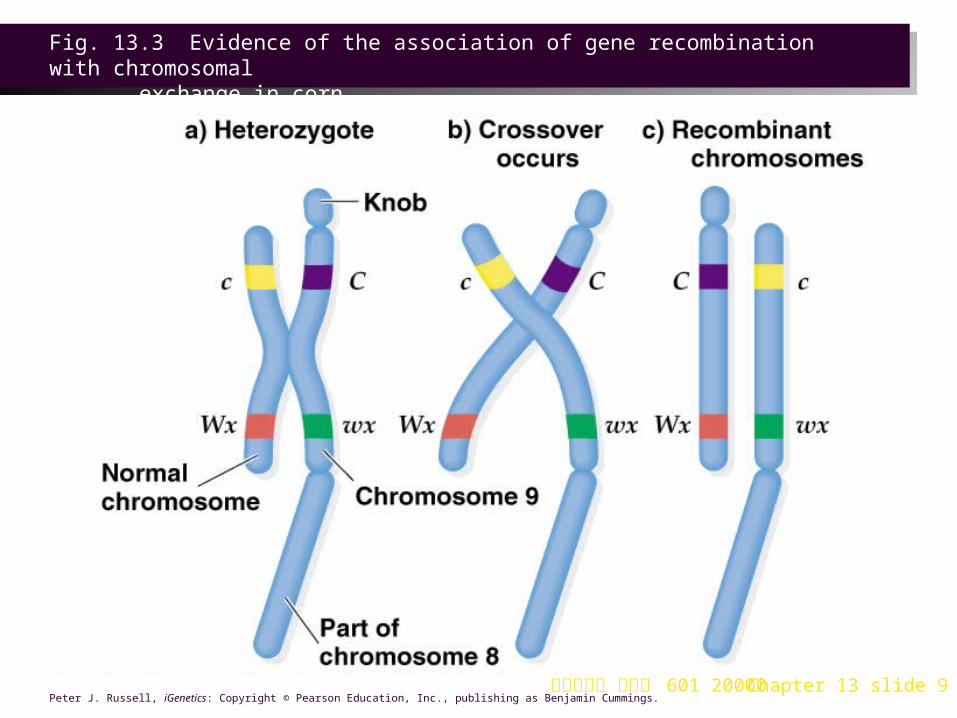
3. In this corn strain, the appearance of each chromosome 9 homolog correlated with its genotype:
a. One chromosome 9 had the genotype c Wx, and a normal appearance.
b. Its homolog had the genotype C wx, and cytological markers at each end of the chromosome. The end near the C locus had a darkly staining knob, and the other end, nearer the wx locus, had a translocated piece of chromosome 8.
4. When testcrossed, recombinant phenotypes were evident, and could be correlated with cytological features:
a. Whenever the genes had recombined, the cytological features had also recombined.
b. In the parental (non-recombinant.) type progeny, no exchange of cytological markers was evident.
5. This was direct evidence of physical exchange between homologs resulting in genetic recombination.
台大農藝系 遺傳學 601 20000 Chapter 13 slide 9Peter J. Russell, iGenetics: Copyright © Pearson Education, Inc., publishing as Benjamin Cummings.
Fig. 13.3 Evidence of the association of gene recombination with chromosomal
exchange in corn
台大農藝系 遺傳學 601 20000 Chapter 13 slide 10
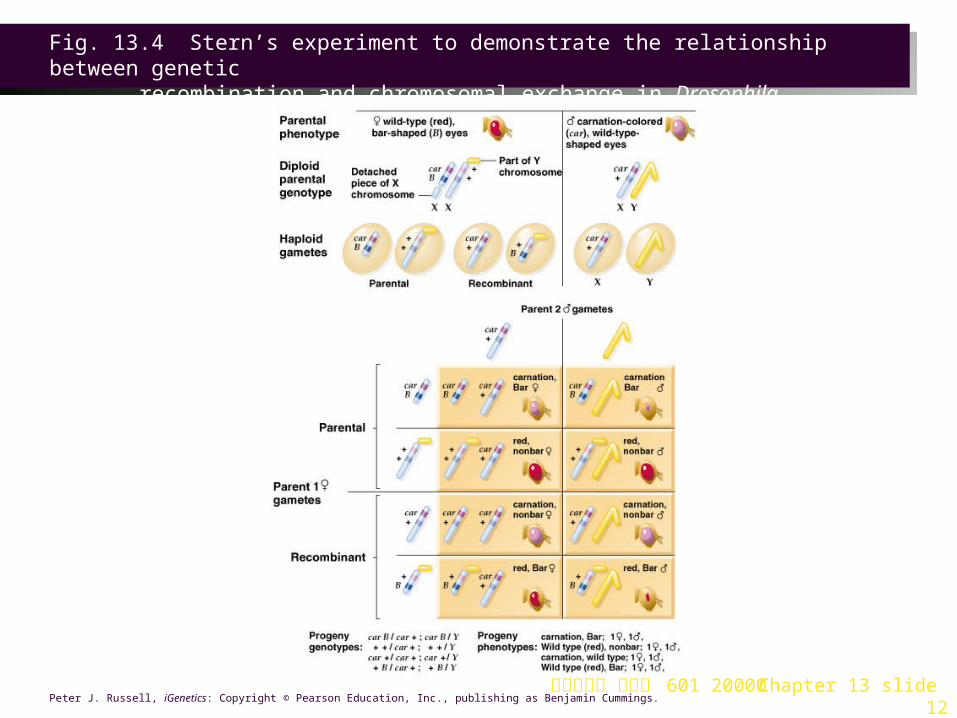
Drosophila Experiments 1. Identical observations were made by Stern a short time later in Drosophila
melanogaster, using a similar approach involving crosses between strains with defined genetic and cytological markers on their X chromosomes (Figure 13.4).
2. The two linked gene loci were:
a. The car (carnation) gene is recessive. Homozygotes have carnation colored eyes, rather than wild-type red. The car locus is near the “left” end of the X chromosome.
b. The B (bar-eye) gene is incompletely dominant. Homozygotes (B/B) have a bar-shaped eye rather than wild-type non-bar (round). Heterozygotes (B/+) have a wide-bar (kidney shaped) eye. The B locus is farther from the “left” end of the X chromosome (thus nearer the centromere) than the car locus.
3. In Stern’s crosses:
a. Male parents carried recessive alleles for both eye-color (car) and eye-shape (+) on a single X chromosome. Phenotype is carnation, non-bar eyes.
b. Female parent carried two abnormal and cytologically distinct X chromosomes, with a genotype of + + / B car, and a phenotype of wide-bar red eyes.
i. One X chromosome had a translocated fragment of Y chromosome. It carried the wild-type alleles (+ +, red and non-bar) for both traits.
ii. The second X chromosome had lost a region by translocation to chromosome 4. This chromosome was visibly shorter than a normal X chromosome (Figure 13.4). Its alleles were the two mutants, car and B.
c. Gamete formation would produce two types in males, X with both recessive alleles, and Y with neither of the alleles. Females produce four types, two non-recombinant and two recombinant. A Punnett square shows the segregation of alleles:
台大農藝系 遺傳學 601 20000 Chapter 13 slide 11
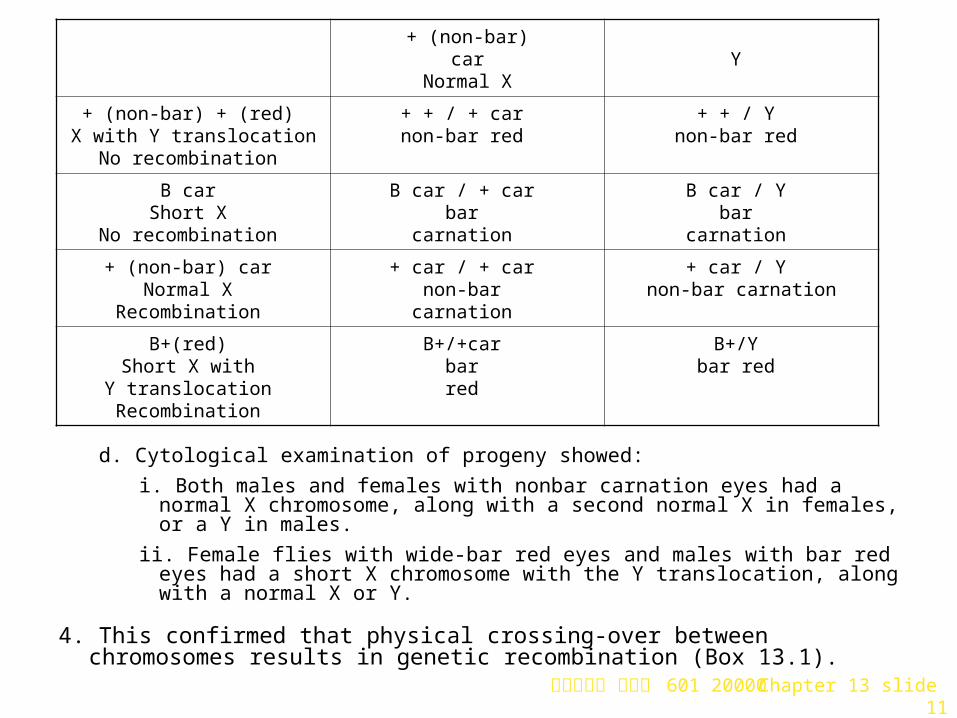
d. Cytological examination of progeny showed:
i. Both males and females with nonbar carnation eyes had a normal X chromosome, along with a second normal X in females, or a Y in males.
ii. Female flies with wide-bar red eyes and males with bar red eyes had a short X chromosome with the Y translocation, along with a normal X or Y.
4. This confirmed that physical crossing-over between chromosomes results in genetic recombination (Box 13.1).
+ (non-bar) car
Normal XY
+ (non-bar) + (red) X with Y translocation
No recombination
+ + / + car non-bar red
+ + / Y non-bar red
B car Short X
No recombination
B car / + car bar
carnation
B car / Y bar
carnation
+ (non-bar) car Normal X
Recombination
+ car / + car non-bar
carnation
+ car / Y non-bar carnation
B+(red) Short X with
Y translocation Recombination
B+/+car bar red
B+/Y bar red
台大農藝系 遺傳學 601 20000 Chapter 13 slide 12Peter J. Russell, iGenetics: Copyright © Pearson Education, Inc., publishing as Benjamin Cummings.
Fig. 13.4 Stern’s experiment to demonstrate the relationship between genetic
recombination and chromosomal exchange in Drosophila melanogaster

台大農藝系 遺傳學 601 20000 Chapter 13 slide 13Peter J. Russell, iGenetics: Copyright © Pearson Education, Inc., publishing as Benjamin Cummings.
Box Fig. 13.1 Holliday model for reciprocal genetic recombination
台大農藝系 遺傳學 601 20000 Chapter 13 slide 14
Crossing-Over at the Four-Chromatid Stage of Meiosis1. Neurospora crassa (orange bread mold) forms eight haploid spores.
Their arrangement in the ascus reflects the orientation of chromatids in the metaphase tetrad of meiosis I (ordered tetrads).
2. To determine when crossing-over occurs, crosses were made between haploid Neurospora strains of different mating types (A and a) (Figure 13.5).
a. Mating type A, with the genotype met his+ , can make the amino acid histidine, but not the amino acid methionine.
b. Mating type a, with the genotype met+ his, can make the amino acid methionine, but not the amino acid histidine.
c. The met locus and the his locus are on the same chromosome.
3. Mating produces a diploid nucleus, heterozygous for both genes. The diploid nucleus undergoes meiosis, forming four haploid spores. Each spore is then duplicated by mitosis, for a total of eight haploid spores.
台大農藝系 遺傳學 601 20000 Chapter 13 slide 15Peter J. Russell, iGenetics: Copyright © Pearson Education, Inc., publishing as Benjamin Cummings.
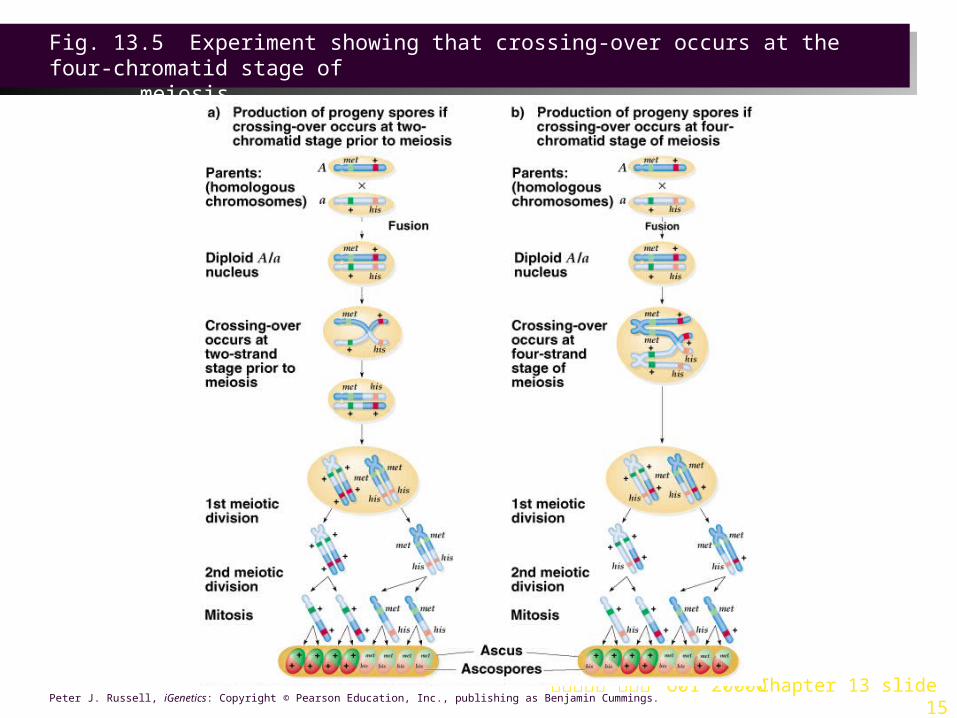
Fig. 13.5 Experiment showing that crossing-over occurs at the four-chromatid stage of
meiosis
台大農藝系 遺傳學 601 20000 Chapter 13 slide 16
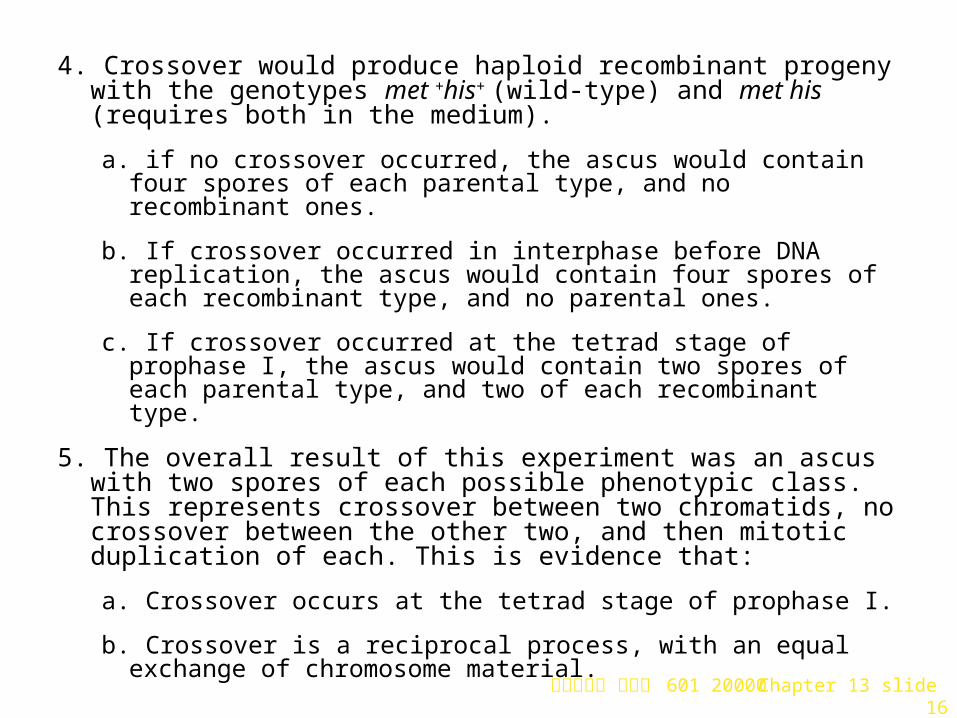
4. Crossover would produce haploid recombinant progeny with the genotypes met +his+ (wild-type) and met his (requires both in the medium).
a. if no crossover occurred, the ascus would contain four spores of each parental type, and no recombinant ones.
b. If crossover occurred in interphase before DNA replication, the ascus would contain four spores of each recombinant type, and no parental ones.
c. If crossover occurred at the tetrad stage of prophase I, the ascus would contain two spores of each parental type, and two of each recombinant type.
5. The overall result of this experiment was an ascus with two spores of each possible phenotypic class. This represents crossover between two chromatids, no crossover between the other two, and then mitotic duplication of each. This is evidence that:
a. Crossover occurs at the tetrad stage of prophase I.
b. Crossover is a reciprocal process, with an equal exchange of chromosome material.
台大農藝系 遺傳學 601 20000 Chapter 13 slide 17
Constructing Genetic Maps
1. Genetic recombination experiments can be used in genetic mapping.

台大農藝系 遺傳學 601 20000 Chapter 13 slide 18
Detecting Linkage through Testcrosses1. Linked genes are used for mapping. They are found by looking for deviation from the
frequencies expected from independent assortment.
2. A testcross (one parent is homozygous recessive) works well for analyzing linkage:
a. If the alleles are not linked, and the second parent is heterozygous, all four possible combinations of traits will be present in equal numbers in the progeny.
b. A significant deviation in this ratio (more parental and fewer recombinant types) indicates linkage.
3. Chi-square analysis is used to analyze testcross data and determine whether a deviation is “significant.” A null hypothesis (“the genes are not linked”) is used because it is not possible to predict phenotype frequencies produced by linked genes.
a. If two genes are not linked, a testcross should yield a 1:1 ratio of parentals : recombinants.
b. The formula is: χ2 = Σ d2 / e
i. Σ is “sum of.”
ii. d = deviation value = (o - e).
iii. o = the observed number.
iv. e = the expected number.
c. The χ2 value and the degrees of freedom (df) for the data set are used with a table of chi-square probabilities to determine the probability (P) that the deviation of observed from expected values is due to chance.
i. If P > 0.05 (probability of more than 5 in 100 that deviation was by chance alone) the deviation is not considered statistically significant.
ii. If P < 0.05, the deviation is considered statistically significant, and not due to chance. The null hypothesis is likely to be invalid.
iii. If P ≦ 0.01, deviation is highly statistically significant, and the data are not consistent with the hypothesis, which must be rejected. If the hypothesis “the genes are not linked” is rejected, the only remaining option is that the genes are linked.
台大農藝系 遺傳學 601 20000 Chapter 13 slide 19
The Concept of a Genetic Map1. In an individual heterozygous at two loci, there are two arrangements of alleles:
a. The cis (coupling) arrangement has both wild-type alleles on one homologous chromosome, and both mutants on the other (e.g., w+m+ and w m).
b. The trans (repulsion) arrangement has one mutant and one wild-type on each homolog (e.g., w+m and w m+).
c. A crossover between homologs in the cis arrangement results in a homologous pair with the trans arrangement. A crossover between homologs in the trans arrangement results in cis homologs.
2. Drosophila crosses showed that crossover frequency for linked genes (measured by recombinants) is characteristic for each gene pair. The frequency stays the same, whether the genes are in coupling or in repulsion.
a. Morgan and Sturtevant (1913) used recombination frequencies to make a genetic map.
i. A 1% crossover rate is a genetic distance of 1 map unit (mu). A map unit is also called a centimorgan (cM).
ii. Geneticists use recombination frequency as a way to estimate crossover frequency. It is not an exact measure, however.
iii. The farther apart the two genes are on the chromosome, the more likely it is that crossover will occur between them, and therefore the greater their crossover frequency (Figure 13.6).
b. The first genetic map was based on crosses in Drosophila involving the three sex-linked genes:
i. w gives white eyes.
ii. m gives miniature wings.
iii. y gives yellow body.
c. The crosses gave the following recombination frequencies:
i. w x m was 32.6.
ii. w x y was 1.3.
iii. m x y was 33.9.
d. Map is therefore: m————————————————w—y.

台大農藝系 遺傳學 601 20000 Chapter 13 slide 20Peter J. Russell, iGenetics: Copyright © Pearson Education, Inc., publishing as Benjamin Cummings.
Fig. 13.6 The relationship between crossing-over and map distance
台大農藝系 遺傳學 601 20000 Chapter 13 slide 21
Gene Mapping Using Two-Point Testcrosses1. With autosomal recessive alleles, when a double heterozygote is testcrossed,
four phenotypic classes are expected. If the genes are linked, the two parental phenotypes will be about equally frequent and more abundant than the two recombinant phenotypes.
2. Mapping of genes with other mechanisms of inheritance is also done with two-point testcrosses:
a. For autosomal dominants, a double heterozygote (A B/A+ B+) is testcrossed with a homozygous recessive individual (A+ B+/A+ B+). The only difference from the experiment above is that when the mutant alleles are dominant, the recessive alleles are wild-type.
b. For X-linked recessives, a female double heterozygote (a+ b+/a b) is crossed with a male hemizygous for the recessive alleles (a b/Y).
c. For X-linked dominants, a female double heterozygote (A B/A+ B+) is crossed with a male hemizygous for the wild-type alleles (A+ B+/Y).
d. For either X-linked case, it is possible to cross the females with males of any type. As long as only male progeny are analyzed, the father’s X will be irrelevant.
e. Phenotypes obtained in any of these crosses will depend on whether the alleles are arranged in coupling (cis) or repulsion (trans).
f. Recombination frequency is used directly as an estimate of map units.
i. The measure is more accurate when the alleles are close together.
ii. Scoring large numbers of progeny increases the accuracy.
g. Mapping in all types of organisms shows genes arranged with a 1-to-1 correspondence between linkage groups and chromosomes.

台大農藝系 遺傳學 601 20000 Chapter 13 slide 22Peter J. Russell, iGenetics: Copyright © Pearson Education, Inc., publishing as Benjamin Cummings.
Fig. 13.7 Testcross to show that two genes are linked
台大農藝系 遺傳學 601 20000 Chapter 13 slide 23
Generating a Genetic Map1. Genetic map is generated from estimating the crossover rate in a
particular segment of the chromosome. It may not exactly match the physical map because crossover is not equally probable at all sites on the chromosome.
2. Recombination frequency is also used to predict progeny in genetic crosses. For example, a 20% crossover rate between two pairs of alleles in a heterozygote (a+ b+ /a b) will give 10% gametes of each recombinant type (a+ b and a b+ ).
3. A recombination frequency of 50% means that genes are unlinked. There are two ways in which genes may be unlinked:a. They may be on separate chromosomes.
b. They may be far apart on the same chromosome.
4. If the genes are on the same chromosome, multiple crossovers can occur. The further apart two loci are, the more likely they are to have crossover events take place between them. The chromatid pairing is not always the same in crossover, so that 2, 3, or 4 chromatids may participate in multiple crossover (Figure 13.8).
5. To determine whether the genes are on the same chromosome, or different ones, other genes in the linkage group may be mapped in relation to a and b, and used to deduce their locations.
台大農藝系 遺傳學 601 20000 Chapter 13 slide 24Peter J. Russell, iGenetics: Copyright © Pearson Education, Inc., publishing as Benjamin Cummings.
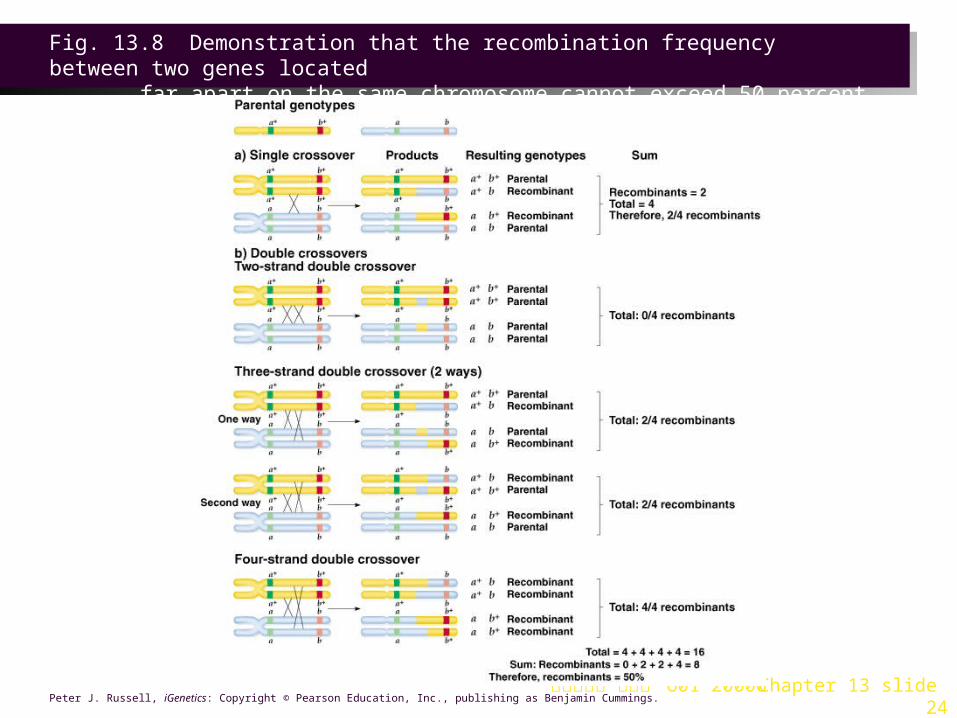
Fig. 13.8 Demonstration that the recombination frequency between two genes located
far apart on the same chromosome cannot exceed 50 percent

台大農藝系 遺傳學 601 20000 Chapter 13 slide 25
Gene Mapping Using Three-Point Testcrosses
1. Typically, geneticists design experiments to gather data on several traits in 1 testcross. An example of a three-point testcross would be p+ r+ j+/p r j X p r j/p r j (Figure 13.9).
2. In the progeny, each gene has two possible phenotypes. For three genes there are (2)3 = 8 expected phenotypic classes in the progeny.
Animation: Three-Point Mapping

台大農藝系 遺傳學 601 20000 Chapter 13 slide 26Peter J. Russell, iGenetics: Copyright © Pearson Education, Inc., publishing as Benjamin Cummings.
Fig. 13.9 Three-point mapping, showing the testcross used and the resultant progeny

台大農藝系 遺傳學 601 20000 Chapter 13 slide 27
Establishing the Order of Genes
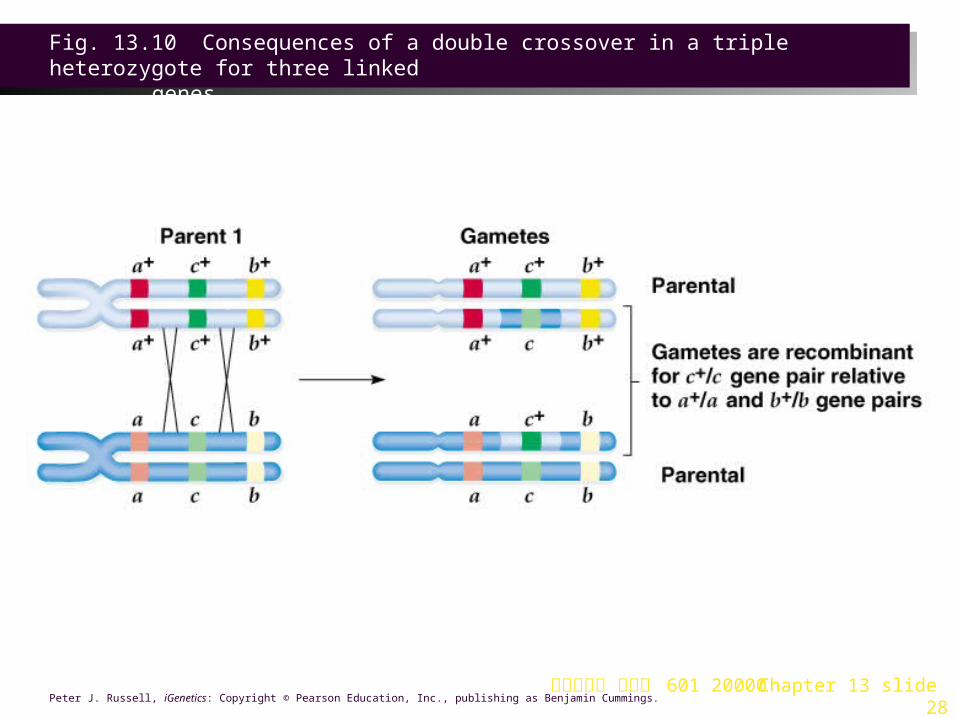
1.The order of genes on the chromosome can be deduced from results of the cross. Of the eight expected progeny phenotypes:a.Two classes are parental (p+ r+ j+/p r j and p r j/p r j)
and will be the most abundant.
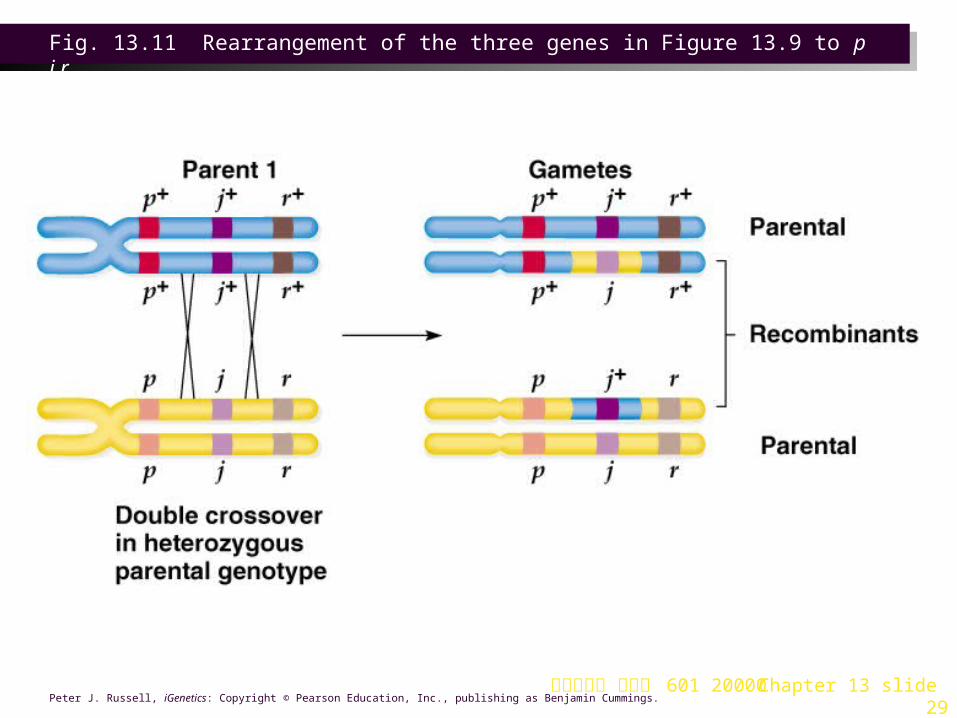
b.Of the six remaining phenotypic classes, two will be present at the lowest frequency, resulting from apparent double crossover (p+ r+ j/p r j and p r j+/p r j). This establishes the gene order as p j r (Figures 13.9, 13.10 and 13.11).
台大農藝系 遺傳學 601 20000 Chapter 13 slide 28Peter J. Russell, iGenetics: Copyright © Pearson Education, Inc., publishing as Benjamin Cummings.
Fig. 13.10 Consequences of a double crossover in a triple heterozygote for three linked
genes
台大農藝系 遺傳學 601 20000 Chapter 13 slide 29Peter J. Russell, iGenetics: Copyright © Pearson Education, Inc., publishing as Benjamin Cummings.
Fig. 13.11 Rearrangement of the three genes in Figure 13.9 to p j r
台大農藝系 遺傳學 601 20000 Chapter 13 slide 30
Calculating the Recombination Frequencies for Genes
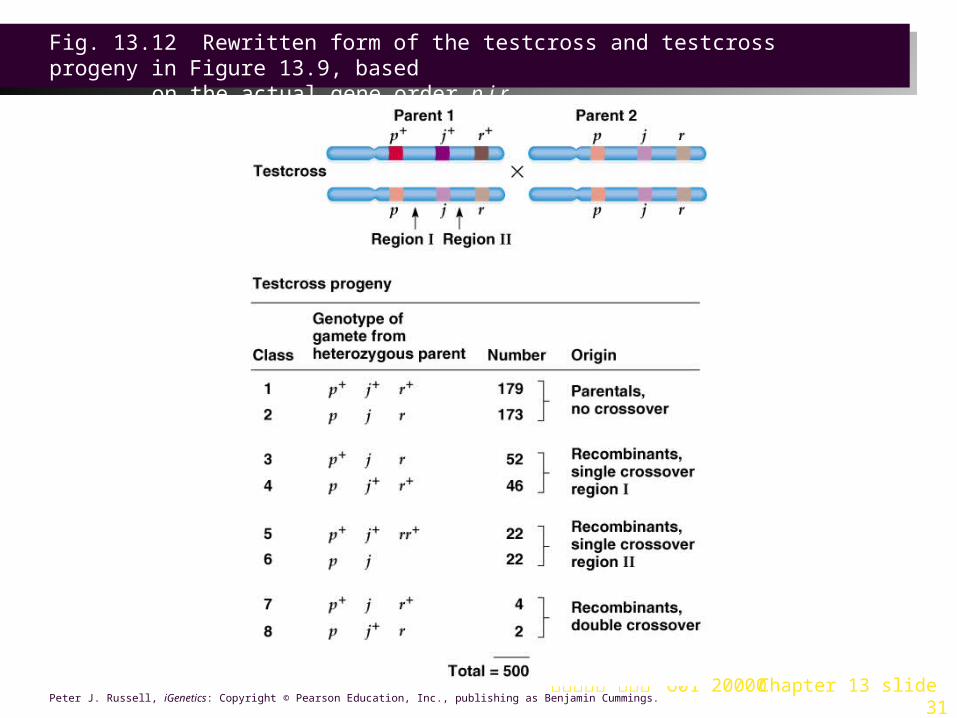
1. Cross data is organized to reflect the gene order, and in this example the region between genes p and j is called region I, and that between j and r is region II (Figure 13.12).
2. Recombination frequencies are now calculated for two genes at a time. It includes single crossovers in the region under study, and double crossovers, since they occur in both regions.
3. Recombination frequencies are used to position genes on the genetic map (each 1% recombination frequency = 1 map unit) for the chromosomal region (Figure 13.13).
4. Recombination frequencies are not identical to crossover frequencies, and typically underestimate the true map distance.
台大農藝系 遺傳學 601 20000 Chapter 13 slide 31Peter J. Russell, iGenetics: Copyright © Pearson Education, Inc., publishing as Benjamin Cummings.
Fig. 13.12 Rewritten form of the testcross and testcross progeny in Figure 13.9, based
on the actual gene order p j r

台大農藝系 遺傳學 601 20000 Chapter 13 slide 32Peter J. Russell, iGenetics: Copyright © Pearson Education, Inc., publishing as Benjamin Cummings.
Fig. 13.13 Genetic map of the p-j-r region of the chromosome computed from the
recombination data in Figure 13.12
iActivity: Crossovers and Tomato Chromosomes

台大農藝系 遺傳學 601 20000 Chapter 13 slide 33
Interference and Coincidence
1. Characteristically, double crossovers do not occur as often as expected from the observed rate of single crossovers. Crossover appears to reduce formation of other chiasmata nearby, producing interference. Interference = 1 is total interference, with no other crossovers occurring in the region.
2. The coefficient of coincidence expresses the extent of interference.a. Interference = 1 - coefficient of coincidence. The values
are inversely related.
b. A value of 1 means the number of double crossovers that occurs is what would be predicted on the basis of two independent events, and there is no interference.
c. A value of 0 means that none of the expected crossovers occurred, and interference is total.
台大農藝系 遺傳學 601 20000 Chapter 13 slide 34Peter J. Russell, iGenetics: Copyright © Pearson Education, Inc., publishing as Benjamin Cummings.
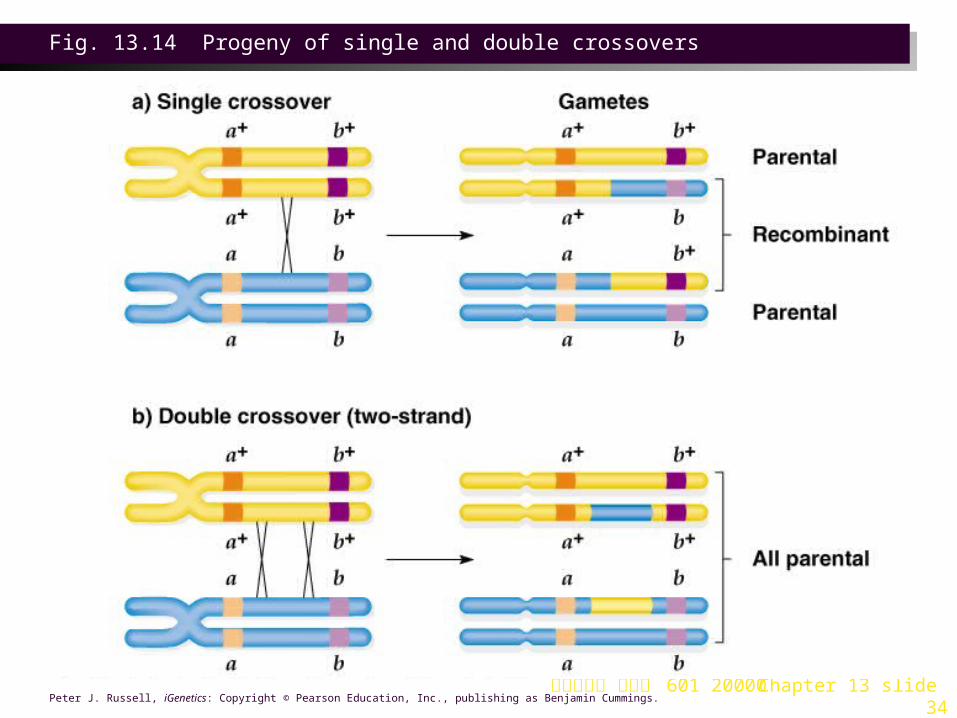
Fig. 13.14 Progeny of single and double crossovers
台大農藝系 遺傳學 601 20000 Chapter 13 slide 35
Calculating Accurate Map Distances1. Recombination frequency generally underestimates the
true map distance:a. Double crossovers between two loci will restore the
parental genotype, as will any even number of crossovers. These will not be counted as recombinants, even though crossovers have taken place.
b. A single crossover will produce recombinant chromosomes, as will any odd number of crossovers. Progeny analysis assumes that every recombinant was produced by a single crossover.
c. Map distances for genes that are less than 7 mu apart are very accurate. As distance increases, accuracy declines because more crosses go uncounted.
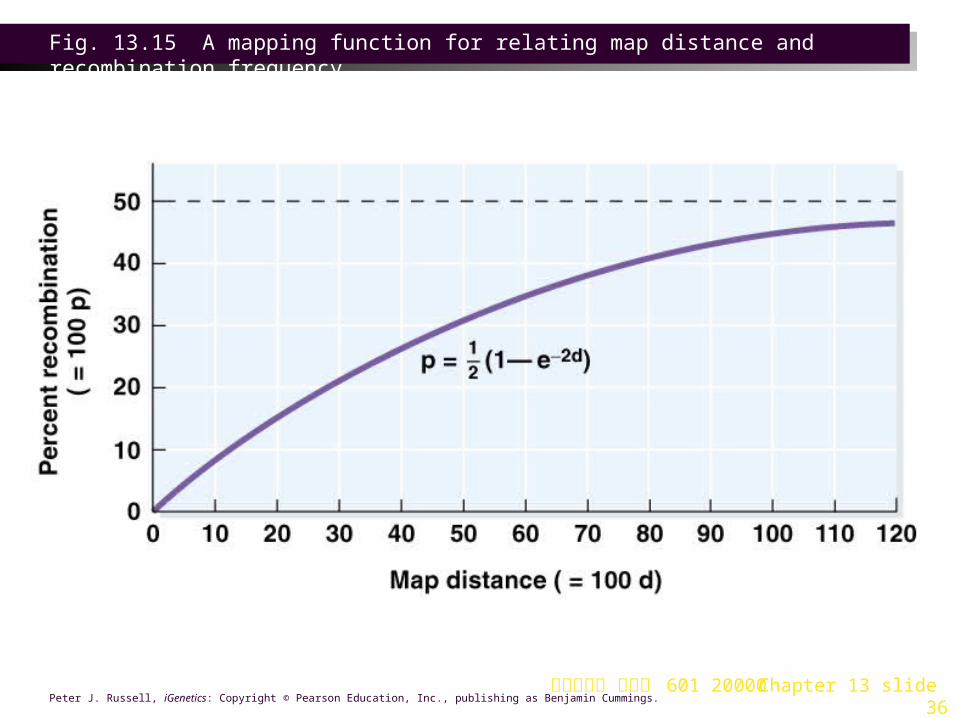
2. Mapping functions are mathematical formulas used to define the relationship between map distance and recombination frequency. They are based on assumptions about the frequency of crossovers compared with distance between genes (Figure 13.15).
台大農藝系 遺傳學 601 20000 Chapter 13 slide 36Peter J. Russell, iGenetics: Copyright © Pearson Education, Inc., publishing as Benjamin Cummings.
Fig. 13.15 A mapping function for relating map distance and recombination frequency

台大農藝系 遺傳學 601 20000 Chapter 13 slide 37
Tetrad Analysis in Certain Haploid Eukaryotes1. In some haploid eukaryotic organisms (fungi or single-celled
algae) products of a single meiosis, the meiotic tetrad, are contained within one structure. Tetrad analysis provides insight into meiotic events.
2. In haploid organisms, the phenotype correlates directly with the genotype of each member of the tetrad (no dominance or recessiveness occurs).
3. Life cycles of organisms typically used in tetrad analysis:a. Saccharomyces cerevisiae (baker’s yeast), has two mating types, a
and α.
i. Asexual reproduction occurs mitotically (vegetative life cycle) in the haploid yeast.
ii. Sexual reproduction, fusion of a haploid a cell with a haploid a one, produces a diploid cell (a/α) that also reproduces mitotically, giving rise to identical diploid cells.
iii. Diploid cells sporulate by meiosis, producing four haploid ascospores contained in an ascus. Of the ascospores, two will be type a and two type a. In yeast they are unordered tetrads, arranged randomly in the ascus (Figure 13.16).

台大農藝系 遺傳學 601 20000 Chapter 13 slide 38Peter J. Russell, iGenetics: Copyright © Pearson Education, Inc., publishing as Benjamin Cummings.
Fig. 13.16 Life cycle of the yeast Saccharomyces cerevisiae
台大農藝系 遺傳學 601 20000 Chapter 13 slide 39
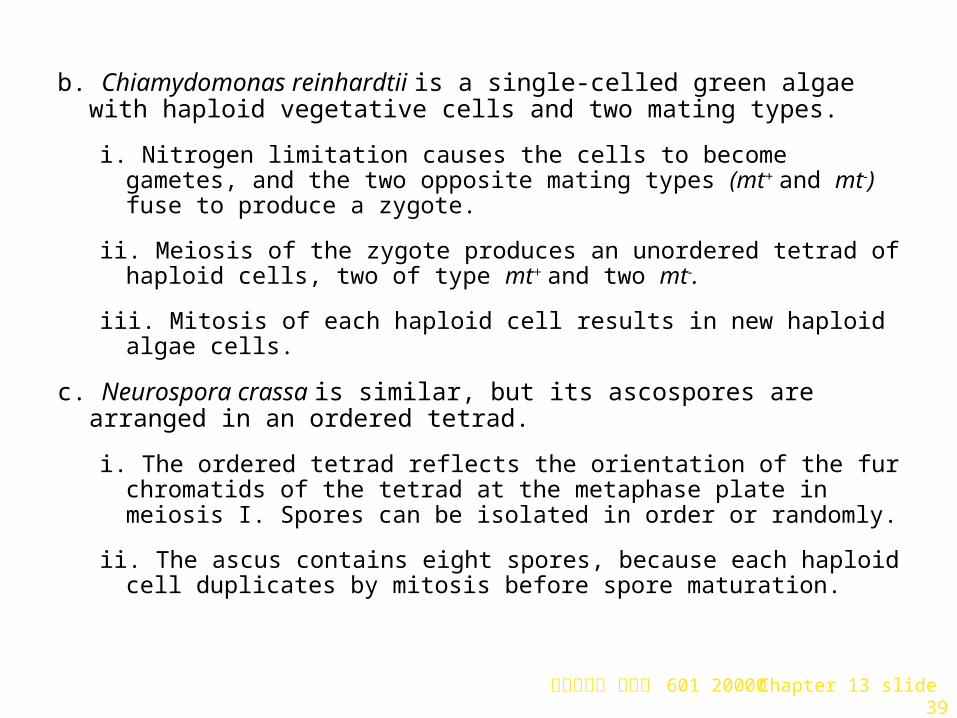
b. Chiamydomonas reinhardtii is a single-celled green algae with haploid vegetative cells and two mating types.
i. Nitrogen limitation causes the cells to become gametes, and the two opposite mating types (mt+ and mt-) fuse to produce a zygote.
ii. Meiosis of the zygote produces an unordered tetrad of haploid cells, two of type mt+ and two mt-.
iii. Mitosis of each haploid cell results in new haploid algae cells.
c. Neurospora crassa is similar, but its ascospores are arranged in an ordered tetrad.
i. The ordered tetrad reflects the orientation of the fur chromatids of the tetrad at the metaphase plate in meiosis I. Spores can be isolated in order or randomly.
ii. The ascus contains eight spores, because each haploid cell duplicates by mitosis before spore maturation.

台大農藝系 遺傳學 601 20000 Chapter 13 slide 40
Using Random-Spore Analysis to Map Genes in Haploid Eukaryotes
1. In these organisms, three-point crosses have been used effectively for mapping. Haploidy simplifies interpretation of the results.
2. Analysis of random-spore data is the same as for diploid eukaryotes. It is used for determining linkage and constructing genetic maps (Figure 13.17).

台大農藝系 遺傳學 601 20000 Chapter 13 slide 41Peter J. Russell, iGenetics: Copyright © Pearson Education, Inc., publishing as Benjamin Cummings.
Fig. 13.17 Typical genetic cross for mapping three genes in a haploid organism such as
yeast or Neurospora

台大農藝系 遺傳學 601 20000 Chapter 13 slide 42
Using Tetrad Analysis to Map Two Linked Genes1. In a two-point cross, mating produces a diploid heterozygous
for both genes, and then meiosis makes haploid spores. In the fungi (Saccharomyces and Neurospora), the spores of the tetrad are micromanipulated for separate germination and analysis.
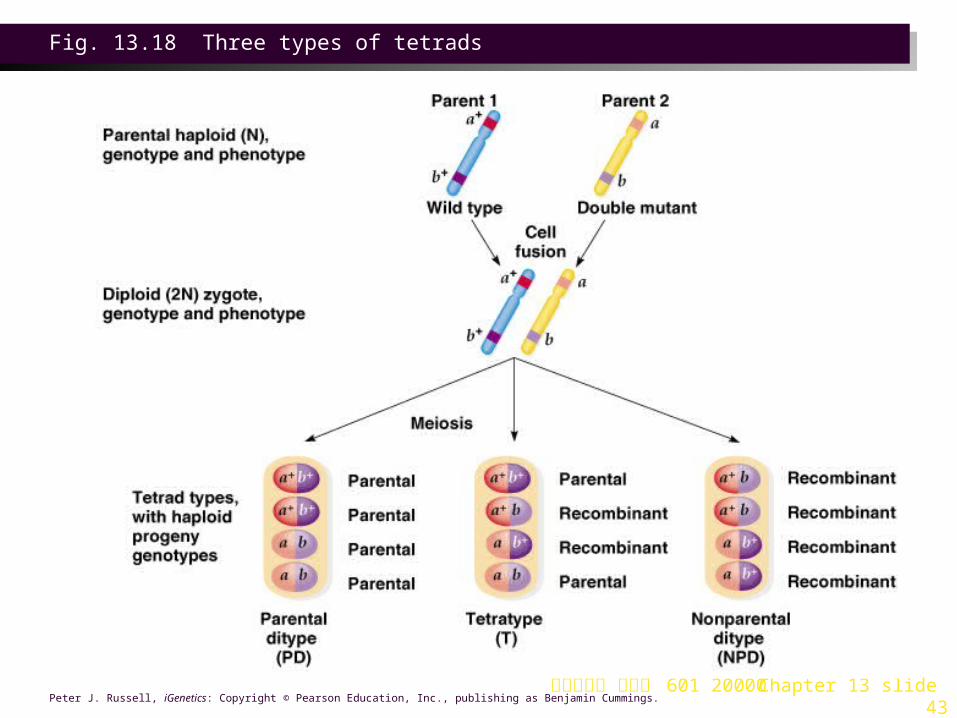
2. In the cross a+ b+/a b, in which a and b are linked, three different tetrad types can result (Figure 13.18):a. Parental-ditype (PD) tetrad has only the two parental types (a+ b+
and a b). A PD tetrad results either if no crossing-over occurs between the two genes, or if a double crossover involving the same two chromatids occurs.
b. Tetratype (T) has two parentals (a+ b+ and a b) and two recombinants (a+ b and a b+). A T tetrad results either from a single crossover between the two genes, or if a double crossover involving three chromatids occurs.
c. Non-parental-ditype (NPD) has only recombinants (a+ b and a b+). A NPD tetrad results from a double crossover that involves all four chromatids.
台大農藝系 遺傳學 601 20000 Chapter 13 slide 43Peter J. Russell, iGenetics: Copyright © Pearson Education, Inc., publishing as Benjamin Cummings.
Fig. 13.18 Three types of tetrads
台大農藝系 遺傳學 601 20000 Chapter 13 slide 44
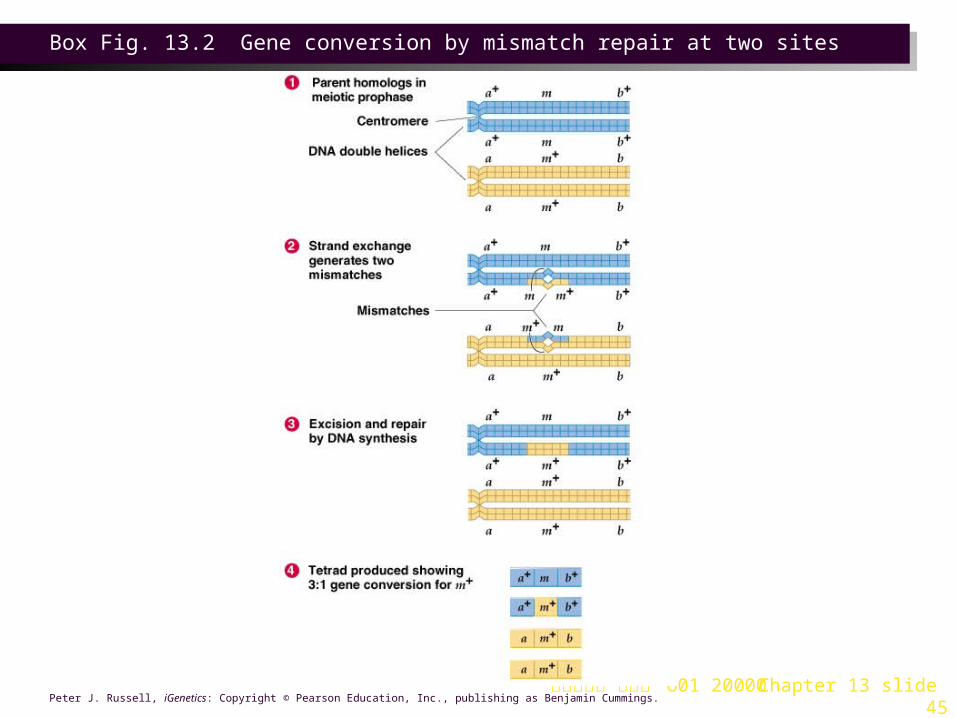
3. Segregation of alleles is 2:2. Rarely, 3:1 or 1:3 ratios are seen, due to gene conversion (Box 13.2).
4. For genes on different chromosomes, crossover is not involved. PD and NPD tetrads are produced with equal frequency; and no T tetrads are expected (Figure 13.19).
台大農藝系 遺傳學 601 20000 Chapter 13 slide 45Peter J. Russell, iGenetics: Copyright © Pearson Education, Inc., publishing as Benjamin Cummings.
Box Fig. 13.2 Gene conversion by mismatch repair at two sites

台大農藝系 遺傳學 601 20000 Chapter 13 slide 46Peter J. Russell, iGenetics: Copyright © Pearson Education, Inc., publishing as Benjamin Cummings.
Fig. 13.19 Origin of tetrad types for a cross in which the two genes are located on
different chromosomes

台大農藝系 遺傳學 601 20000 Chapter 13 slide 47
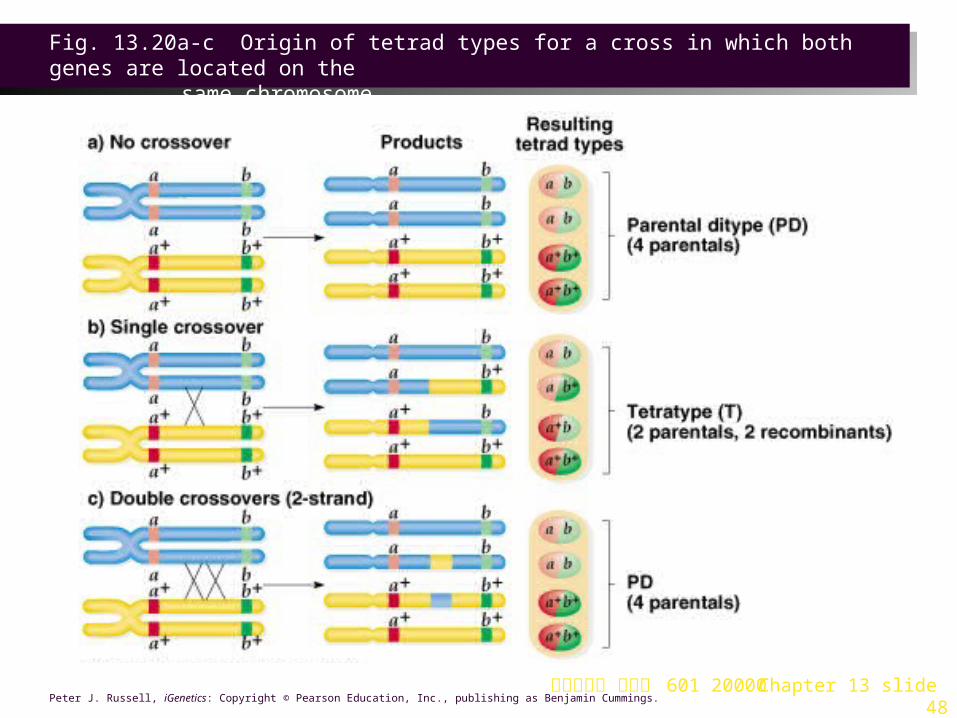
5. When genes are linked (Figure 13.20):
a. A single crossover produces a T tetrad.
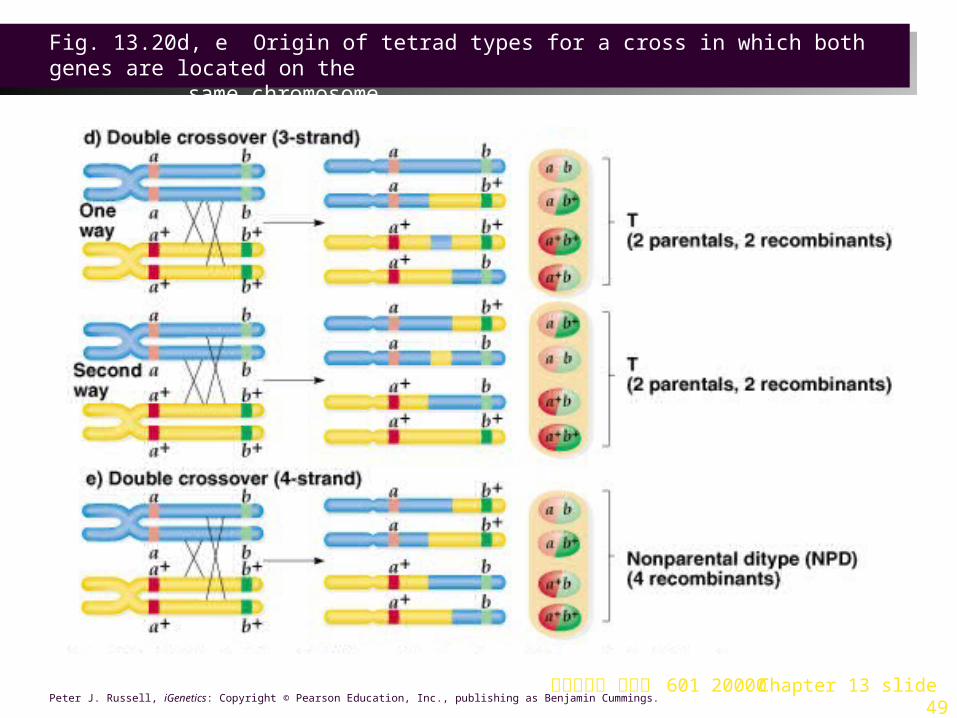
b. Double crossovers vary depending on the strands involved:
i. If the same two chromatids are involved in both crossovers, a PD tetrad results.
ii. If three chromatids are involved, a T tetrad results.
iii. If all four chromatids are involved, an NPD tetrad is produced.
c. Genes are considered linked if the PD frequency is far greater than the NPD frequency.
d. Genetic distance between the genes correlates with the recombination frequency; and they are mapped accordingly,
e. For crosses involving more than two genes, they are considered in pairs, and mapped two at a time relative to each other.
台大農藝系 遺傳學 601 20000 Chapter 13 slide 48Peter J. Russell, iGenetics: Copyright © Pearson Education, Inc., publishing as Benjamin Cummings.
Fig. 13.20a-c Origin of tetrad types for a cross in which both genes are located on the
same chromosome
台大農藝系 遺傳學 601 20000 Chapter 13 slide 49Peter J. Russell, iGenetics: Copyright © Pearson Education, Inc., publishing as Benjamin Cummings.
Fig. 13.20d, e Origin of tetrad types for a cross in which both genes are located on the
same chromosome
台大農藝系 遺傳學 601 20000 Chapter 13 slide 50
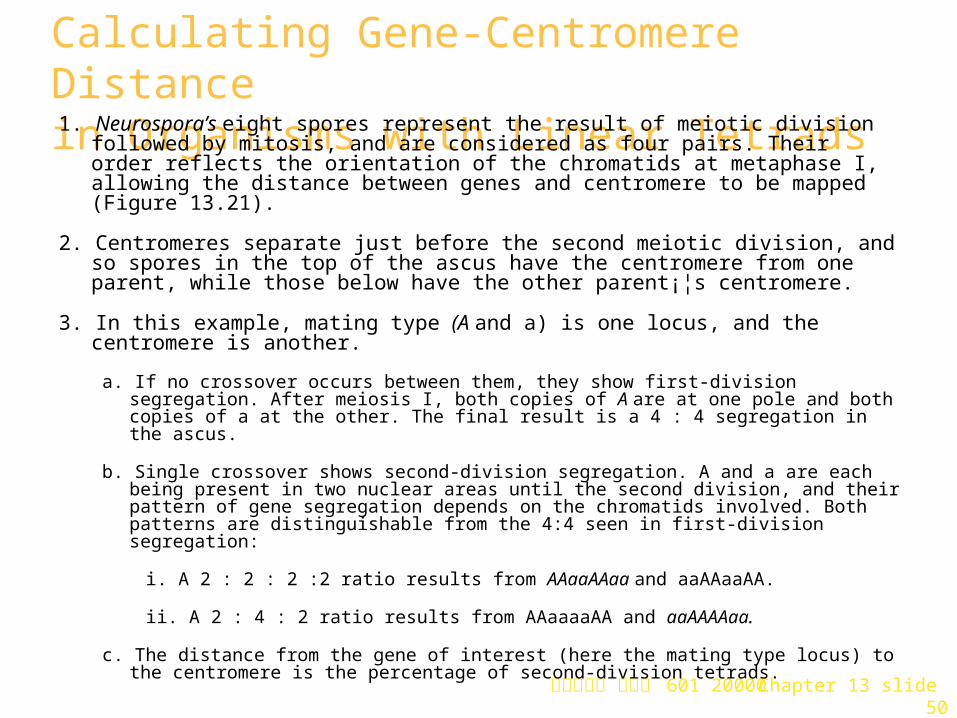
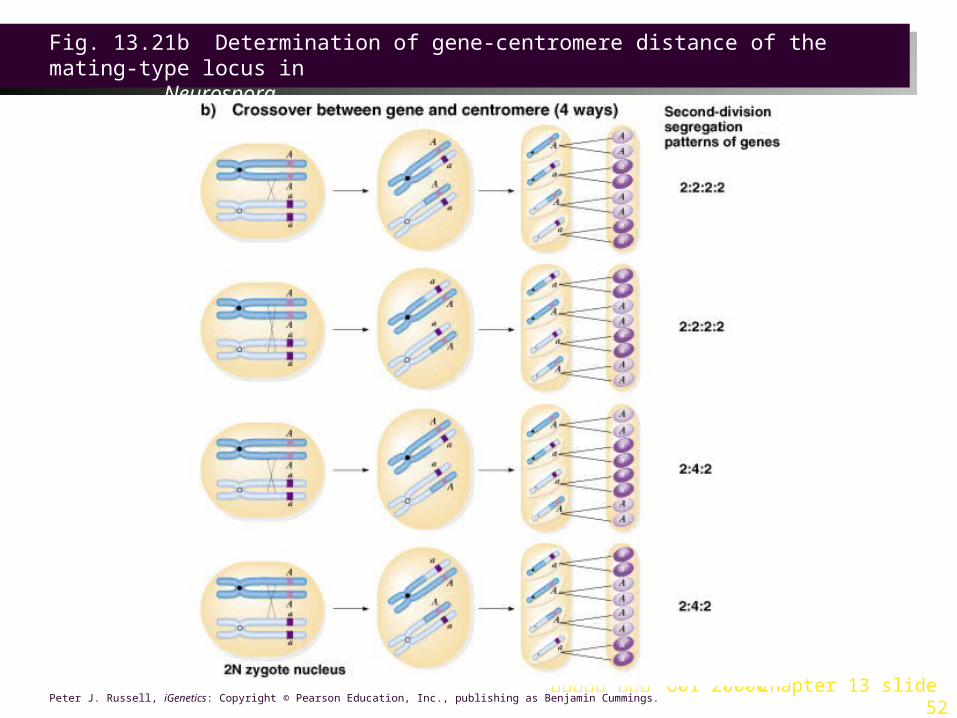
Calculating Gene-Centromere Distance in Organisms with Linear Tetrads 1. Neurospora’s eight spores represent the result of meiotic division followed by mitosis,
and are considered as four pairs. Their order reflects the orientation of the chromatids at metaphase I, allowing the distance between genes and centromere to be mapped (Figure 13.21).
2. Centromeres separate just before the second meiotic division, and so spores in the top of the ascus have the centromere from one parent, while those below have the other parent¡¦s centromere.
3. In this example, mating type (A and a) is one locus, and the centromere is another.
a. If no crossover occurs between them, they show first-division segregation. After meiosis I, both copies of A are at one pole and both copies of a at the other. The final result is a 4 : 4 segregation in the ascus.
b. Single crossover shows second-division segregation. A and a are each being present in two nuclear areas until the second division, and their pattern of gene segregation depends on the chromatids involved. Both patterns are distinguishable from the 4:4 seen in first-division segregation:
i. A 2 : 2 : 2 :2 ratio results from AAaaAAaa and aaAAaaAA.
ii. A 2 : 4 : 2 ratio results from AAaaaaAA and aaAAAAaa.
c. The distance from the gene of interest (here the mating type locus) to the centromere is the percentage of second-division tetrads.

台大農藝系 遺傳學 601 20000 Chapter 13 slide 51Peter J. Russell, iGenetics: Copyright © Pearson Education, Inc., publishing as Benjamin Cummings.
Fig. 13.21a Determination of gene-centromere distance of the mating-type locus in
Neurospora
台大農藝系 遺傳學 601 20000 Chapter 13 slide 52Peter J. Russell, iGenetics: Copyright © Pearson Education, Inc., publishing as Benjamin Cummings.
Fig. 13.21b Determination of gene-centromere distance of the mating-type locus in
Neurospora
台大農藝系 遺傳學 601 20000 Chapter 13 slide 53
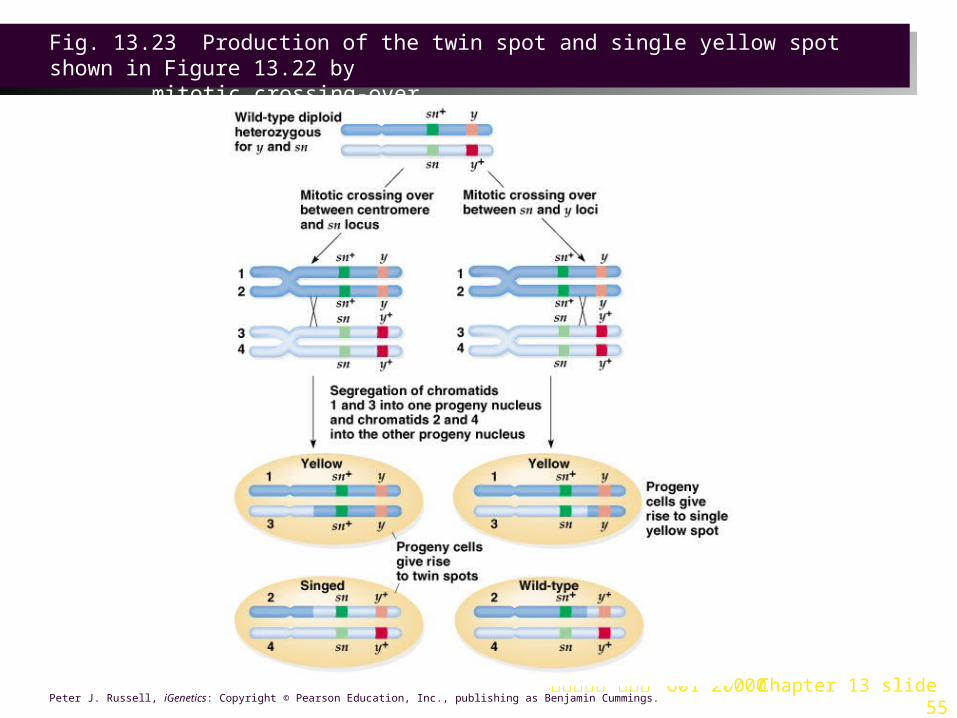
Mitotic Recombination Discovery of Mitotic Recombination1. Crossing-over during mitosis was first observed by Stern (1936) in Drosophila
(Figure 13.22).
a. The alleles involved are sex-linked and recessive to wild-type:
i. y produces yellow body color instead of wild-type grey.
ii. sn produces short, twisty bristles (“singed”) rather than the wild-type long, curved ones. Bristles follow body color (y+/ - are black, and y / y are yellow).
b. Female progeny from the cross y+ sn / y+ sn X y sn+ I Y generally have the wild-type phenotype of grey bodies and normal bristles, corresponding to their genotype (y+ sn / y sn+). But exceptions were seen:
i. Some flies had patches of yellow and/or singed bristles. This could be explained by nondisjunction or chromosomal loss.
ii. Other flies had twin spots, adjacent regions of bristles, one yellow and the other singed, a mosaic phenotype. The spots are reciprocal products of the same genetic event, a mitotic crossing over.
c. Mitotic crossover occurred either between the centromere and the sn locus, or between the sn and the y locus (Figure 13.23).

台大農藝系 遺傳學 601 20000 Chapter 13 slide 54Peter J. Russell, iGenetics: Copyright © Pearson Education, Inc., publishing as Benjamin Cummings.
Fig. 13.22 Body surface phenotype segregation in a Drosophila strain
台大農藝系 遺傳學 601 20000 Chapter 13 slide 55Peter J. Russell, iGenetics: Copyright © Pearson Education, Inc., publishing as Benjamin Cummings.
Fig. 13.23 Production of the twin spot and single yellow spot shown in Figure 13.22 by
mitotic crossing-over
台大農藝系 遺傳學 601 20000 Chapter 13 slide 56
Mechanism of Mitotic Crossing-Over
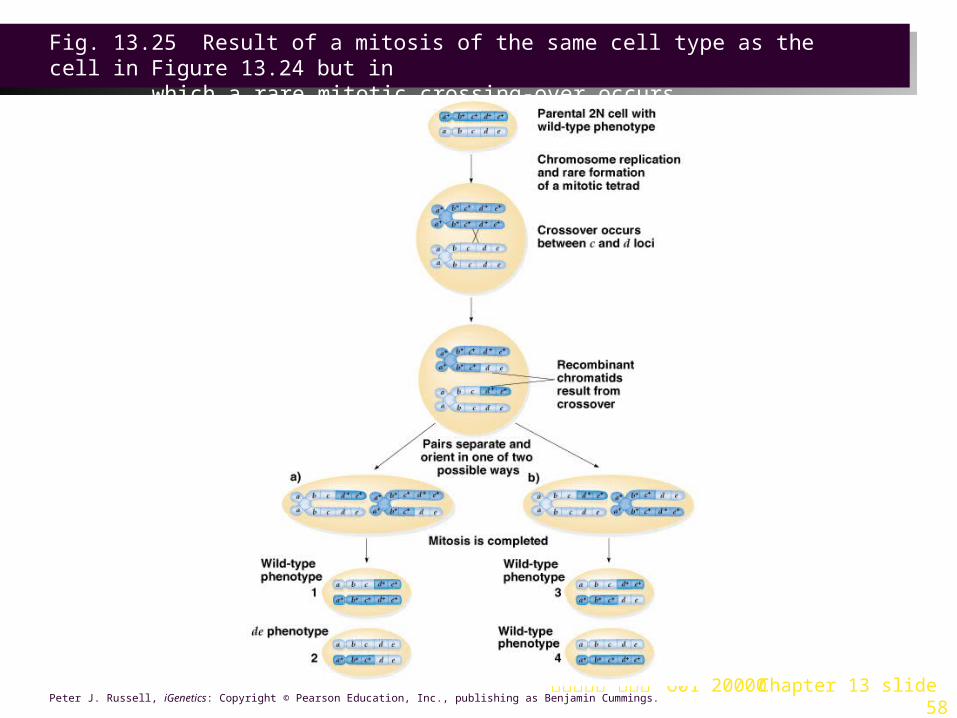
1. A rare event occurring only in diploid cells, mitotic crossover can result when replicated chromatids come together to form a structure similar to the four-strand stage in meiosis (Figures 13.24 and 13.25).
2. If the starting genotype is d+ e / d e+ the two possible orientations of the resulting chromatids are:
a. One cell with d+ e+ / d+ e+ and one with d e / d e. These are the ones that are useful for mapping, because the recessive phenotype can be observed in progeny of the d e / d e cells.
b. Reversal of the alleles, d e+ / d+ e. Phenotypically indistinguishable from non-recombinant cells, these are not useful for mapping, but are nonetheless derived from a crossover event.

台大農藝系 遺傳學 601 20000 Chapter 13 slide 57Peter J. Russell, iGenetics: Copyright © Pearson Education, Inc., publishing as Benjamin Cummings.
Fig. 13.24 Normal mitotic segregation of genes in a theoretical diploid cell with one
homologous pair of chromosomes
台大農藝系 遺傳學 601 20000 Chapter 13 slide 58Peter J. Russell, iGenetics: Copyright © Pearson Education, Inc., publishing as Benjamin Cummings.
Fig. 13.25 Result of a mitosis of the same cell type as the cell in Figure 13.24 but in
which a rare mitotic crossing-over occurs
台大農藝系 遺傳學 601 20000 Chapter 13 slide 59
Retinoblastoma, a Human Tumor That Can Be Caused by Mitotic Recombination 1. Retinoblastoma is the most common childhood eye cancer, occurring
from birth to 4 years of age. Two types are known:
a. The sporadic (nonhereditary) form occurs in an individual with no family history of the disease, and affects only one eye (unilateral).
b. The hereditary form affects both eyes (bilateral) and usually occurs at an earlier age than sporadic.
2. A single gene (Rb) on chromosome 13q14 is involved.
a. In hereditary retinoblastoma, tumor cells have mutations in both copies of this gene, while other cells in the same individual are heterozygous. The disease is caused by a second mutation that affects the normal RB allele.
b. The second mutation is often identical to the one on the other chromosome, strong circumstantial evidence that the wild-type copy of the gene is somehow replaced by the inherited mutated allele. One possible explanation is mitotic recombination (Figure 13.25).