

Антон Наумович, Система автоматической крэш-аналитики...
31
Automatic Crash Analysis System Anton Naumovich
-
Upload
sergey-platonov -
Category
Software
-
view
455 -
download
1
Transcript of Антон Наумович, Система автоматической крэш-аналитики...

Automatic Crash Analysis System
Anton Naumovich

About me
Anton NaumovichDevelopment Manager at LogicNowTechnical Consultant at DPI.Solutions● Developer at Microsoft (Hyper-V) in the past● Specializing in performance, debugging,
troubleshooting

Bad things happen
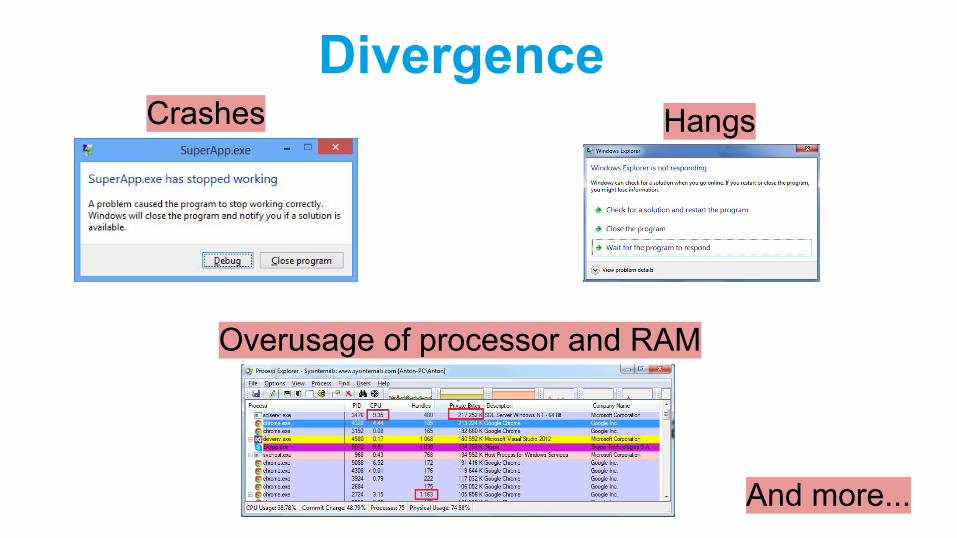
DivergenceCrashes Hangs
Overusage of processor and RAM
And more...

Large numbers

Sources of divergence
Developers’ mistakes
Thirdparty libraries issues
Environment diversity (software, hardware)

How to find the root cause?
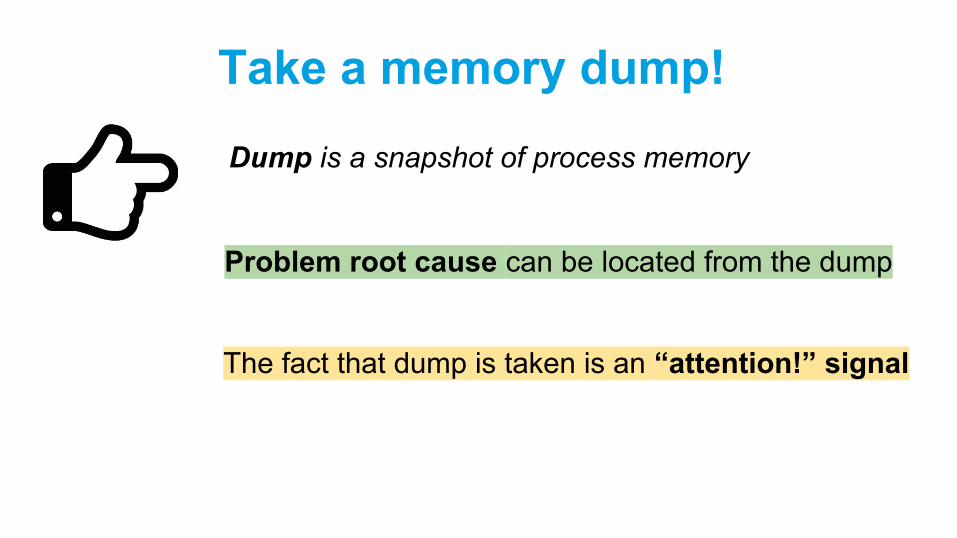
Take a memory dump!
Dump is a snapshot of process memory
Problem root cause can be located from the dump
The fact that dump is taken is an “attention!” signal
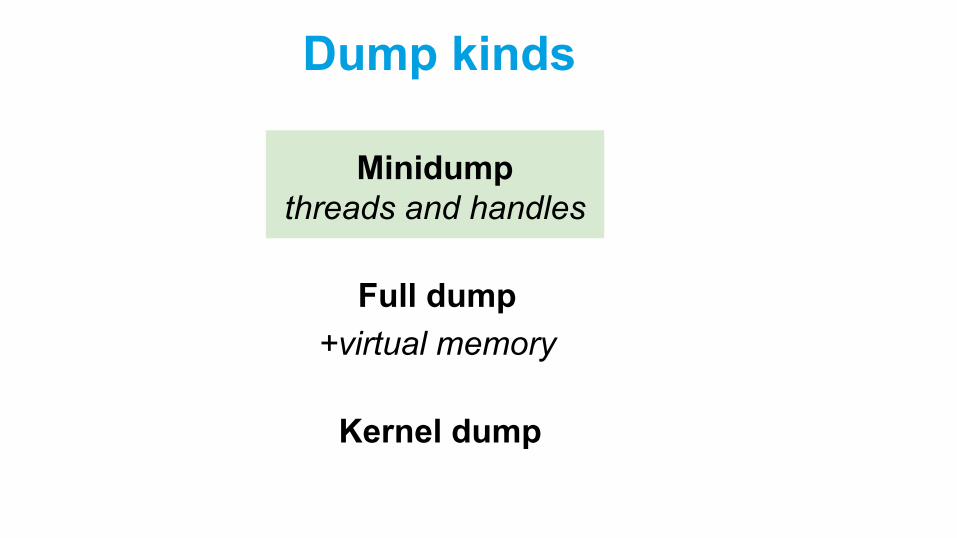
Dump kinds
Minidumpthreads and handles
Full dump+virtual memory
Kernel dump
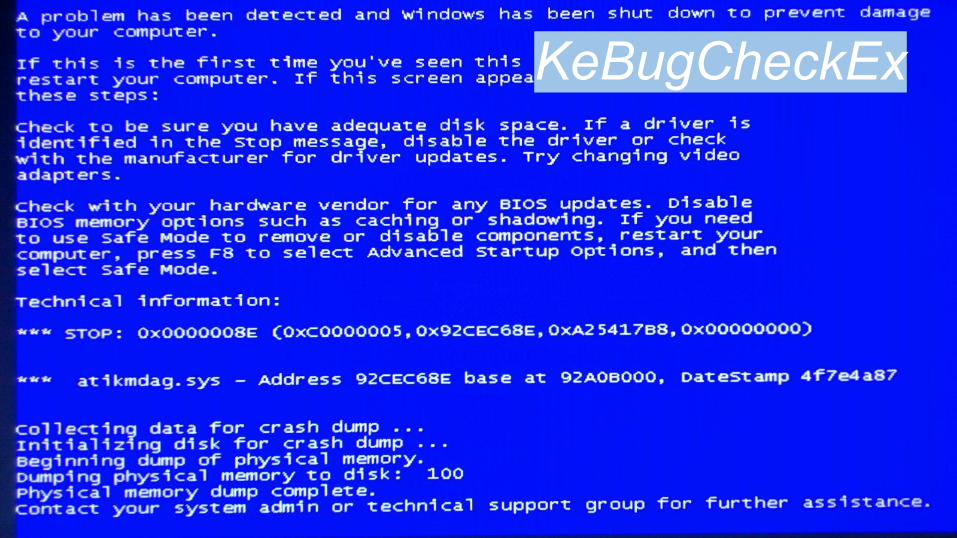
KeBugCheckEx
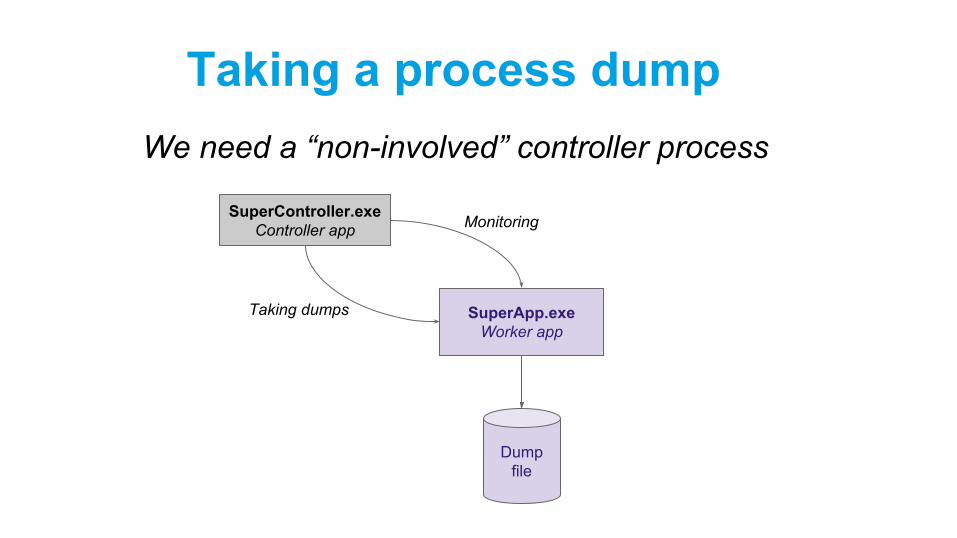
Taking a process dumpWe need a “non-involved” controller process
SuperController.exeController app
SuperApp.exeWorker app
Dump file
Monitoring
Taking dumps
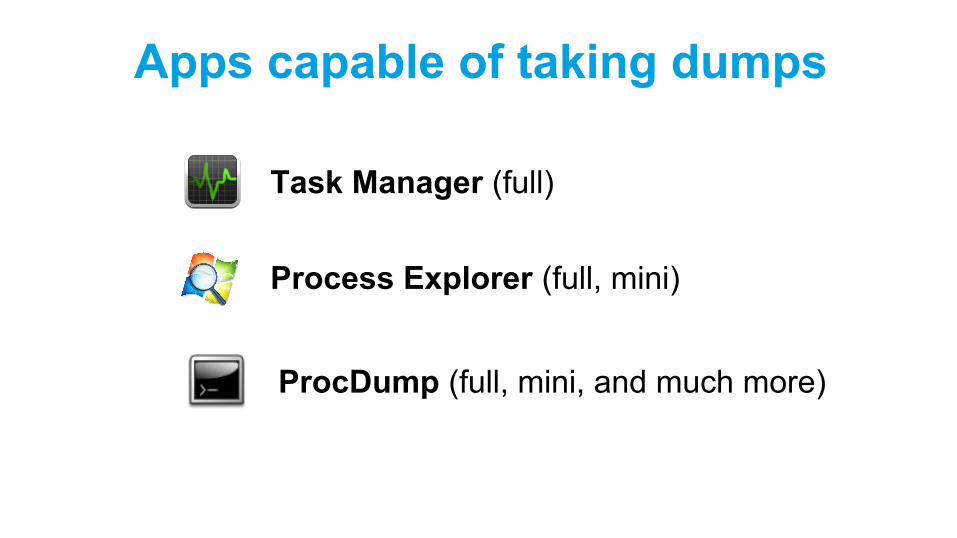
Apps capable of taking dumps
Process Explorer (full, mini)
Task Manager (full)
ProcDump (full, mini, and much more)
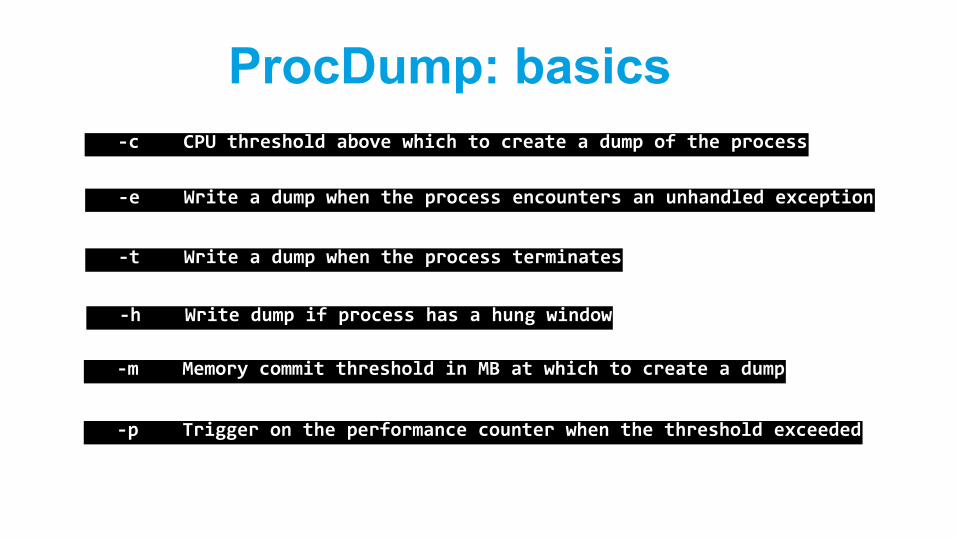
ProcDump: basics -c CPU threshold above which to create a dump of the process
-e Write a dump when the process encounters an unhandled exception
-m Memory commit threshold in MB at which to create a dump
-t Write a dump when the process terminates
-h Write dump if process has a hung window
-p Trigger on the performance counter when the threshold exceeded

ProcDump: advanced -w Wait for the specified process to launch if it's not running
-s Consecutive seconds before dump is written (default is 10)
-n Number of dumps to write before exiting
-r Dump using a clone
-i Install ProcDump as the AeDebug postmortem debugger
-ma Write a dump file with all process memory
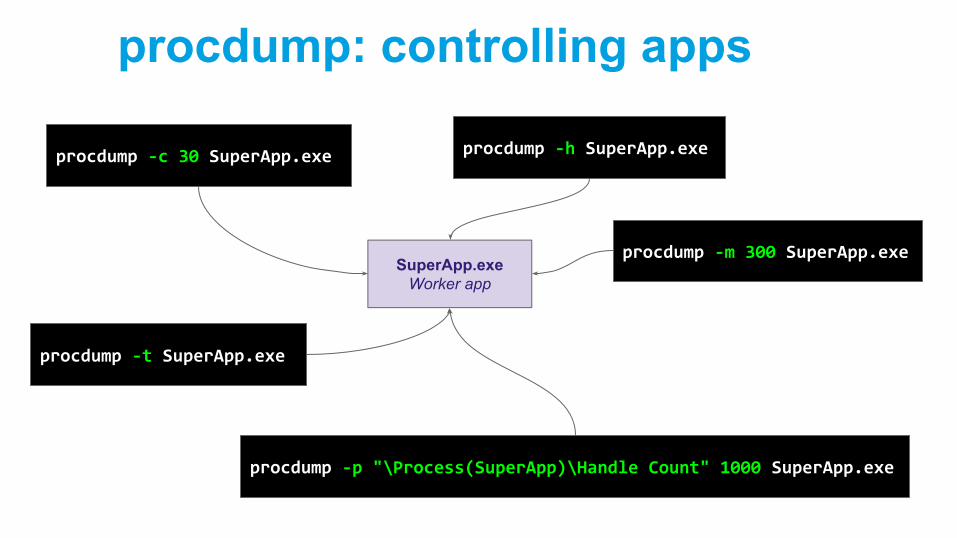
procdump: controlling apps
SuperApp.exeWorker app
procdump -c 30 SuperApp.exe procdump -h SuperApp.exe
procdump -m 300 SuperApp.exe
procdump -t SuperApp.exe
procdump -p "\Process(SuperApp)\Handle Count" 1000 SuperApp.exe

Fetching info from the dump
Dump analysis is just static debugging
cdb.exe -y C:\lab -i C:\lab -z C:\lab\SuperApp.dmp -c "~*k;q" > C:\analysis.txt
Easily automatable:
Debugger
SuperApp.pdbDebugging
symbols
SuperApp.dmpMemory dump
SuperApp.exeApp executable
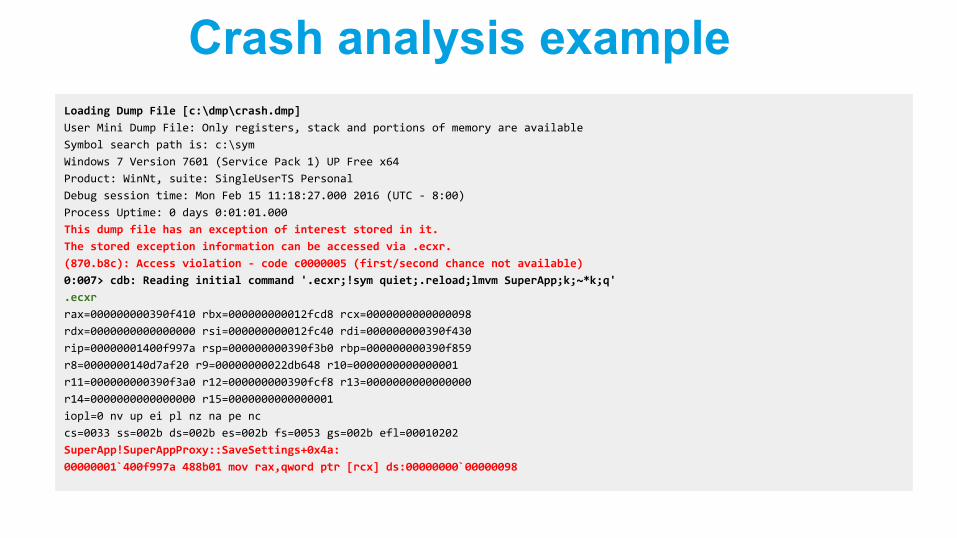
Crash analysis exampleLoading Dump File [c:\dmp\crash.dmp]
User Mini Dump File: Only registers, stack and portions of memory are available
Symbol search path is: c:\sym
Windows 7 Version 7601 (Service Pack 1) UP Free x64
Product: WinNt, suite: SingleUserTS Personal
Debug session time: Mon Feb 15 11:18:27.000 2016 (UTC - 8:00)
Process Uptime: 0 days 0:01:01.000
This dump file has an exception of interest stored in it.
The stored exception information can be accessed via .ecxr.
(870.b8c): Access violation - code c0000005 (first/second chance not available)
0:007> cdb: Reading initial command '.ecxr;!sym quiet;.reload;lmvm SuperApp;k;~*k;q'
.ecxr
rax=000000000390f410 rbx=000000000012fcd8 rcx=0000000000000098
rdx=0000000000000000 rsi=000000000012fc40 rdi=000000000390f430
rip=00000001400f997a rsp=000000000390f3b0 rbp=000000000390f859
r8=0000000140d7af20 r9=00000000022db648 r10=0000000000000001
r11=000000000390f3a0 r12=000000000390fcf8 r13=0000000000000000
r14=0000000000000000 r15=0000000000000001
iopl=0 nv up ei pl nz na pe nc
cs=0033 ss=002b ds=002b es=002b fs=0053 gs=002b efl=00010202
SuperApp!SuperAppProxy::SaveSettings+0x4a:
00000001`400f997a 488b01 mov rax,qword ptr [rcx] ds:00000000`00000098
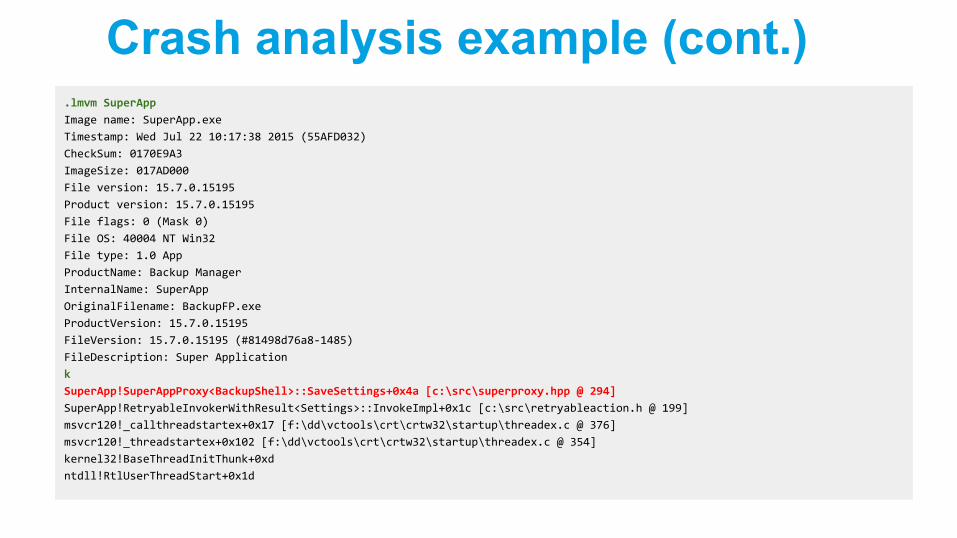
Crash analysis example (cont.).lmvm SuperApp
Image name: SuperApp.exe
Timestamp: Wed Jul 22 10:17:38 2015 (55AFD032)
CheckSum: 0170E9A3
ImageSize: 017AD000
File version: 15.7.0.15195
Product version: 15.7.0.15195
File flags: 0 (Mask 0)
File OS: 40004 NT Win32
File type: 1.0 App
ProductName: Backup Manager
InternalName: SuperApp
OriginalFilename: BackupFP.exe
ProductVersion: 15.7.0.15195
FileVersion: 15.7.0.15195 (#81498d76a8-1485)
FileDescription: Super Application
k
SuperApp!SuperAppProxy<BackupShell>::SaveSettings+0x4a [c:\src\superproxy.hpp @ 294]
SuperApp!RetryableInvokerWithResult<Settings>::InvokeImpl+0x1c [c:\src\retryableaction.h @ 199]
msvcr120!_callthreadstartex+0x17 [f:\dd\vctools\crt\crtw32\startup\threadex.c @ 376]
msvcr120!_threadstartex+0x102 [f:\dd\vctools\crt\crtw32\startup\threadex.c @ 354]
kernel32!BaseThreadInitThunk+0xd
ntdll!RtlUserThreadStart+0x1d
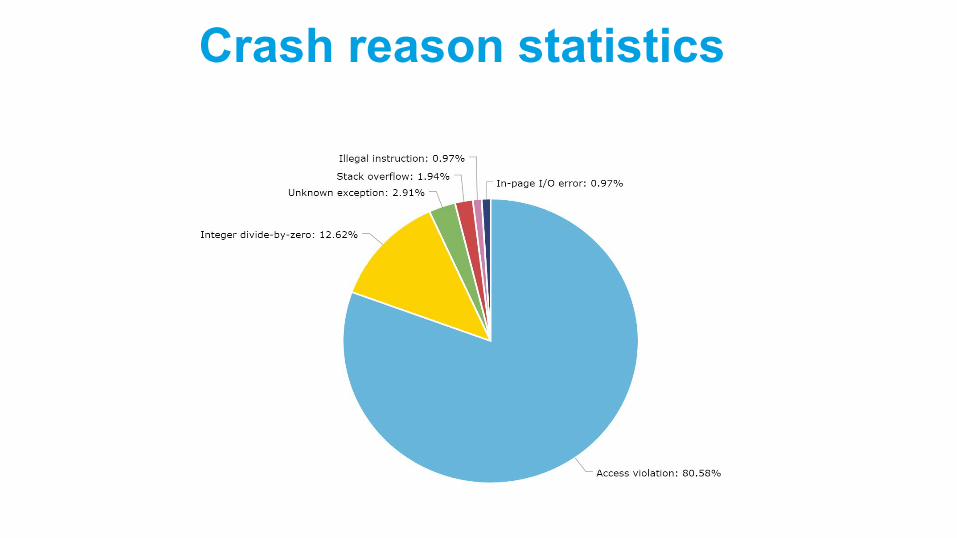
Crash reason statistics

Hang reasons
Deadlock Antivirus & Co
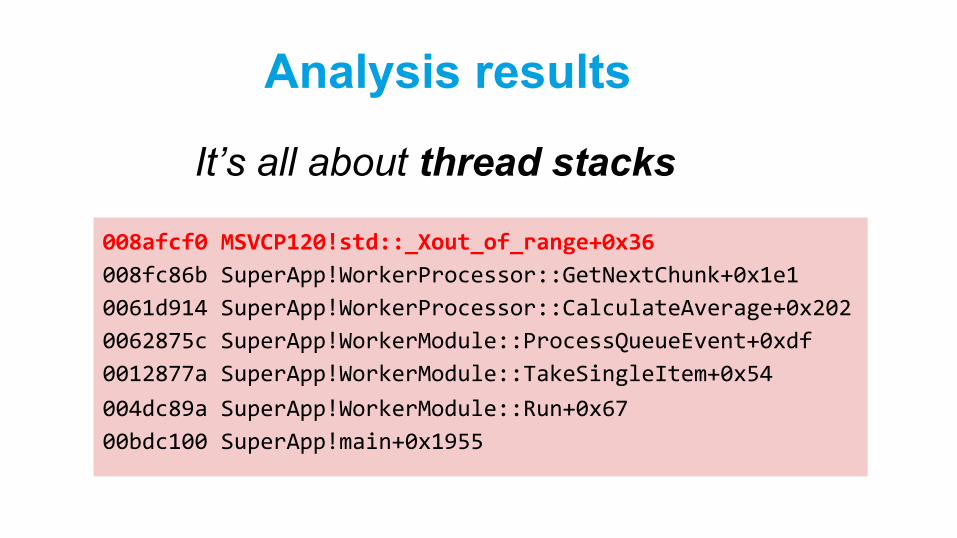
Analysis results
It’s all about thread stacks
008afcf0 MSVCP120!std::_Xout_of_range+0x36
008fc86b SuperApp!WorkerProcessor::GetNextChunk+0x1e1
0061d914 SuperApp!WorkerProcessor::CalculateAverage+0x202
0062875c SuperApp!WorkerModule::ProcessQueueEvent+0xdf
0012877a SuperApp!WorkerModule::TakeSingleItem+0x54
004dc89a SuperApp!WorkerModule::Run+0x67
00bdc100 SuperApp!main+0x1955

Mission Control
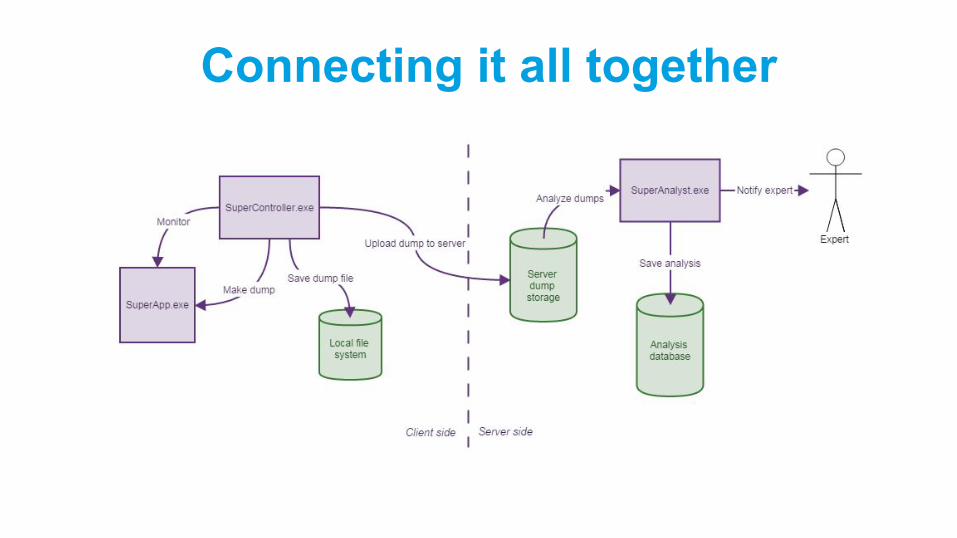
Connecting it all together
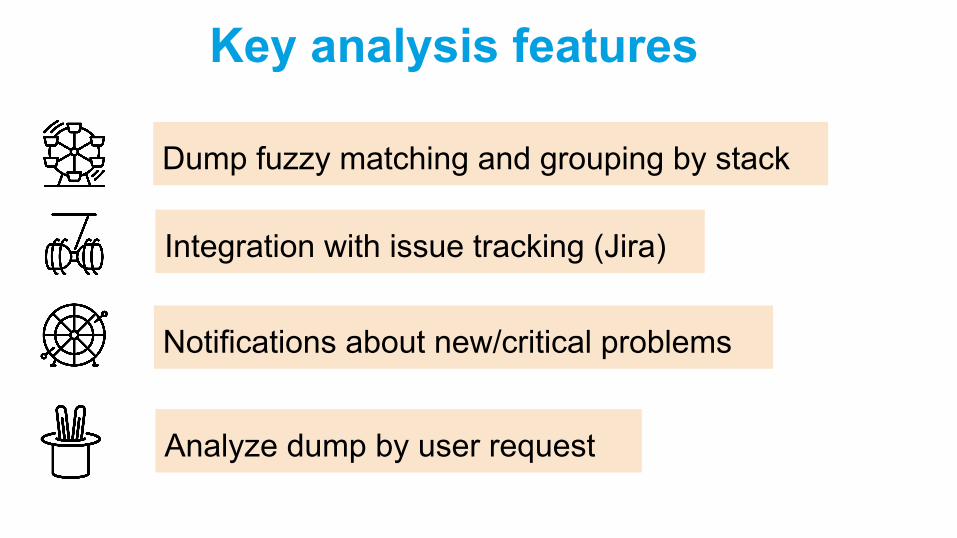
Key analysis features
Dump fuzzy matching and grouping by stack
Integration with issue tracking (Jira)
Analyze dump by user request
Notifications about new/critical problems
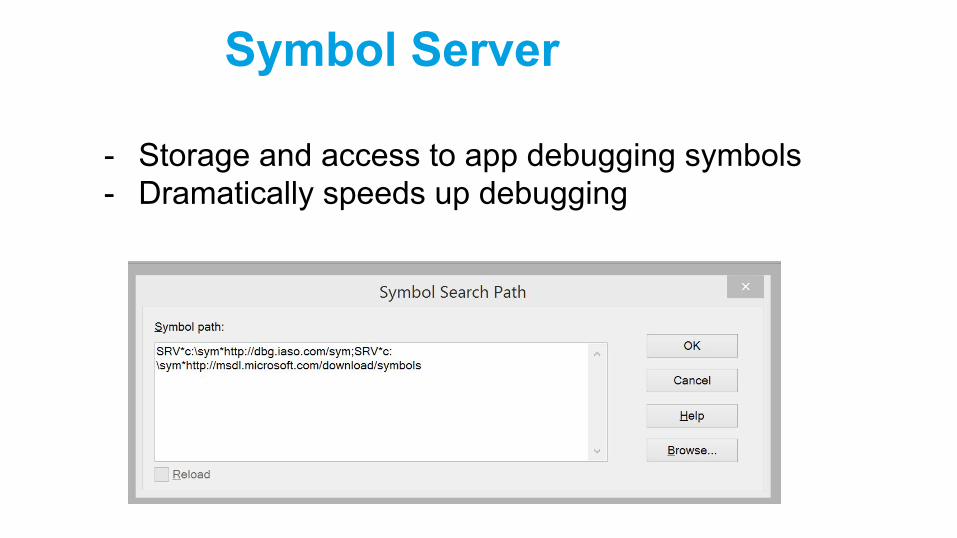
Symbol Server
- Storage and access to app debugging symbols- Dramatically speeds up debugging
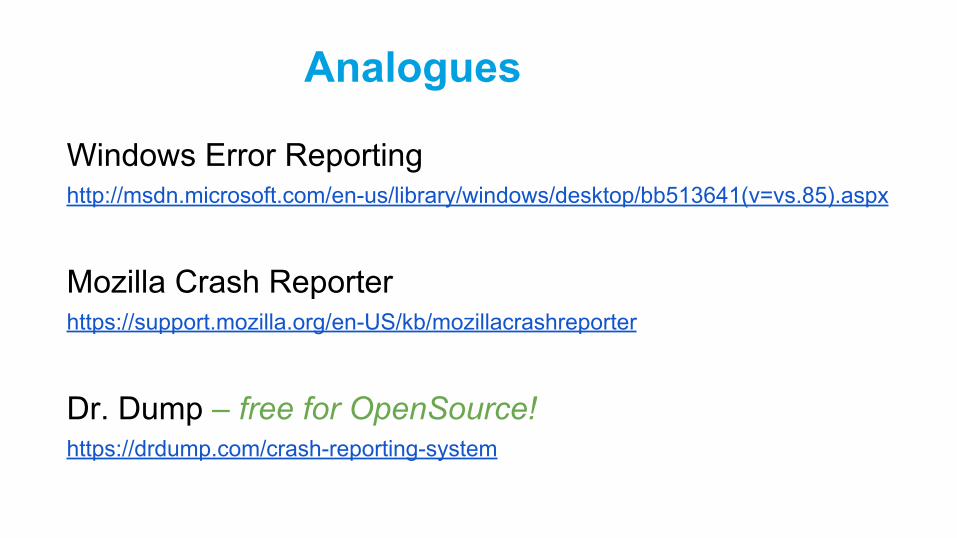
Analogues
Windows Error Reportinghttp://msdn.microsoft.com/en-us/library/windows/desktop/bb513641(v=vs.85).aspx
Mozilla Crash Reporterhttps://support.mozilla.org/en-US/kb/mozillacrashreporter
Dr. Dump – free for OpenSource!https://drdump.com/crash-reporting-system
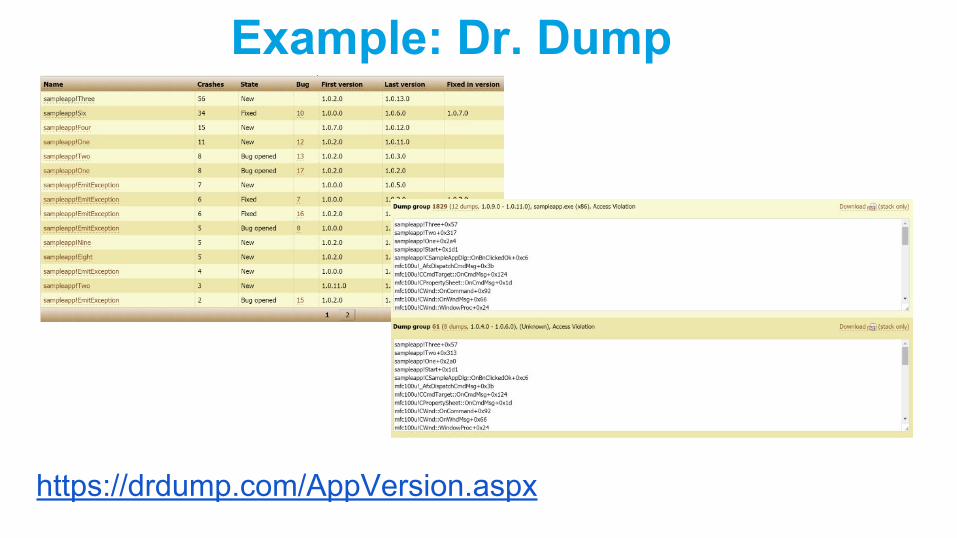
Example: Dr. Dump
https://drdump.com/AppVersion.aspx
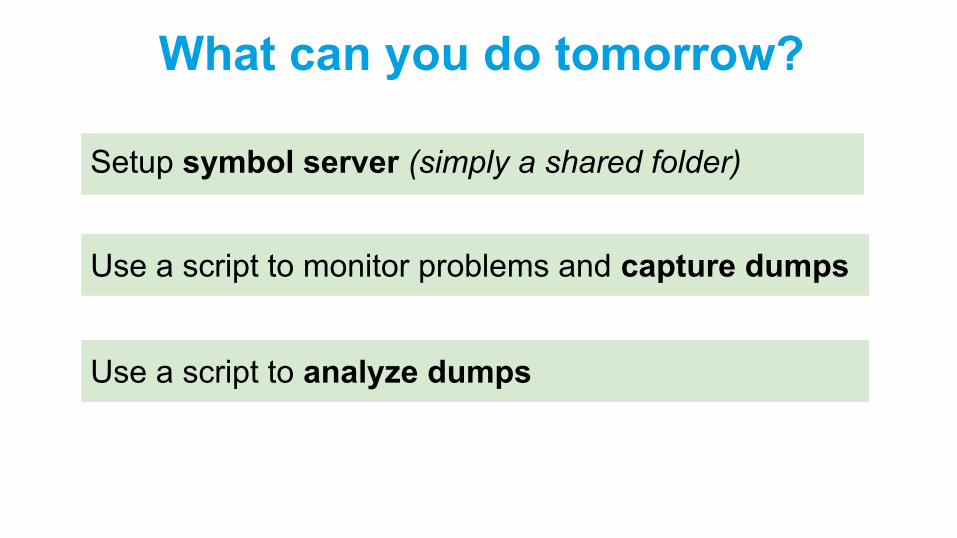
What can you do tomorrow?
Setup symbol server (simply a shared folder)
Use a script to monitor problems and capture dumps
Use a script to analyze dumps
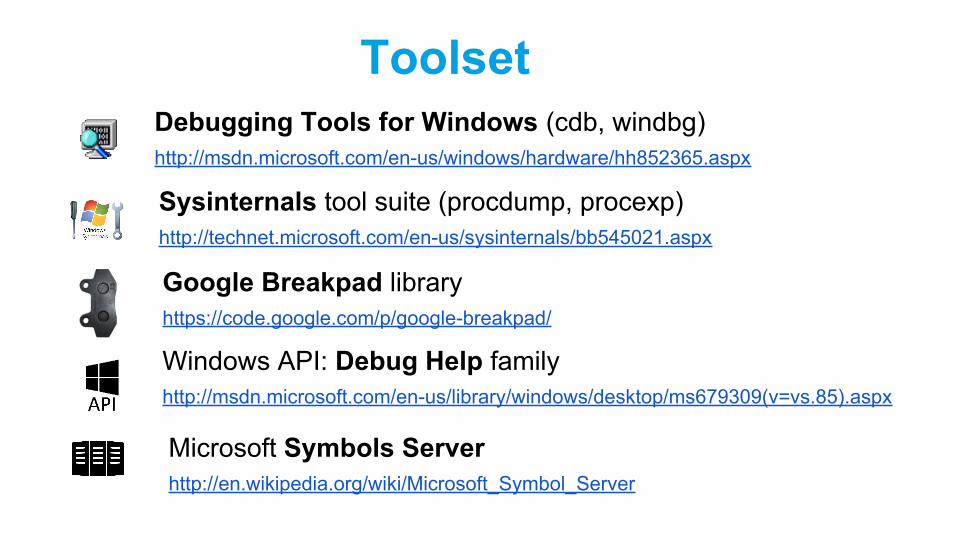
ToolsetDebugging Tools for Windows (cdb, windbg)http://msdn.microsoft.com/en-us/windows/hardware/hh852365.aspx
Sysinternals tool suite (procdump, procexp)http://technet.microsoft.com/en-us/sysinternals/bb545021.aspx
Google Breakpad libraryhttps://code.google.com/p/google-breakpad/
Windows API: Debug Help familyhttp://msdn.microsoft.com/en-us/library/windows/desktop/ms679309(v=vs.85).aspx
Microsoft Symbols Serverhttp://en.wikipedia.org/wiki/Microsoft_Symbol_Server
1. Speed up defect location2. Immediate reaction to critical problems3. Version quality indicators4. Improve stability
Profit