2014 年版 情報サービス産業 基本統計調査26-J001 2014年版 情報サービス産業 基本統計調査 平成27年1月 一般社団法人 情報サービス産業協会
平 成 2 9 年
2 0 1 7
経済産業省生産動態統計年報 紙・印刷・プラスチック製品・ゴム製品統計編
YEARBOOK OF
CURRENT PRODUCTION STATISTICS
PAPER , PRINTING , PLASTIC PRODUCTS
AND RUBBER PRODUCTS
経済産業省大臣官房調査統計グループ
Research and Statistics Department Minister’s Secretariat
Ministry of Economy, Trade and Industry(METI)

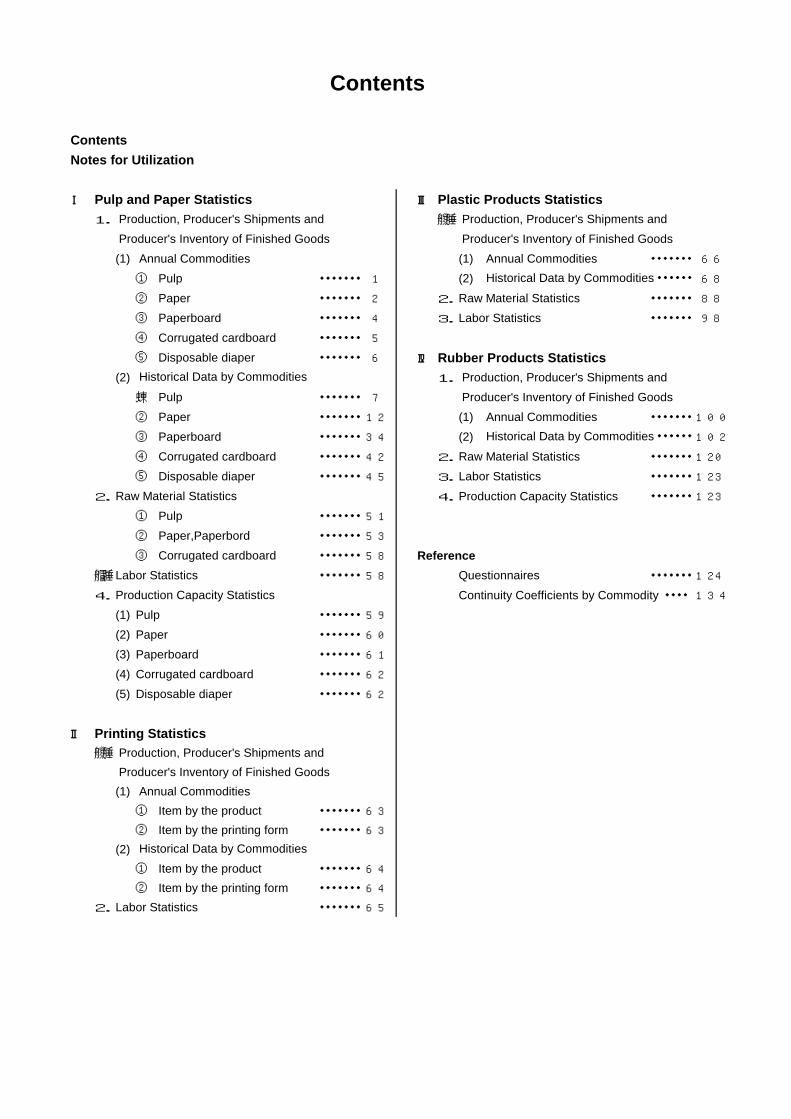
目次
利用上の注意
Ⅰ 紙・パルプ統計 Ⅲ プラスチック製品統計
1. 生産・出荷・在庫統計 1. 生産・出荷・在庫統計
(1) 製品年計 (1) 製品年計 ・・・・・・・・・・ 66
① パルプ ・・・・・・・・・・ 1 (2) 製品時系列 ・・・・・・・・・・ 68
② 紙 ・・・・・・・・・・ 2 2. 原材料統計 ・・・・・・・・・・ 88
③ 板紙 ・・・・・・・・・・ 4 3. 労務統計 ・・・・・・・・・・ 98
④ 段ボール ・・・・・・・・・・ 5
⑤ 紙おむつ ・・・・・・・・・・ 6 Ⅳ ゴム製品統計
(2) 製品時系列 1. 生産・出荷・在庫統計
① パルプ ・・・・・・・・・・ 7 (1) 製品年計 ・・・・・・・・・・ 100
② 紙 ・・・・・・・・・・ 12 (2) 製品時系列 ・・・・・・・・・・ 102
③ 板紙 ・・・・・・・・・・ 34 2. 原材料統計 ・・・・・・・・・・ 120
④ 段ボール ・・・・・・・・・・ 42 3. 労務統計 ・・・・・・・・・・ 123
⑤ 紙おむつ ・・・・・・・・・・ 45 4. 生産能力統計 ・・・・・・・・・・ 123
2. 原材料統計
① パルプ ・・・・・・・・・・ 51 ≪参考≫
② 紙・板紙 ・・・・・・・・・・ 53 調査票 ・・・・・・・・・・ 124
③ 段ボール ・・・・・・・・・・ 58 品目別接続係数 ・・・・・・・・・・ 134
3. 労務統計 ・・・・・・・・・・ 58
4. 生産能力統計
(1) パルプ ・・・・・・・・・・ 59
(2) 紙 ・・・・・・・・・・ 60
(3) 板紙 ・・・・・・・・・・ 61
(4) 段ボール ・・・・・・・・・・ 62
(5) 紙おむつ ・・・・・・・・・・ 62
Ⅱ 印刷統計
1. 生産・出荷・在庫統計
(1) 製品年計
①製品別内訳 ・・・・・・・・・・ 63
②印刷方式別内訳 ・・・・・・・・・・ 63
(2) 製品時系列
①製品別内訳 ・・・・・・・・・・ 64
②印刷方式別内訳 ・・・・・・・・・・ 64
2. 労務統計 ・・・・・・・・・・ 65
目 次
ContentsNotes for Utilization
Ⅰ Pulp and Paper Statistics Ⅲ Plastic Products Statistics1. Production, Producer's Shipments and 1. Production, Producer's Shipments and
Producer's Inventory of Finished Goods Producer's Inventory of Finished Goods (1) Annual Commodities (1) Annual Commodities ・・・・・・・ 66
① Pulp ・・・・・・・ 1 (2) 68
② Paper ・・・・・・・ 2 2. Raw Material Statistics ・・・・・・・ 88
③ Paperboard ・・・・・・・ 4 3. Labor Statistics ・・・・・・・ 98
④ Corrugated cardboard ・・・・・・・ 5
⑤ Disposable diaper ・・・・・・・ 6 Ⅳ Rubber Products Statistics(2) 1. Production, Producer's Shipments and
① Pulp ・・・・・・・ 7 Producer's Inventory of Finished Goods② Paper ・・・・・・・ 12 (1) Annual Commodities ・・・・・・・ 100
③ Paperboard ・・・・・・・ 34 (2) 102
④ Corrugated cardboard ・・・・・・・ 42 2. Raw Material Statistics ・・・・・・・ 120
⑤ Disposable diaper ・・・・・・・ 45 3. Labor Statistics ・・・・・・・ 123
2. Raw Material Statistics 4. Production Capacity Statistics ・・・・・・・ 123
① Pulp ・・・・・・・ 51
② Paper,Paperbord ・・・・・・・ 53
③ Corrugated cardboard ・・・・・・・ 58 Reference3. Labor Statistics ・・・・・・・ 58 Questionnaires ・・・・・・・ 124
4. Production Capacity Statistics Continuity Coefficients by Commodity ・・・・ 134
(1) Pulp ・・・・・・・ 59
(2) Paper ・・・・・・・ 60
(3) Paperboard ・・・・・・・ 61
(4) Corrugated cardboard ・・・・・・・ 62
(5) Disposable diaper ・・・・・・・ 62
Ⅱ Printing Statistics1. Production, Producer's Shipments and
Producer's Inventory of Finished Goods(1) Annual Commodities
① Item by the product ・・・・・・・ 63
② Item by the printing form ・・・・・・・ 63
(2)① Item by the product ・・・・・・・ 64
② Item by the printing form ・・・・・・・ 64
2. Labor Statistics ・・・・・・・ 65
Historical Data by Commodities
Historical Data by Commodities・・・・・・
Contents
Historical Data by Commodities
Historical Data by Commodities・・・・・・
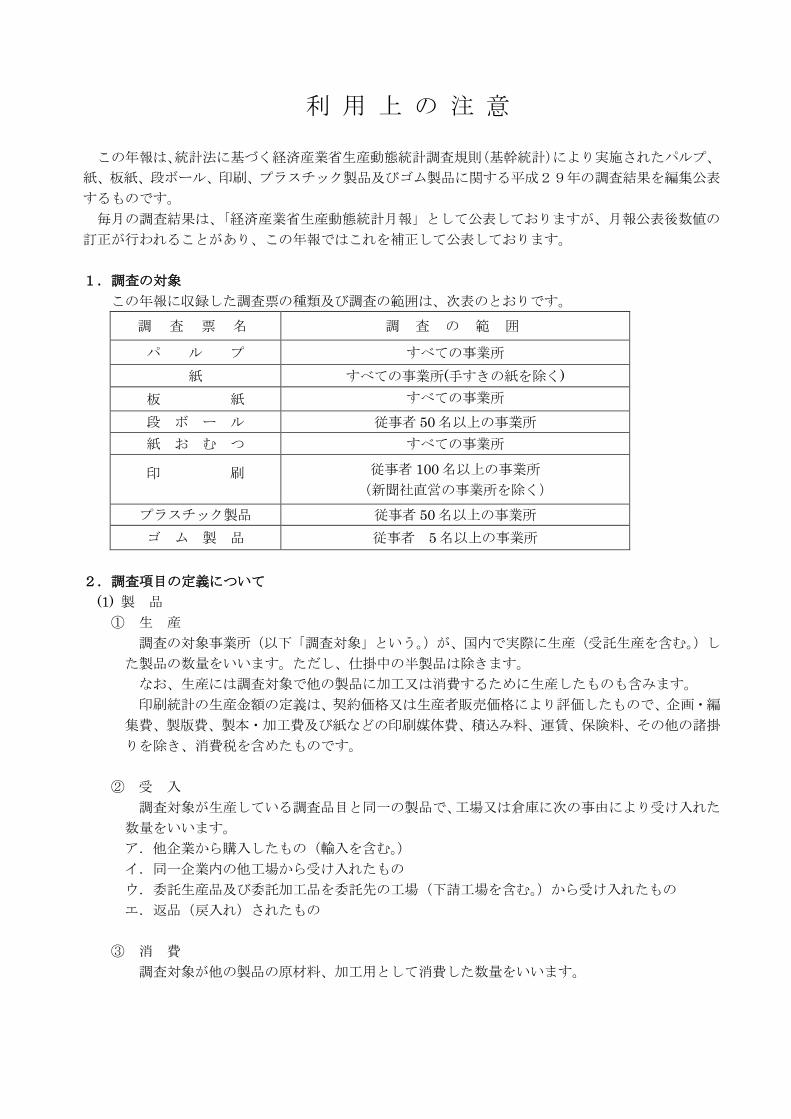
利 用 上 の 注 意 この年報は、統計法に基づく経済産業省生産動態統計調査規則(基幹統計)により実施されたパルプ、
紙、板紙、段ボール、印刷、プラスチック製品及びゴム製品に関する平成29年の調査結果を編集公表
するものです。 毎月の調査結果は、「経済産業省生産動態統計月報」として公表しておりますが、月報公表後数値の
訂正が行われることがあり、この年報ではこれを補正して公表しております。 1.調査の対象 この年報に収録した調査票の種類及び調査の範囲は、次表のとおりです。
調 査 票 名 調 査 の 範 囲
パ ル プ すべての事業所 紙 すべての事業所(手すきの紙を除く)
板 紙 すべての事業所 段 ボ ー ル 従事者 50 名以上の事業所 紙 お む つ すべての事業所
印 刷
従事者 100 名以上の事業所 (新聞社直営の事業所を除く)
プラスチック製品 従事者 50 名以上の事業所 ゴ ム 製 品 従事者 5 名以上の事業所
2.調査項目の定義について (1) 製 品 ① 生 産 調査の対象事業所(以下「調査対象」という。)が、国内で実際に生産(受託生産を含む。)し
た製品の数量をいいます。ただし、仕掛中の半製品は除きます。 なお、生産には調査対象で他の製品に加工又は消費するために生産したものも含みます。 印刷統計の生産金額の定義は、契約価格又は生産者販売価格により評価したもので、企画・編
集費、製版費、製本・加工費及び紙などの印刷媒体費、積込み料、運賃、保険料、その他の諸掛
りを除き、消費税を含めたものです。 ② 受 入 調査対象が生産している調査品目と同一の製品で、工場又は倉庫に次の事由により受け入れた
数量をいいます。 ア.他企業から購入したもの(輸入を含む。) イ.同一企業内の他工場から受け入れたもの ウ.委託生産品及び委託加工品を委託先の工場(下請工場を含む。)から受け入れたもの エ.返品(戻入れ)されたもの ③ 消 費 調査対象が他の製品の原材料、加工用として消費した数量をいいます。
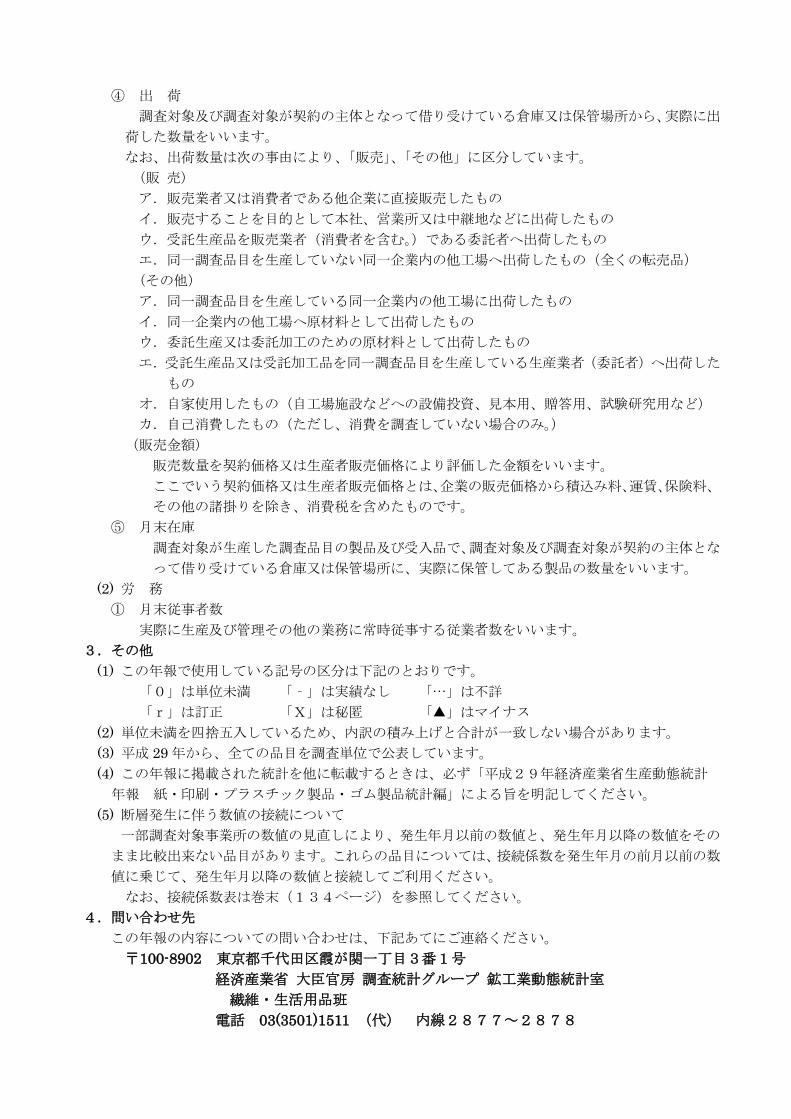
④ 出 荷 調査対象及び調査対象が契約の主体となって借り受けている倉庫又は保管場所から、実際に出
荷した数量をいいます。 なお、出荷数量は次の事由により、「販売」、「その他」に区分しています。 (販 売) ア.販売業者又は消費者である他企業に直接販売したもの イ.販売することを目的として本社、営業所又は中継地などに出荷したもの ウ.受託生産品を販売業者(消費者を含む。)である委託者へ出荷したもの エ.同一調査品目を生産していない同一企業内の他工場へ出荷したもの(全くの転売品) (その他) ア.同一調査品目を生産している同一企業内の他工場に出荷したもの イ.同一企業内の他工場へ原材料として出荷したもの ウ.委託生産又は委託加工のための原材料として出荷したもの エ.受託生産品又は受託加工品を同一調査品目を生産している生産業者(委託者)へ出荷した
もの オ.自家使用したもの(自工場施設などへの設備投資、見本用、贈答用、試験研究用など) カ.自己消費したもの(ただし、消費を調査していない場合のみ。) (販売金額) 販売数量を契約価格又は生産者販売価格により評価した金額をいいます。 ここでいう契約価格又は生産者販売価格とは、企業の販売価格から積込み料、運賃、保険料、
その他の諸掛りを除き、消費税を含めたものです。 ⑤ 月末在庫 調査対象が生産した調査品目の製品及び受入品で、調査対象及び調査対象が契約の主体とな
って借り受けている倉庫又は保管場所に、実際に保管してある製品の数量をいいます。 (2) 労 務 ① 月末従事者数 実際に生産及び管理その他の業務に常時従事する従業者数をいいます。 3.その他 (1) この年報で使用している記号の区分は下記のとおりです。 「0」は単位未満 「‐」は実績なし 「…」は不詳 「r」は訂正 「X」は秘匿 「▲」はマイナス (2) 単位未満を四捨五入しているため、内訳の積み上げと合計が一致しない場合があります。 (3) 平成 29 年から、全ての品目を調査単位で公表しています。 (4) この年報に掲載された統計を他に転載するときは、必ず「平成29年経済産業省生産動態統計
年報 紙・印刷・プラスチック製品・ゴム製品統計編」による旨を明記してください。 (5) 断層発生に伴う数値の接続について
一部調査対象事業所の数値の見直しにより、発生年月以前の数値と、発生年月以降の数値をその
まま比較出来ない品目があります。これらの品目については、接続係数を発生年月の前月以前の数
値に乗じて、発生年月以降の数値と接続してご利用ください。 なお、接続係数表は巻末(134ページ)を参照してください。
4.問い合わせ先 この年報の内容についての問い合わせは、下記あてにご連絡ください。 〒100-8902 東京都千代田区霞が関一丁目3番1号 経済産業省 大臣官房 調査統計グループ 鉱工業動態統計室 繊維・生活用品班 電話 03(3501)1511 (代) 内線2877~2878
Notes for Utilization The objective of this yearbook is to compile and publish the results of the 2017 survey concerning pulp, paper, paperboard, corrugated cardboard, printing, plastics products and rubber products, which is conducted under the METI’s Regulations for the Current Survey of Production (Fundamental Statistics) based on the Statistics Law.
The results of the monthly survey are published as a‘Monthly Report of Current Production Statistics” . After being published in the monthly report, figures may be revised. 1. Subject of the survey The kinds of questionnaires and scope of the survey in this yearbook are as in the following table.
Kinds of questionnaires Scope of the survey Pulp All business establishments
Paper All business establishments (excluding handmade paper) Paperboard All business establishments
Corrugated cardboard Business establishments with50 or more regular employees Disposable diaper All business establishments
Printing
Business establishments with 100 or more regular employees (excluding business establishments under the direct management of newspaper companies.)
Plastics products Business establishments with 50 or more regular employees Rubber products Business establishments with 5 or more regular employees
2. The definition of survey items (1) Product ① Production The quantity of products actually produced (including produced as a consignee) by the establishment that is the object of the survey (hereafter, ‘the survey object’). However, ‘products in process’ shall be excluded. Besides, ‘Production’ includes products as process goods or for consumption for other products in ‘the survey object’. Production value for printing statistics are determined by assessing producer's selling prices or contract prices. Values include consumption tax, except for planning and editing expenses; platemaking costs; bookbinding and processing costs; cost of media, such as paper; shipping costs; insurance; and various other expenses. ② Receipt The quantity of products received by the factories or warehouses of ‘the survey object’ that produces the same survey commodity items due to the following circumstances: a. Purchase from other enterprises (including imports) b. Reception from other factories belonging to the same enterprise c. The commissioned products and commission-manufactured products received from the consignees (including
subcontracted factories) d. Returned products ③ Consumption The quantity of products consumed as materials, process goods in ‘the survey object’ ④ Shipments The quantity of products actually shipped from ‘the survey object’s’ warehouse or rental warehouse which ‘the survey object’ mainly uses Besides, the quantity of products is distinguished as ‘Sales’ or ‘Others’ in the following ways: (Sales) a. Products directly sold to distributors or other consumer enterprises
b. Products shipped to the headquarters/sales offices or relay points for the purpose of selling c. Commissioned products shipped to consigners that are sales dealers (including consumers) d. Products shipped to other factories of the same enterprise which are not producing the same survey commodity (Others) a. Products shipped to other factories of the same enterprise which are producing the same products as the survey
commodity b. Products shipped to other factories of the same enterprise as materials c. Products shipped as materials for use in the commissioned products or commission-manufactured products d. The commissioned products or commission-manufactured products shipped to the manufacturers (consigners) that
are producing the same survey commodity e. Products used in-house (equipment investment for an enterprise’s own factory, use for samples, use for gifts, use in
testing and research) f. Products consumed in-house (only in the case of the no consumption survey item) (Sales Value) Value as evaluated by the contract price or producer’s selling price In this case, ‘contract price’ or ‘producer’s selling price’ are the enterprise’s selling prices excluding shipping charges, transport costs, insurance costs and other costs, and including consumption tax. ⑤ Inventory at the end of the month The quantity of products produced or received by ‘the survey object’ which are actually stored in ‘the survey object’s’ warehouses and rental warehouses which ‘the survey object’ mainly uses (2) Labor
Number of persons engaged at the end of month The number of employees that actually and regularly engage in production, management or other operations. 3. Others (1) Abbreviations used in this yearbook are as follows: 「0」 Less than unit after rounding 「-」 No results 「・・・」 Unknown 「r」 Revised 「X」 Conceal 「▲」 Minus (2) Figures may not exactly equal totals because of rounding. (3) The unit of the publication value is same as the investigation unit from 2017. (4) When reprinting the statistics contained in this yearbook in other printed matter, the fact that they are based on “the Yearbook of Current Production Statistics Paper, Printing, Plastics Products and Rubber Products Statistics” (Ministry of Economy, Trade and Industry) must be clearly indicated. (5) Continuity Coefficients by Commodity Several goods cannot be compared before and after certain dates due to revision of some surveyed items. For these goods, it is necessary to multiply the figures before the break date by the connecting coefficients and then relate these figures to the figures after the break date. Please refer to page 134, for details. 4. Contact information If there are any questions about the contents of this yearbook, please contact the following address. Textiles and Consumer goods Group, Office of Current Survey for Mining and Manufacturing,
Research and Statistics Department, Minister's Secretariat, Ministry of Economy, Trade and Industry
1-3-1 Kasumigaseki, Chiyoda-ku, Tokyo 100-8902, Japan Tel: +81-3-3501-1511, Extension 2877, 2878
- 1 -
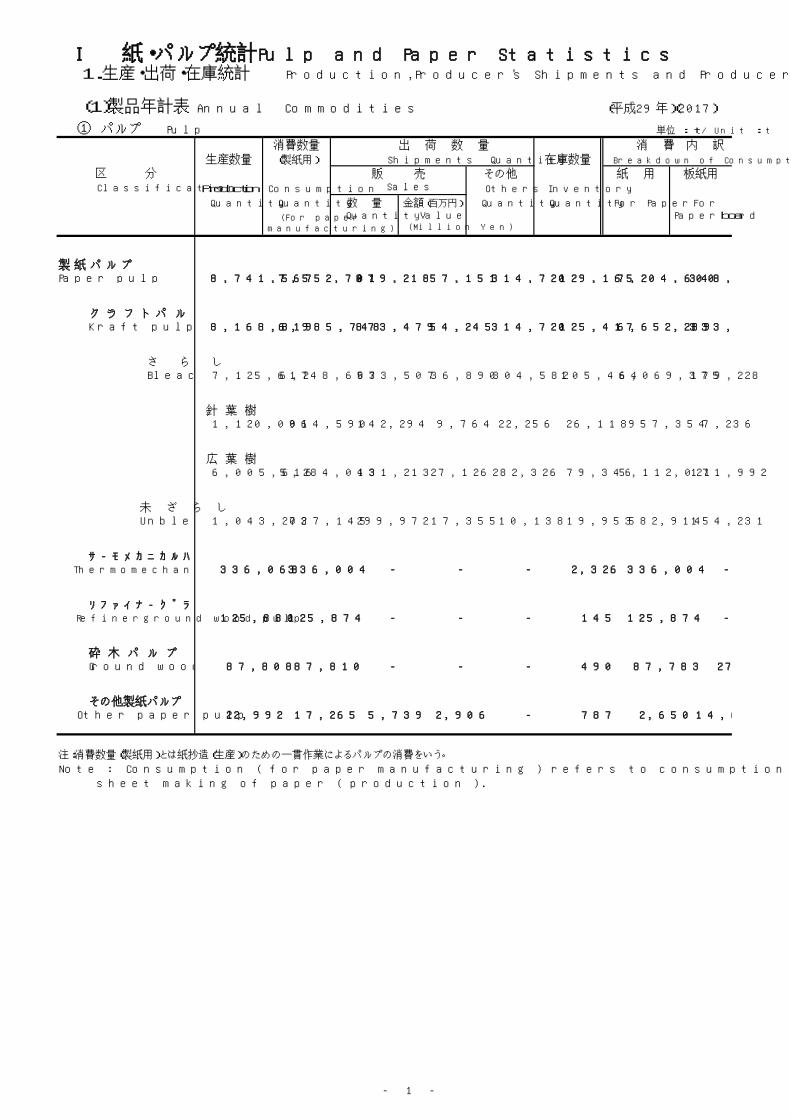
Ⅰ 紙・パルプ統計 Pulp and Paper Statistics
(1)製品年計表 Annual Commodities (平成29年) (2017)
① パルプ Pulp 単位 : t / Unit : t
消費数量 消 費 内 訳(製紙用)
区 分 その他 紙 用 板紙用Classification Production Consumption Others Inventory
Quantity Quantity 数 量 金額(百万円) Quantity Quantity For Paper For
(For papermanufacturing)
Quantity Value(Million Yen)
Paperboard
製 紙 パ ル プPaper pulp 8,741,567 7,552,701 879,218 57,151 314,720 129,165 7,204,600 348,101
ク ラ フ ト パ ル プ Kraft pulp 8,168,819 6,985,748 873,479 54,245 314,720 125,417 6,652,289 333,459
さ ら し Bleached 7,125,617 6,248,603 573,507 36,890 304,582 105,464 6,069,375 179,228
針 葉 樹 Softwood 1,120,001 964,590 142,294 9,764 22,256 26,118 957,354 7,236
広 葉 樹 Hardwood 6,005,616 5,284,013 431,213 27,126 282,326 79,346 5,112,021 171,992
未 ざ ら し Unbleached 1,043,202 737,145 299,972 17,355 10,138 19,953 582,914 154,231
サーモメカニカルパルプ Thermomechanical pulp 336,068 336,004 - - - 2,326 336,004 -
リファイナーグラウンドパルプ Refinerground wood pulp 125,880 125,874 - - - 145 125,874 -
砕 木 パ ル プ Ground wood pulp 87,808 87,810 - - - 490 87,783 27
その他製紙パルプ Other paper pulp 22,992 17,265 5,739 2,906 - 787 2,650 14,615
注:消費数量(製紙用)とは紙抄造(生産)のための一貫作業によるパルプの消費をいう。
Note : Consumption ( for paper manufacturing ) refers to consumption of pulp in integrated operations for sheet making of paper ( production ).
販 売Sales
1.生産・出荷・在庫統計 Production,Producer's Shipments and Producer's Inventory of Finishied Goods
生産数量出 荷 数 量
在庫数量Shipments Quantity Breakdown of Consumption
- 2 -
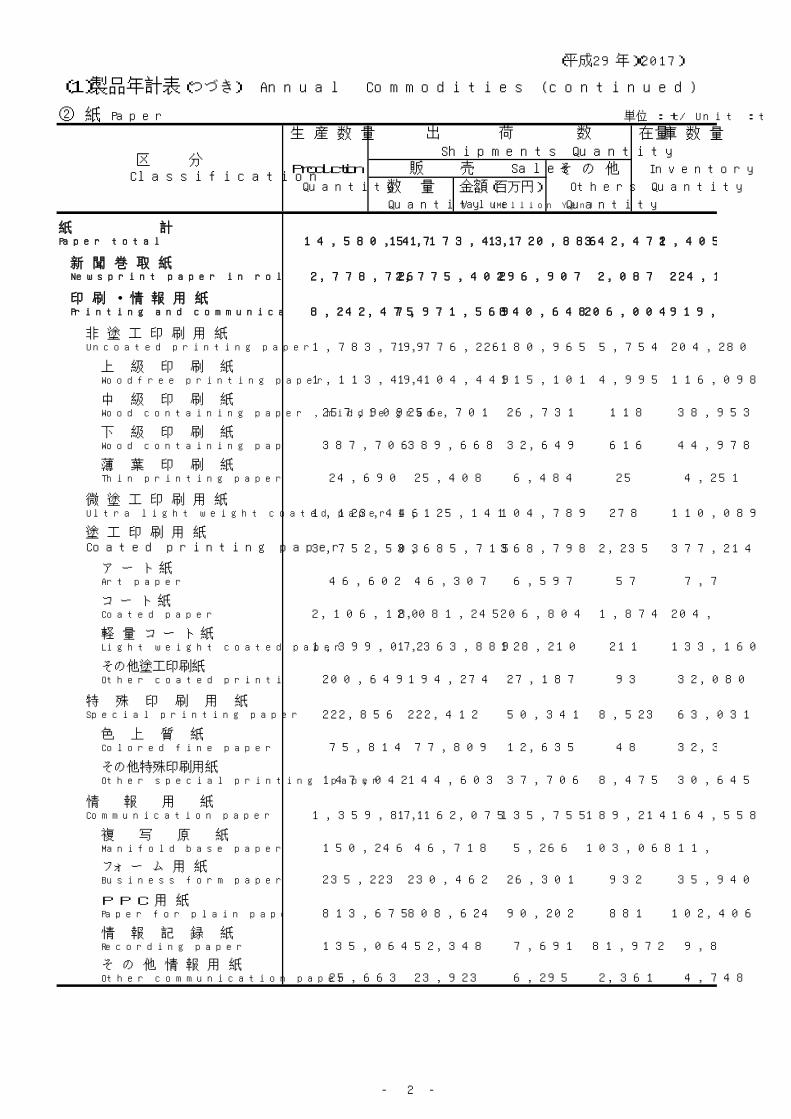
(平成29年) (2017)
(1)製品年計表(つづき) Annual Commodities (continued)
② 紙 Paper 単位 : t / Unit : t
生 産 数 量 在 庫 数 量Shipments Quantity
Production そ の 他 Inventory
Quantity 数 量 金額(百万円) Others Quantity
Quantity Value (Million Yen) Quantity
14,580,517 14,173,431 1,720,886 342,472 1,405,815
2,778,726 2,775,402 296,907 2,087 224,144
8,242,475 7,971,569 840,648 206,004 919,172
1,783,799 1,776,226 180,965 5,754 204,280
上 級 印 刷 紙Woodfree printing paper 1,113,494 1,104,449 115,101 4,995 116,098
中 級 印 刷 紙Wood containing paper , middle grade 257,909 256,701 26,731 118 38,953
下 級 印 刷 紙Wood containing paper , low grade 387,706 389,668 32,649 616 44,978
薄 葉 印 刷 紙Thin printing paper 24,690 25,408 6,484 25 4,251
1,123,446 1,125,141 104,789 278 110,089
3,752,503 3,685,715 368,798 2,235 377,214
ア ー ト 紙Art paper 46,602 46,307 6,597 57 7,766
コ ー ト 紙Coated paper 2,106,180 2,081,245 206,804 1,874 204,208
軽 量 コ ー ト 紙Light weight coated paper 1,399,072 1,363,889 128,210 211 133,160
その他塗工印刷紙Other coated printing paper 200,649 194,274 27,187 93 32,080
222,856 222,412 50,341 8,523 63,031
色 上 質 紙Colored fine paper 75,814 77,809 12,635 48 32,386
その他特殊印刷用紙Other special printing paper 147,042 144,603 37,706 8,475 30,645
1,359,871 1,162,075 135,755 189,214 164,558
複 写 原 紙Manifold base paper 150,246 46,718 5,266 103,068 11,634
フォ ー ム 用 紙Business form paper 235,223 230,462 26,301 932 35,940
P P C 用 紙Paper for plain paper copy 813,675 808,624 90,202 881 102,406
情 報 記 録 紙Recording paper 135,064 52,348 7,691 81,972 9,830
そ の 他 情 報 用 紙Other communication paper 25,663 23,923 6,295 2,361 4,748
特 殊 印 刷 用 紙Special printing paper
情 報 用 紙Communication paper
微 塗 工 印 刷 用 紙Ultra light weight coated paper
塗 工 印 刷 用 紙Coated printing paper
紙 計Paper total
新 聞 巻 取 紙Newsprint paper in rolls
印 刷 ・ 情 報 用 紙Printing and communication paper
非 塗 工 印 刷 用 紙Uncoated printing paper
区 分Classification
出 荷 数 量
販 売 Sales
- 3 -
(平成29年) (2017)
(1)製品年計表(つづき) Annual Commodities (continued)
② 紙(つづき) Paper (continued)
生 産 数 量 在 庫 数 量Shipments Quantity
Production そ の 他 Inventory
Quantity 数 量 金額(百万円) Others Quantity
Quantity Value (Million Yen) Quantity
896,348 888,949 95,859 2,316 106,939
594,132 589,017 57,882 1,280 67,130
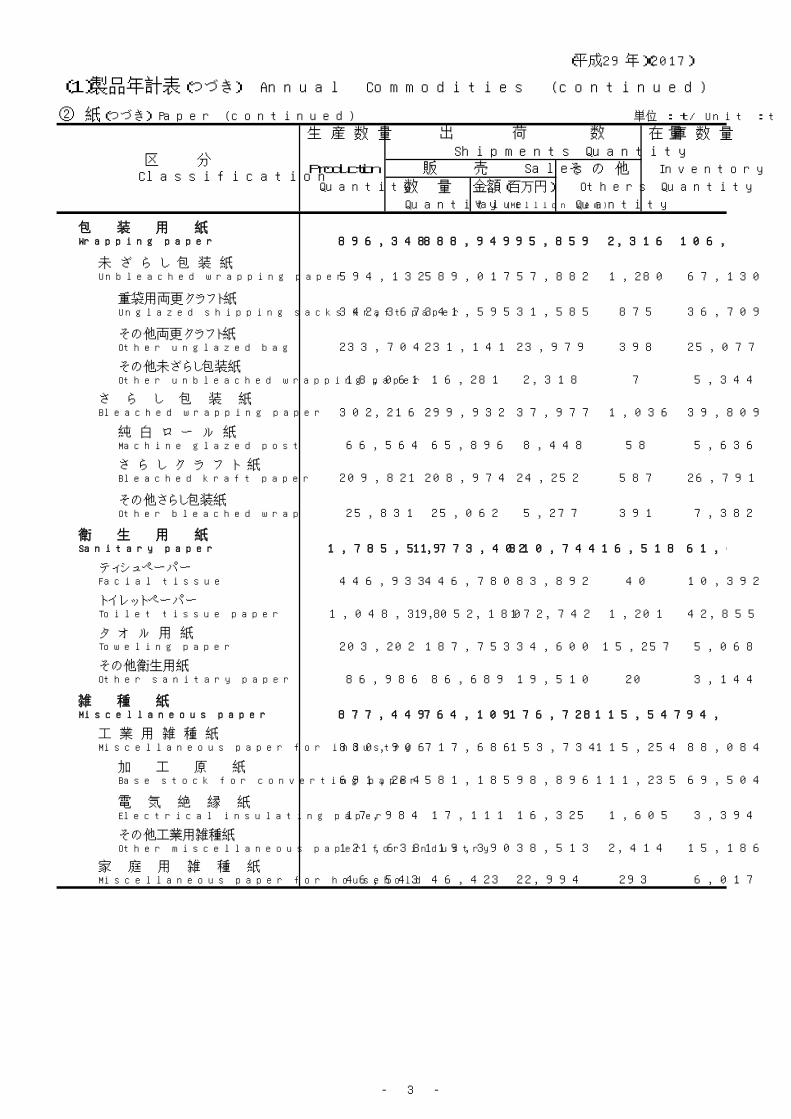
重袋用両更クラフト紙Unglazed shipping sacks kraft paper 342,367 341,595 31,585 875 36,709
その他両更クラフト紙Other unglazed bag paper 233,704 231,141 23,979 398 25,077
その他未ざらし包装紙Other unbleached wrapping paper 18,061 16,281 2,318 7 5,344
302,216 299,932 37,977 1,036 39,809
純 白 ロ ー ル 紙Machine glazed poster paper 66,564 65,896 8,448 58 5,636
さ ら し ク ラ フ ト 紙Bleached kraft paper 209,821 208,974 24,252 587 26,791
その他さらし包装紙Other bleached wrapping 25,831 25,062 5,277 391 7,382
1,785,519 1,773,402 310,744 16,518 61,459
446,933 446,780 83,892 40 10,392
1,048,398 1,052,180 172,742 1,201 42,855
203,202 187,753 34,600 15,257 5,068
86,986 86,689 19,510 20 3,144
877,449 764,109 176,728 115,547 94,101
830,906 717,686 153,734 115,254 88,084
加 工 原 紙Base stock for converting paper 691,284 581,185 98,896 111,235 69,504
電 気 絶 縁 紙Electrical insulating paper 17,984 17,111 16,325 1,605 3,394
その他工業用雑種紙Other miscellaneous paper for industry 121,638 119,390 38,513 2,414 15,186
46,543 46,423 22,994 293 6,017家 庭 用 雑 種 紙Miscellaneous paper for household
タ オ ル 用 紙Toweling paper
その他衛生用紙Other sanitary paper
雑 種 紙Miscellaneous paper
工 業 用 雑 種 紙Miscellaneous paper for industry
さ ら し 包 装 紙Bleached wrapping paper
衛 生 用 紙Sanitary paper
ティシュペーパーFacial tissue
トイレットペーパーToilet tissue paper
包 装 用 紙Wrapping paper
未 ざ ら し 包 装 紙Unbleached wrapping paper
単位 : t / Unit : t
区 分Classification
出 荷 数 量
販 売 Sales
- 4 -
(平成29年) (2017)
(1)製品年計表(つづき) Annual Commodities (continued)
③ 板 紙 Paperboard 単位 : t / Unit : t
生産数量 在庫数量
Production そ の 他 Inventory
Quantity 数 量 金額(百万円) Others Quantity
Quantity Value (Million Yen) Quantity
11,931,361 11,334,134 737,224 629,149 644,924
9,681,555 9,155,983 516,001 555,370 420,799
5,778,317 5,458,203 321,791 322,688 286,099
4,127,640 3,864,217 233,179 267,399 210,325
1,541,521 1,484,457 81,031 55,273 67,966
109,156 109,529 7,581 16 7,808
3,903,238 3,697,780 194,210 232,682 134,700
1,597,308 1,554,755 166,833 46,446 155,150
1,455,131 1,421,485 154,958 36,590 136,517
555,176 554,140 72,042 2,357 62,865
899,955 867,345 82,916 34,233 73,652
142,177 133,270 11,875 9,856 18,633
652,498 623,396 54,390 27,333 68,975
205,623 200,961 14,209 4,265 21,186
301,556 291,331 20,465 10,587 26,749
145,319 131,104 19,716 12,481 21,040そ の 他 板 紙Other paperboard
マ ニ ラ ボ ー ルManila board (Solid bleached board)
白 ボ ー ルWhite lined board
黄・チップ・色板紙Straw, Chip & Color board
雑 板 紙Miscellaneous paperboard
建 材 原 紙Building paperboard
紙 管 原 紙Tube and core paperboard
外 装 用 (クラフト)Kraft liner board
外 装 用 (ジュート)Jute liner board
内 装 用Jute liner board for interior
中 芯 原 紙Corrugating medium
紙 器 用 板 紙Paperboard for paper container
白 板 紙White board
区 分Classification
出荷数量 Shipments Quantity
販 売 Sales
板 紙 計Paperboard total
段 ボ ー ル 原 紙Container board
ラ イ ナーLiner board

- 5 -
(2017)
(1)製品年計表(つづき) Annual Commodities (continued)
④ 段ボール Corrugated cardboard
生産数量 受入数量 消費数量 在庫数量(次工程投入)
区 分 その他Classification Production Receipt Consumption Others Inventory
Quantity Quantity Quantity 数 量 金額(千円) Quantity QuantityQuantity Value (Thousand Yen)
段 ボ ー ル 計 Total
12,374,659 223,646 9,276,163 3,068,649 162,868,379 248,014 57,303
両 面 Corrugated fiber board
11,215,006 179,654 8,582,524 2,603,631 131,296,951 202,240 50,788
複両面 (複々両面を含む) Double wall corrugated
(including triple wall corrugated)
1,054,566 42,471 637,956 414,686 29,397,231 44,887 5,596
片 面 Single faced corrugated fiber board
105,087 1,521 55,683 50,332 2,174,197 887 919
段ボールの消費(次工程投入)部門別内訳と段ボール箱等の生産金額 Breakdown of Sector at Next Stage in Production process of Corrugated cardboard and value of Corrugated box
電気器具・ 薬品・洗剤合 計 機械器具用 ・化粧品用
消 費 数 量 For machinery For medicines, 計 加工食品 青 果 物 その他の(次工程投入) Grand Total electric detergents, Total (飲料を含む) 食料品
rear cosmetics For processed For fruit and For others
Consumption foods (including vegetable
Quantity drinks)
9,276,163 693,000 577,799 5,315,700 3,933,688 994,177 387,835
製箱用以外
Excepting boxes
繊維製品用 陶磁器・ガラス 通販・宅配 その他の 包装用以外 製品・雑貨用 ・引越用 製箱用 For ceramics, Excepting
glass products, For mail for wrapping For textiles general
merchandiseordersale,removal
For others paper
171,772 472,478 480,019 1,487,994 77,401
(千円)
Production value of
corrugated box, etc. (Thousand Yen)
628,675,026
単位:千m2/Unit:1000m2
製 箱 用For Boxes
食 料 品 用For foods
製 箱 用 (つづき) 段ボール箱等生産金額For Boxes (continued)
(平成29年)
単位:千m2/Unit:1000m2
出 荷 数 量Shipments Quantity
販 売Sales
- 6 -
(1)製品年計表(つづき) Annual Commodities (continued)
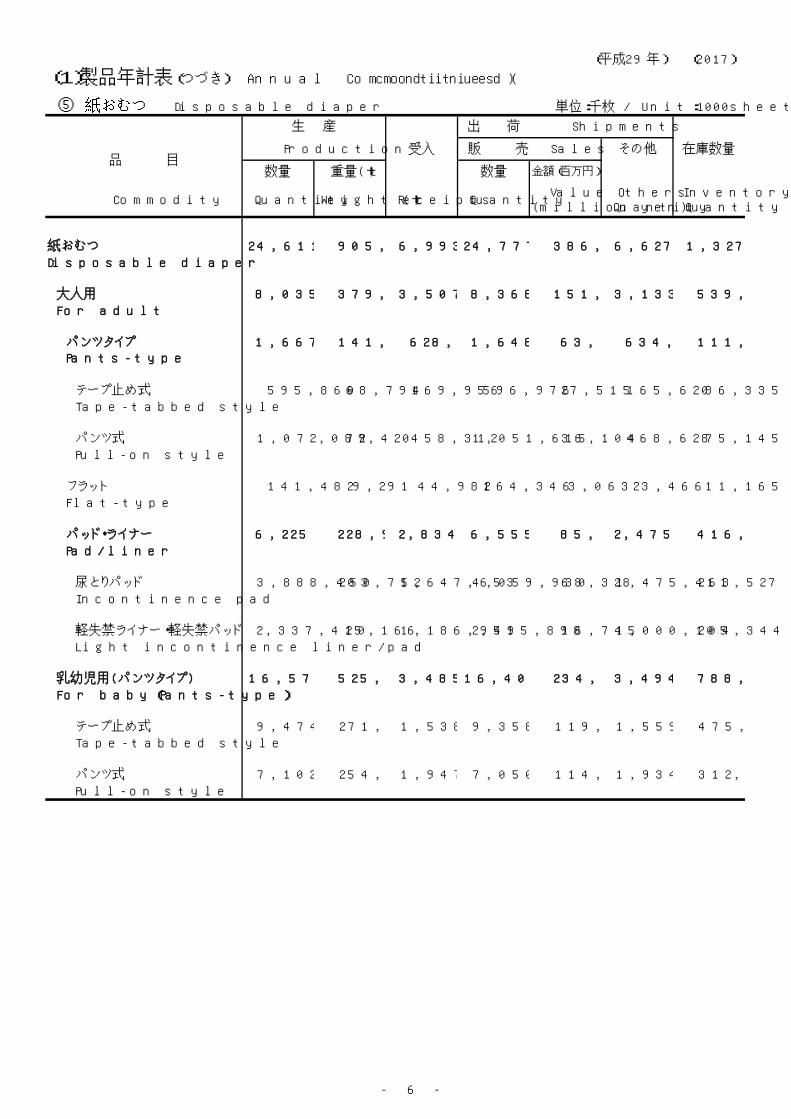
⑤ 紙おむつ Disposable diaper 単位:千枚 / Unit:1000sheets
Disposable diaper
大人用
For adult
パンツタイプ
テープ止め式
Tape-tabbed style
パンツ式
Pull-on style
フラット
Flat-type
パッド・ライナー
Pad/liner
尿とりパッド
Incontinence pad
軽失禁ライナー・軽失禁パッド
Light incontinence liner/pad
乳幼児用(パンツタイプ)
For baby(Pants-type)
テープ止め式
Tape-tabbed style
パンツ式
Pull-on style
475,382
7,102,322 254,328 1,947,214 7,050,047 114,362 1,934,707 312,647
9,474,373 271,472 1,538,694 9,358,620 119,910 1,559,878
205,344
16,576,695 525,800 3,485,908 16,408,667 234,272 3,494,585 788,029
2,337,410 25,166 1,186,951 2,495,898 16,745 1,000,104
416,871
3,888,450 203,752 1,647,653 4,059,930 68,328 1,475,463 211,527
6,225,860 228,918 2,834,604 6,555,828 85,073 2,475,567
75,145
141,482 9,291 44,982 164,346 3,063 23,466 11,165
1,072,089 72,420 458,312 1,051,615 36,104 468,628
111,480Pants-type
595,860 68,794 169,956 596,976 27,515 165,620 36,335
1,667,949 141,214 628,268 1,648,591 63,619 634,248
6,627,866 1,327,545
8,035,291 379,423 3,507,854 8,368,765 151,755 3,133,281 539,516
紙おむつ 24,611,986 905,223 6,993,762 24,777,432 386,027
OthersQuantity
InventoryQuantity
Commodity Quantity Weight (t) Receipts QuantityValue
(million yen)
在庫数量
数量 重量(t) 数量 金額(百万円)品 目
Production 受入 販 売 Sales その他
(平成29年) (2017)
生 産 出 荷 Shipments
- 7 -
(2)製品時系列表 Historical Data by Commodity
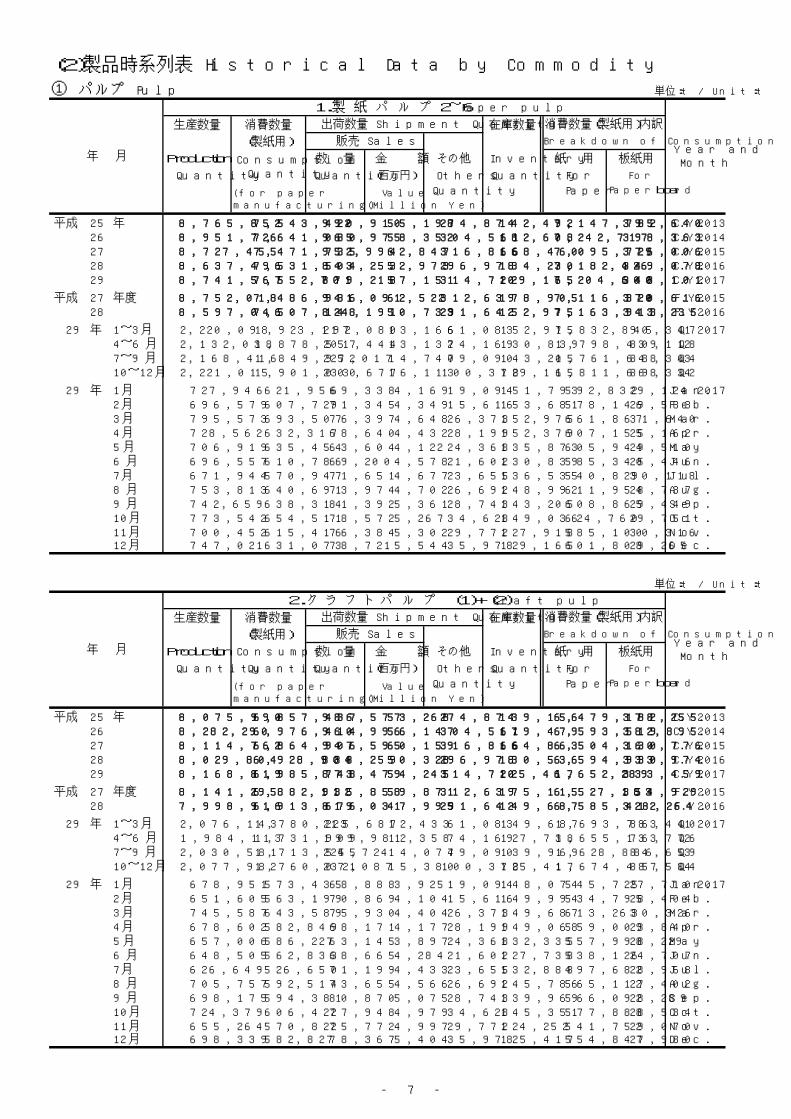
① パルプ Pulp 単位:t / Unit:t
生産数量 消費数量 在庫数量
(製紙用)
Production Consumption 数 量 金 額 その他 Inventory 紙 用 板紙用
Quantity Quantity Quantity (百万円) Others Quantity For For
(for papermanufacturing)
Value(Million Yen)
Quantity Paper Paperboard
平成 25 年 8,765,852 7,543,422 990,910 55,198 274,874 142,492 7,147,782 395,640 C.Y. 201326 8,951,726 7,641,080 965,975 58,352 304,561 182,608 7,242,717 398,363 C.Y. 201427 8,727,455 7,471,735 952,994 62,847 316,866 168,460 7,095,729 376,006 C.Y. 201528 8,637,496 7,531,504 843,253 52,973 296,978 134,230 7,182,426 349,078 C.Y. 201629 8,741,567 7,552,701 879,218 57,151 314,720 129,165 7,204,600 348,101 C.Y. 2017
平成 27 年度 8,752,018 7,486,936 941,091 62,522 312,639 178,905 7,116,320 370,616 F.Y. 201528 8,597,046 7,507,148 824,191 50,733 291,642 152,975 7,163,913 343,235 F.Y. 2016
29 年 1~3月 2,220,098 1,923,192 217,080 13,166 61,083 152,975 1,832,845 90,347 Q1 20174~6月 2,132,038 1,878,557 201,444 13,132 74,169 130,839 1,798,439 80,118 Q27~9月 2,168,416 1,849,952 227,017 14,740 79,090 143,205 1,761,648 88,304 Q310~12月 2,221,015 1,901,000 233,677 16,113 100,378 129,165 1,811,668 89,332 Q4
29 年 1月 727,946 621,956 69,338 4,169 19,094 151,793 592,832 29,124 Jan. 20172月 696,579 607,729 71,345 4,349 15,616 153,681 578,146 29,583 Feb.3月 795,573 693,507 76,397 4,648 26,373 152,975 661,867 31,640 Mar.4月 728,562 632,317 68,640 4,432 28,199 152,379 607,155 25,162 Apr.5月 706,919 635,454 63,604 4,122 24,368 135,873 605,944 29,510 May 6月 696,557 610,786 69,200 4,578 21,602 130,839 585,340 25,446 Jun.7月 671,944 570,947 71,651 4,677 23,655 136,535 540,829 30,118 Jul.8月 753,813 640,691 73,974 4,702 26,692 148,992 611,954 28,737 Aug.9月 742,659 638,314 81,392 5,361 28,743 143,205 608,865 29,449 Sep.10月 773,542 654,511 78,572 5,267 34,628 149,036 624,760 29,751 Oct.11月 700,452 615,416 76,384 5,302 29,772 127,918 585,100 30,316 Nov.12月 747,021 631,073 78,721 5,544 35,978 129,165 601,808 29,265 Dec.
単位:t / Unit:t
生産数量 消費数量 在庫数量
(製紙用)
Production Consumption 数 量 金 額 その他 Inventory 紙 用 板紙用
Quantity Quantity Quantity (百万円) Others Quantity For For
(for papermanufacturing)
Value(Million Yen)
Quantity Paper Paperboard
平成 25 年 8,075,990 6,857,437 986,577 53,268 274,874 139,156 6,479,182 378,255 C.Y. 201326 8,282,290 6,976,414 960,996 56,147 304,561 179,479 6,593,519 382,895 C.Y. 201427 8,114,762 6,864,906 947,595 60,159 316,866 164,863 6,504,130 360,776 C.Y. 201528 8,029,804 6,928,904 838,259 50,328 296,978 130,536 6,594,930 333,974 C.Y. 201629 8,168,819 6,985,748 873,479 54,245 314,720 125,417 6,652,289 333,459 C.Y. 2017
平成 27 年度 8,141,295 6,882,112 935,858 59,871 312,639 175,115 6,527,183 354,929 F.Y. 201528 7,998,916 6,913,676 819,031 47,995 291,642 149,687 6,585,412 328,264 F.Y. 2016
29 年 1~3月 2,076,143 1,780,223 215,687 12,433 61,083 149,687 1,693,783 86,440 Q1 20174~6月 1,984,113 1,731,909 199,981 12,358 74,169 127,738 1,655,133 76,776 Q27~9月 2,030,581 1,713,545 225,724 14,074 79,090 139,969 1,628,886 84,659 Q310~12月 2,077,982 1,760,071 232,087 15,380 100,378 125,417 1,674,487 85,584 Q4
29 年 1月 678,951 573,435 68,888 3,925 19,094 148,074 545,725 27,710 Jan. 20172月 651,605 563,199 70,869 4,104 15,616 149,994 534,795 28,404 Feb.3月 745,587 643,589 75,930 4,404 26,373 149,687 613,263 30,326 Mar.4月 678,602 582,849 68,171 4,177 28,199 149,068 559,009 23,840 Apr.5月 657,006 586,227 63,145 3,897 24,368 132,335 557,998 28,229 May 6月 648,505 562,833 68,665 4,284 21,602 127,738 538,126 24,707 Jun.7月 626,649 526,650 71,199 4,433 23,655 132,888 497,682 28,968 Jul.8月 705,757 592,514 73,655 4,566 26,692 145,786 565,112 27,402 Aug.9月 698,175 594,381 80,870 5,075 28,743 139,969 566,092 28,289 Sep.10月 724,379 606,422 77,948 4,979 34,628 145,351 577,888 28,534 Oct.11月 655,264 570,822 75,772 4,997 29,772 124,252 541,752 29,070 Nov.12月 698,339 582,827 78,367 5,404 35,978 125,417 554,847 27,980 Dec.
販売 Sales Breakdown of Consumption
出荷数量 Shipment Quantity 消費数量(製紙用)内訳
年 月
2.ク ラ フ ト パ ル プ (1)+(2) Kraft pulp
Year andMonth
販売 Sales Breakdown of Consumption
出荷数量 Shipment Quantity 消費数量(製紙用)内訳
年 月
1.製 紙 パ ル プ 2~6 Paper pulp
Year andMonth
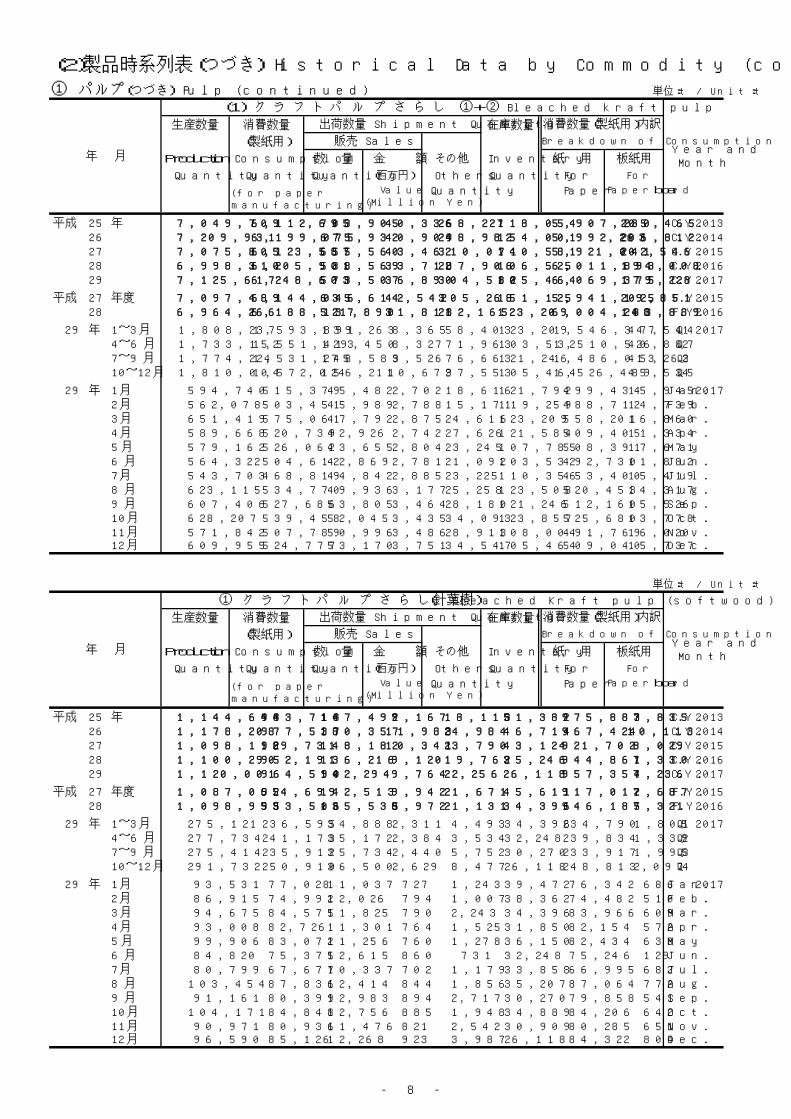
- 8 -
(2)製品時系列表(つづき) Historical Data by Commodity (continued)
① パルプ(つづき) Pulp (continued) 単位:t / Unit:t
生産数量 消費数量 在庫数量
(製紙用)
Production Consumption 数 量 金 額 その他 Inventory 紙 用 板紙用
Quantity Quantity Quantity (百万円) Others Quantity For For
(for papermanufacturing)
Value(Million Yen)
Quantity Paper Paperboard
平成 25 年 7,049,709 6,112,695 703,905 40,336 268,227 118,054 5,907,230 205,465 C.Y. 201326 7,209,931 6,199,075 675,932 40,904 298,982 154,001 5,992,263 206,812 C.Y. 201427 7,075,805 6,123,587 655,560 43,462 310,071 140,581 5,921,041 202,546 C.Y. 201528 6,998,310 6,205,901 538,569 33,712 287,906 106,525 6,011,893 194,008 C.Y. 201629 7,125,617 6,248,603 573,507 36,890 304,582 105,464 6,069,375 179,228 C.Y. 2017
平成 27 年度 7,097,489 6,144,046 635,614 42,542 305,268 151,125 5,941,195 202,851 F.Y. 201528 6,964,266 6,188,137 521,890 31,811 282,165 123,209 6,004,248 183,889 F.Y. 2016
29 年 1~3月 1,808,237 1,593,891 139,263 8,365 58,403 123,209 1,546,347 47,544 Q1 20174~6月 1,733,152 1,551,413 129,450 8,327 71,963 103,532 1,510,526 40,887 Q27~9月 1,774,224 1,531,275 148,583 9,526 76,663 121,246 1,486,013 45,262 Q310~12月 1,810,004 1,572,024 156,211 10,672 97,553 105,464 1,526,489 45,535 Q4
29 年 1月 594,740 515,379 45,482 2,702 18,616 121,792 499,434 15,945 Jan. 20172月 562,078 503,451 45,989 2,788 15,171 119,259 488,712 14,739 Feb.3月 651,419 575,061 47,792 2,875 24,616 123,209 558,201 16,860 Mar.4月 589,668 520,739 42,926 2,742 27,626 121,584 509,405 11,334 Apr.5月 579,162 526,062 43,655 2,804 23,245 107,785 508,391 17,671 May 6月 564,322 504,612 42,869 2,781 21,092 103,532 492,730 11,882 Jun.7月 543,703 468,819 44,842 2,885 23,225 110,356 453,400 15,419 Jul.8月 623,115 534,770 49,936 3,177 25,258 123,508 520,453 14,317 Aug.9月 607,406 527,686 53,805 3,464 28,180 121,246 512,160 15,526 Sep.10月 628,207 539,458 52,045 3,435 34,093 123,857 525,680 13,778 Oct.11月 571,842 507,789 50,996 3,486 28,913 108,004 491,769 16,020 Nov.12月 609,955 524,777 53,170 3,751 34,547 105,464 509,040 15,737 Dec.
単位:t / Unit:t
生産数量 消費数量 在庫数量
(製紙用)
Production Consumption 数 量 金 額 その他 Inventory 紙 用 板紙用
Quantity Quantity Quantity (百万円) Others Quantity For For
(for papermanufacturing)
Value(Million Yen)
Quantity Paper Paperboard
平成 25 年 1,144,644 983,718 147,492 9,167 18,113 51,382 975,883 7,835 C.Y. 201326 1,178,208 977,537 180,357 11,983 24,984 46,714 967,424 10,113 C.Y. 201427 1,098,118 929,731 148,182 10,341 23,790 43,124 921,702 8,029 C.Y. 201528 1,100,290 952,191 136,216 9,120 19,762 35,246 944,861 7,330 C.Y. 201629 1,120,001 964,590 142,294 9,764 22,256 26,118 957,354 7,236 C.Y. 2017
平成 27 年度 1,087,065 924,699 142,513 9,942 21,671 45,611 917,012 7,687 F.Y. 201528 1,098,953 953,506 135,535 8,972 21,131 34,396 946,185 7,321 F.Y. 2016
29 年 1~3月 275,121 236,595 34,888 2,311 4,493 34,396 234,790 1,805 Q1 20174~6月 277,734 241,173 35,172 2,384 3,534 32,248 239,834 1,339 Q27~9月 275,414 235,912 35,734 2,440 5,752 30,270 233,917 1,995 Q310~12月 291,732 250,910 36,500 2,629 8,477 26,118 248,813 2,097 Q4
29 年 1月 93,531 77,028 11,037 727 1,243 39,472 76,342 686 Jan. 20172月 86,915 74,992 12,026 794 1,007 38,362 74,482 510 Feb.3月 94,675 84,575 11,825 790 2,243 34,396 83,966 609 Mar.4月 93,008 82,726 11,301 764 1,525 31,850 82,154 572 Apr.5月 99,906 83,072 11,256 760 1,278 36,150 82,434 638 May 6月 84,820 75,375 12,615 860 731 32,248 75,246 129 Jun.7月 80,799 67,677 10,337 702 1,179 33,858 66,995 682 Jul.8月 103,454 87,836 12,414 844 1,856 35,207 87,064 772 Aug.9月 91,161 80,399 12,983 894 2,717 30,270 79,858 541 Sep.10月 104,171 84,848 12,756 885 1,948 34,889 84,206 642 Oct.11月 90,971 80,936 11,476 821 2,542 30,909 80,285 651 Nov.12月 96,590 85,126 12,268 923 3,987 26,118 84,322 804 Dec.
販売 Sales Breakdown of Consumption
出荷数量 Shipment Quantity 消費数量(製紙用)内訳
年 月
① ク ラ フ ト パ ル プ さ ら し(針葉樹) Bleached Kraft pulp (softwood)
Year andMonth
販売 Sales Breakdown of Consumption
出荷数量 Shipment Quantity 消費数量(製紙用)内訳
年 月
(1) ク ラ フ ト パ ル プ さ ら し ①+② Bleached kraft pulp
Year andMonth
- 9 -
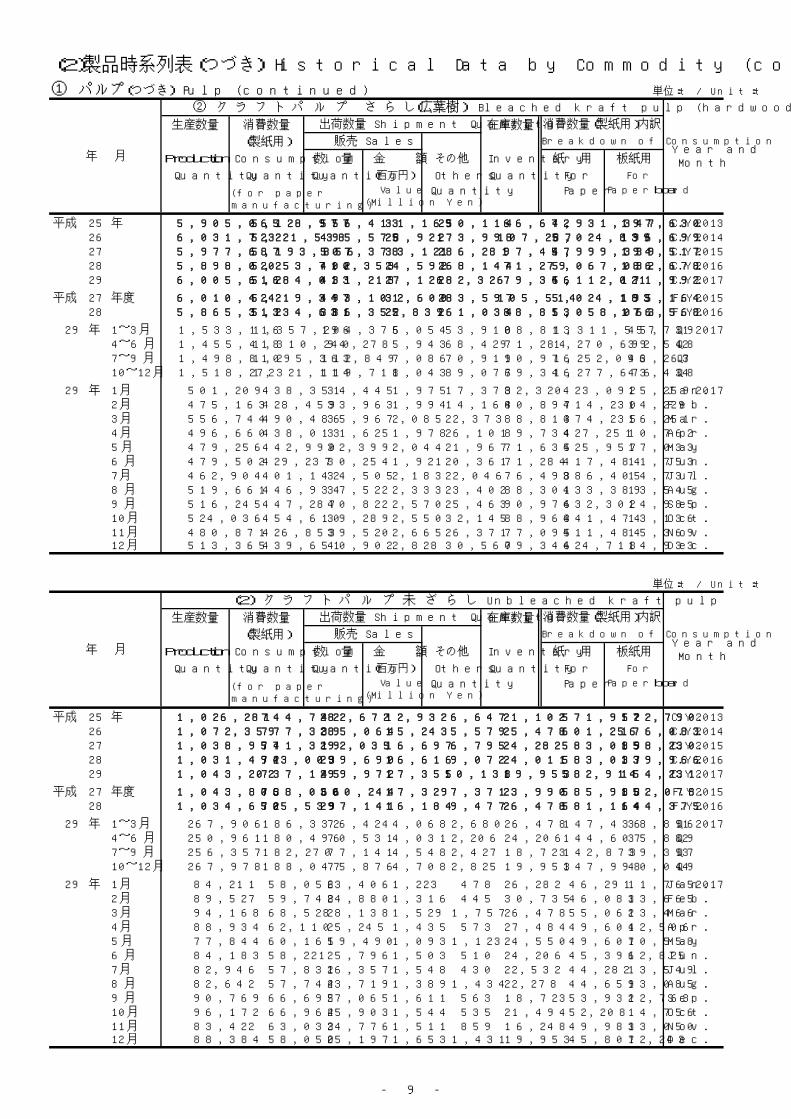
(2)製品時系列表(つづき) Historical Data by Commodity (continued)
① パルプ(つづき) Pulp (continued) 単位:t / Unit:t
生産数量 消費数量 在庫数量
(製紙用)
Production Consumption 数 量 金 額 その他 Inventory 紙 用 板紙用
Quantity Quantity Quantity (百万円) Others Quantity For For
(for papermanufacturing)
Value(Million Yen)
Quantity Paper Paperboard
平成 25 年 5,905,065 5,128,977 556,413 31,169 250,114 66,672 4,931,347 197,630 C.Y. 201326 6,031,723 5,221,538 495,575 28,921 273,998 107,287 5,024,839 196,699 C.Y. 201427 5,977,687 5,193,856 507,378 33,121 286,281 97,457 4,999,339 194,517 C.Y. 201528 5,898,020 5,253,710 402,353 24,592 268,144 71,279 5,067,032 186,678 C.Y. 201629 6,005,616 5,284,013 431,213 27,126 282,326 79,346 5,112,021 171,992 C.Y. 2017
平成 27 年度 6,010,424 5,219,347 493,101 32,600 283,597 105,514 5,024,183 195,164 F.Y. 201528 5,865,313 5,234,631 386,355 22,839 261,034 88,813 5,058,063 176,568 F.Y. 2016
29 年 1~3月 1,533,116 1,357,296 104,375 6,054 53,910 88,813 1,311,557 45,739 Q1 20174~6月 1,455,418 1,310,240 94,278 5,943 68,429 71,284 1,270,692 39,548 Q27~9月 1,498,810 1,295,363 112,849 7,086 70,911 90,976 1,252,096 43,267 Q310~12月 1,518,272 1,321,114 119,711 8,043 89,076 79,346 1,277,676 43,438 Q4
29 年 1月 501,209 438,351 34,445 1,975 17,373 82,320 423,092 15,259 Jan. 20172月 475,163 428,459 33,963 1,994 14,164 80,897 414,230 14,229 Feb.3月 556,744 490,486 35,967 2,085 22,373 88,813 474,235 16,251 Mar.4月 496,660 438,013 31,625 1,978 26,101 89,734 427,251 10,762 Apr.5月 479,256 442,990 32,399 2,044 21,967 71,635 425,957 17,033 May 6月 479,502 429,237 30,254 1,921 20,361 71,284 417,484 11,753 Jun.7月 462,904 401,142 34,505 2,183 22,046 76,498 386,405 14,737 Jul.8月 519,661 446,934 37,522 2,333 23,402 88,301 433,389 13,545 Aug.9月 516,245 447,287 40,822 2,570 25,463 90,976 432,302 14,985 Sep.10月 524,036 454,610 39,289 2,550 32,145 88,968 441,474 13,136 Oct.11月 480,871 426,853 39,520 2,665 26,371 77,095 411,484 15,369 Nov.12月 513,365 439,651 40,902 2,828 30,560 79,346 424,718 14,933 Dec.
単位:t / Unit:t
生産数量 消費数量 在庫数量
(製紙用)
Production Consumption 数 量 金 額 その他 Inventory 紙 用 板紙用
Quantity Quantity Quantity (百万円) Others Quantity For For
(for papermanufacturing)
Value(Million Yen)
Quantity Paper Paperboard
平成 25 年 1,026,281 744,742 282,672 12,932 6,647 21,102 571,952 172,790 C.Y. 201326 1,072,359 777,339 285,064 15,243 5,579 25,478 601,256 176,083 C.Y. 201427 1,038,957 741,319 292,035 16,697 6,795 24,282 583,089 158,230 C.Y. 201528 1,031,494 723,003 299,690 16,616 9,072 24,011 583,037 139,966 C.Y. 201629 1,043,202 737,145 299,972 17,355 10,138 19,953 582,914 154,231 C.Y. 2017
平成 27 年度 1,043,806 738,066 300,244 17,329 7,371 23,990 585,988 152,078 F.Y. 201528 1,034,650 725,539 297,141 16,184 9,477 26,478 581,164 144,375 F.Y. 2016
29 年 1~3月 267,906 186,332 76,424 4,068 2,680 26,478 147,436 38,896 Q1 20174~6月 250,961 180,496 70,531 4,031 2,206 24,206 144,607 35,889 Q27~9月 256,357 182,270 77,141 4,548 2,427 18,723 142,873 39,397 Q310~12月 267,978 188,047 75,876 4,708 2,825 19,953 147,998 40,049 Q4
29 年 1月 84,211 58,056 23,406 1,223 478 26,282 46,291 11,765 Jan. 20172月 89,527 59,748 24,880 1,316 445 30,735 46,083 13,665 Feb.3月 94,168 68,528 28,138 1,529 1,757 26,478 55,062 13,466 Mar.4月 88,934 62,110 25,245 1,435 573 27,484 49,604 12,506 Apr.5月 77,844 60,165 19,490 1,093 1,123 24,550 49,607 10,558 May 6月 84,183 58,221 25,796 1,503 510 24,206 45,396 12,825 Jun.7月 82,946 57,831 26,357 1,548 430 22,532 44,282 13,549 Jul.8月 82,642 57,744 23,719 1,389 1,434 22,278 44,659 13,085 Aug.9月 90,769 66,695 27,065 1,611 563 18,723 53,932 12,763 Sep.10月 96,172 66,964 25,903 1,544 535 21,494 52,208 14,756 Oct.11月 83,422 63,033 24,776 1,511 859 16,248 49,983 13,050 Nov.12月 88,384 58,050 25,197 1,653 1,431 19,953 45,807 12,243 Dec.
Year andMonth
販売 Sales Breakdown of Consumption
出荷数量 Shipment Quantity 消費数量(製紙用)内訳
年 月
(2) ク ラ フ ト パ ル プ 未 ざ ら し Unbleached kraft pulp
販売 Sales Breakdown of Consumption
出荷数量 Shipment Quantity 消費数量(製紙用)内訳
年 月
② ク ラ フ ト パ ル プ さ ら し(広葉樹) Bleached kraft pulp (hardwood)
Year andMonth
- 10 -
(2)製品時系列表(つづき) Historical Data by Commodity (continued)
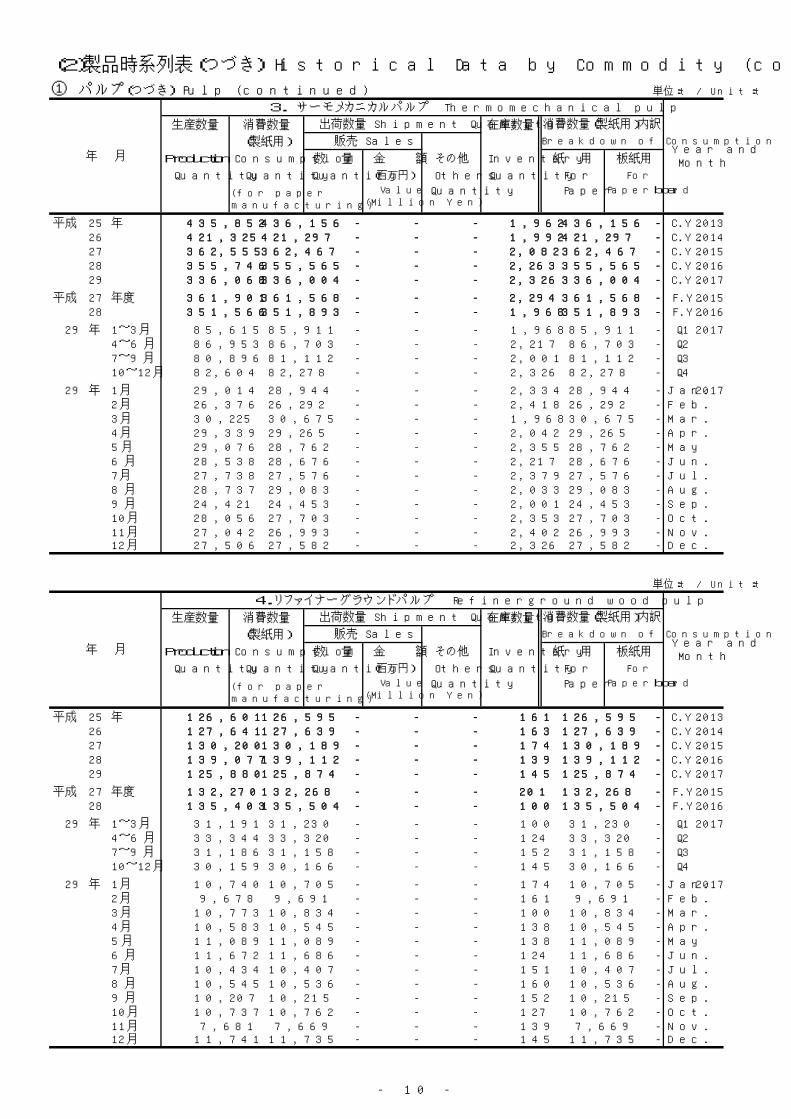
① パルプ(つづき) Pulp (continued) 単位:t / Unit:t
生産数量 消費数量 在庫数量
(製紙用)
Production Consumption 数 量 金 額 その他 Inventory 紙 用 板紙用
Quantity Quantity Quantity (百万円) Others Quantity For For
(for papermanufacturing)
Value(Million Yen)
Quantity Paper Paperboard
平成 25 年 435,852 436,156 - - - 1,962 436,156 - C.Y. 201326 421,325 421,297 - - - 1,992 421,297 - C.Y. 201427 362,555 362,467 - - - 2,082 362,467 - C.Y. 201528 355,746 355,565 - - - 2,263 355,565 - C.Y. 201629 336,068 336,004 - - - 2,326 336,004 - C.Y. 2017
平成 27 年度 361,901 361,568 - - - 2,294 361,568 - F.Y. 201528 351,566 351,893 - - - 1,968 351,893 - F.Y. 2016
29 年 1~3月 85,615 85,911 - - - 1,968 85,911 - Q1 20174~6月 86,953 86,703 - - - 2,217 86,703 - Q27~9月 80,896 81,112 - - - 2,001 81,112 - Q310~12月 82,604 82,278 - - - 2,326 82,278 - Q4
29 年 1月 29,014 28,944 - - - 2,334 28,944 - Jan. 20172月 26,376 26,292 - - - 2,418 26,292 - Feb.3月 30,225 30,675 - - - 1,968 30,675 - Mar.4月 29,339 29,265 - - - 2,042 29,265 - Apr.5月 29,076 28,762 - - - 2,355 28,762 - May 6月 28,538 28,676 - - - 2,217 28,676 - Jun.7月 27,738 27,576 - - - 2,379 27,576 - Jul.8月 28,737 29,083 - - - 2,033 29,083 - Aug.9月 24,421 24,453 - - - 2,001 24,453 - Sep.10月 28,056 27,703 - - - 2,353 27,703 - Oct.11月 27,042 26,993 - - - 2,402 26,993 - Nov.12月 27,506 27,582 - - - 2,326 27,582 - Dec.
単位:t / Unit:t
生産数量 消費数量 在庫数量
(製紙用)
Production Consumption 数 量 金 額 その他 Inventory 紙 用 板紙用
Quantity Quantity Quantity (百万円) Others Quantity For For
(for papermanufacturing)
Value(Million Yen)
Quantity Paper Paperboard
平成 25 年 126,601 126,595 - - - 161 126,595 - C.Y. 201326 127,641 127,639 - - - 163 127,639 - C.Y. 201427 130,200 130,189 - - - 174 130,189 - C.Y. 201528 139,077 139,112 - - - 139 139,112 - C.Y. 201629 125,880 125,874 - - - 145 125,874 - C.Y. 2017
平成 27 年度 132,270 132,268 - - - 201 132,268 - F.Y. 201528 135,403 135,504 - - - 100 135,504 - F.Y. 2016
29 年 1~3月 31,191 31,230 - - - 100 31,230 - Q1 20174~6月 33,344 33,320 - - - 124 33,320 - Q27~9月 31,186 31,158 - - - 152 31,158 - Q310~12月 30,159 30,166 - - - 145 30,166 - Q4
29 年 1月 10,740 10,705 - - - 174 10,705 - Jan. 20172月 9,678 9,691 - - - 161 9,691 - Feb.3月 10,773 10,834 - - - 100 10,834 - Mar.4月 10,583 10,545 - - - 138 10,545 - Apr.5月 11,089 11,089 - - - 138 11,089 - May 6月 11,672 11,686 - - - 124 11,686 - Jun.7月 10,434 10,407 - - - 151 10,407 - Jul.8月 10,545 10,536 - - - 160 10,536 - Aug.9月 10,207 10,215 - - - 152 10,215 - Sep.10月 10,737 10,762 - - - 127 10,762 - Oct.11月 7,681 7,669 - - - 139 7,669 - Nov.12月 11,741 11,735 - - - 145 11,735 - Dec.
年 月
4.リファイナーグラウンドパルプ Refinerground wood pulp
出荷数量 Shipment Quantity 消費数量(製紙用)内訳
Year andMonth
販売 Sales Breakdown of Consumption
販売 Sales Breakdown of Consumption
出荷数量 Shipment Quantity
年 月
3. サーモメカニカルパルプ Thermomechanical pulp
Year andMonth
消費数量(製紙用)内訳
- 11 -
(2)製品時系列表(つづき) Historical Data by Commodity (continued)
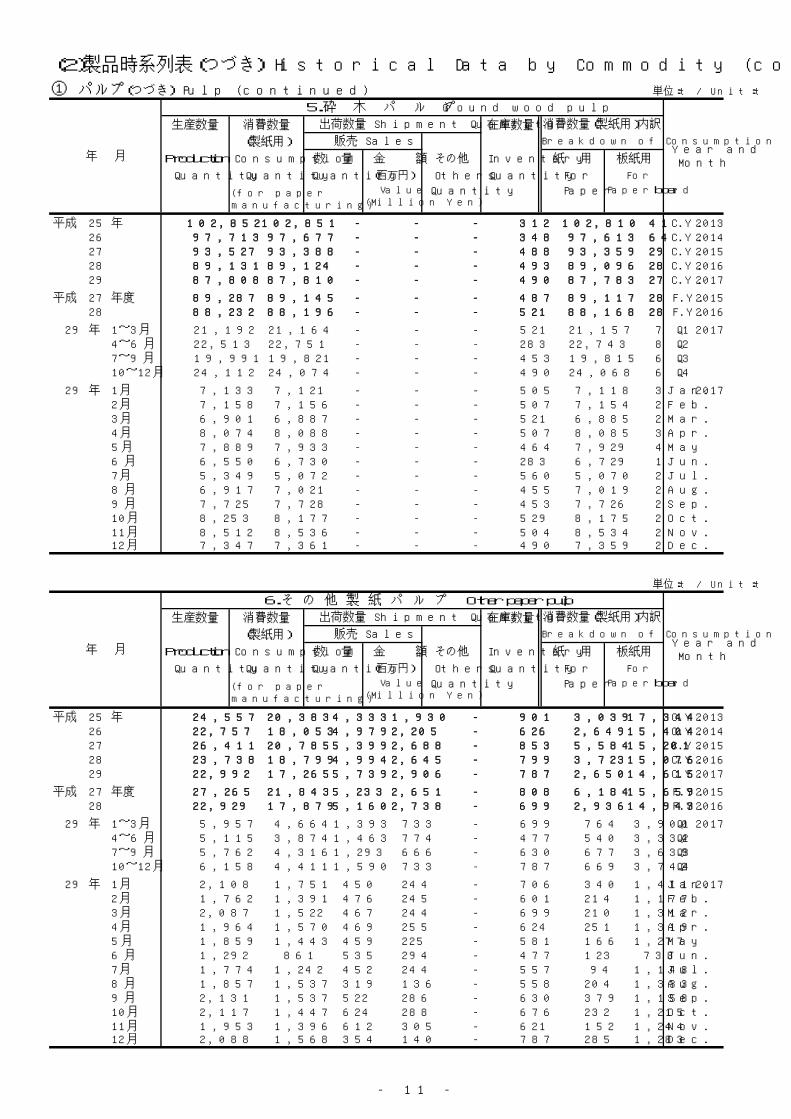
① パルプ(つづき) Pulp (continued) 単位:t / Unit:t
生産数量 消費数量 在庫数量
(製紙用)
Production Consumption 数 量 金 額 その他 Inventory 紙 用 板紙用
Quantity Quantity Quantity (百万円) Others Quantity For For
(for papermanufacturing)
Value(Million Yen)
Quantity Paper Paperboard
平成 25 年 102,852 102,851 - - - 312 102,810 41 C.Y. 201326 97,713 97,677 - - - 348 97,613 64 C.Y. 201427 93,527 93,388 - - - 488 93,359 29 C.Y. 201528 89,131 89,124 - - - 493 89,096 28 C.Y. 201629 87,808 87,810 - - - 490 87,783 27 C.Y. 2017
平成 27 年度 89,287 89,145 - - - 487 89,117 28 F.Y. 201528 88,232 88,196 - - - 521 88,168 28 F.Y. 2016
29 年 1~3月 21,192 21,164 - - - 521 21,157 7 Q1 20174~6月 22,513 22,751 - - - 283 22,743 8 Q27~9月 19,991 19,821 - - - 453 19,815 6 Q310~12月 24,112 24,074 - - - 490 24,068 6 Q4
29 年 1月 7,133 7,121 - - - 505 7,118 3 Jan. 20172月 7,158 7,156 - - - 507 7,154 2 Feb.3月 6,901 6,887 - - - 521 6,885 2 Mar.4月 8,074 8,088 - - - 507 8,085 3 Apr.5月 7,889 7,933 - - - 464 7,929 4 May 6月 6,550 6,730 - - - 283 6,729 1 Jun.7月 5,349 5,072 - - - 560 5,070 2 Jul.8月 6,917 7,021 - - - 455 7,019 2 Aug.9月 7,725 7,728 - - - 453 7,726 2 Sep.10月 8,253 8,177 - - - 529 8,175 2 Oct.11月 8,512 8,536 - - - 504 8,534 2 Nov.12月 7,347 7,361 - - - 490 7,359 2 Dec.
単位:t / Unit:t
生産数量 消費数量 在庫数量
(製紙用)
Production Consumption 数 量 金 額 その他 Inventory 紙 用 板紙用
Quantity Quantity Quantity (百万円) Others Quantity For For
(for papermanufacturing)
Value(Million Yen)
Quantity Paper Paperboard
平成 25 年 24,557 20,383 4,333 1,930 - 901 3,039 17,344 C.Y. 201326 22,757 18,053 4,979 2,205 - 626 2,649 15,404 C.Y. 201427 26,411 20,785 5,399 2,688 - 853 5,584 15,201 C.Y. 201528 23,738 18,799 4,994 2,645 - 799 3,723 15,076 C.Y. 201629 22,992 17,265 5,739 2,906 - 787 2,650 14,615 C.Y. 2017
平成 27 年度 27,265 21,843 5,233 2,651 - 808 6,184 15,659 F.Y. 201528 22,929 17,879 5,160 2,738 - 699 2,936 14,943 F.Y. 2016
29 年 1~3月 5,957 4,664 1,393 733 - 699 764 3,900 Q1 20174~6月 5,115 3,874 1,463 774 - 477 540 3,334 Q27~9月 5,762 4,316 1,293 666 - 630 677 3,639 Q310~12月 6,158 4,411 1,590 733 - 787 669 3,742 Q4
29 年 1月 2,108 1,751 450 244 - 706 340 1,411 Jan. 20172月 1,762 1,391 476 245 - 601 214 1,177 Feb.3月 2,087 1,522 467 244 - 699 210 1,312 Mar.4月 1,964 1,570 469 255 - 624 251 1,319 Apr.5月 1,859 1,443 459 225 - 581 166 1,277 May 6月 1,292 861 535 294 - 477 123 738 Jun.7月 1,774 1,242 452 244 - 557 94 1,148 Jul.8月 1,857 1,537 319 136 - 558 204 1,333 Aug.9月 2,131 1,537 522 286 - 630 379 1,158 Sep.10月 2,117 1,447 624 288 - 676 232 1,215 Oct.11月 1,953 1,396 612 305 - 621 152 1,244 Nov.12月 2,088 1,568 354 140 - 787 285 1,283 Dec.
Year andMonth
出荷数量 Shipment Quantity
年 月
6.そ の 他 製 紙 パ ル プ Other paper pulp
消費数量(製紙用)内訳
販売 Sales Breakdown of Consumption
販売 Sales Breakdown of Consumption
出荷数量 Shipment Quantity 消費数量(製紙用)内訳
年 月
5.砕 木 パ ル プ Ground wood pulp
Year andMonth
- 12 -
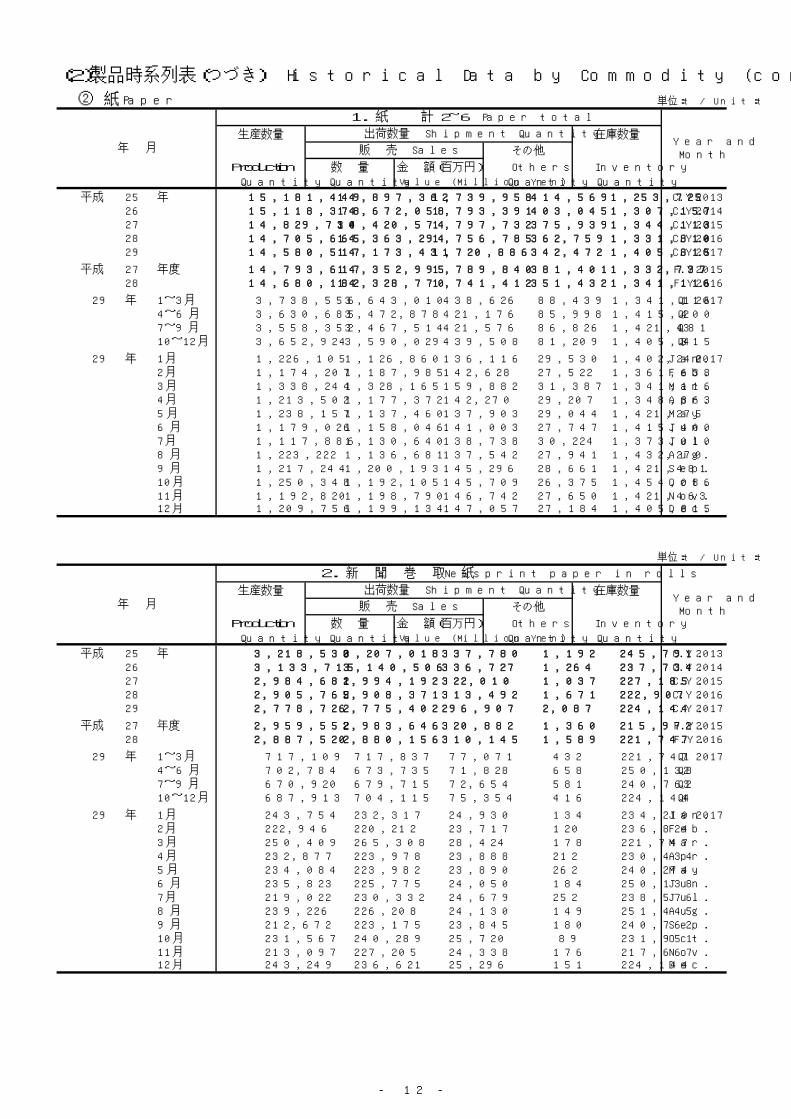
(2)製品時系列表(つづき) Historical Data by Commodity (continued)
② 紙 Paper 単位:t / Unit:t
生産数量 在庫数量
その他
Production 数 量 金 額(百万円) Others Inventory
Quantity Quantity Value (Million Yen) Quantity Quantity
平成 25 年 15,181,449 14,897,362 1,739,958 414,569 1,253,725 C.Y. 201326 15,118,378 14,672,058 1,793,391 403,045 1,307,157 C.Y. 201427 14,829,730 14,420,574 1,797,732 375,939 1,344,113 C.Y. 201528 14,705,665 14,363,294 1,756,785 362,759 1,331,810 C.Y. 201629 14,580,517 14,173,431 1,720,886 342,472 1,405,815 C.Y. 2017
平成 27 年度 14,793,617 14,352,995 1,789,840 381,401 1,332,737 F.Y. 201528 14,680,182 14,328,770 1,741,412 351,432 1,341,116 F.Y. 2016
29 年 1~3月 3,738,556 3,643,010 438,626 88,439 1,341,116 Q1 20174~6月 3,630,685 3,472,878 421,176 85,998 1,415,400 Q27~9月 3,558,352 3,467,514 421,576 86,826 1,421,481 Q310~12月 3,652,924 3,590,029 439,508 81,209 1,405,815 Q4
29 年 1月 1,226,105 1,126,860 136,116 29,530 1,402,240 Jan. 20172月 1,174,207 1,187,985 142,628 27,522 1,361,638 Feb.3月 1,338,244 1,328,165 159,882 31,387 1,341,116 Mar.4月 1,213,502 1,177,372 142,270 29,207 1,348,863 Apr.5月 1,238,157 1,137,460 137,903 29,044 1,421,275 May 6月 1,179,026 1,158,046 141,003 27,747 1,415,400 Jun.7月 1,117,886 1,130,640 138,738 30,224 1,373,010 Jul.8月 1,223,222 1,136,681 137,542 27,941 1,432,270 Aug.9月 1,217,244 1,200,193 145,296 28,661 1,421,481 Sep.10月 1,250,348 1,192,105 145,709 26,375 1,454,086 Oct.11月 1,192,820 1,198,790 146,742 27,650 1,421,463 Nov.12月 1,209,756 1,199,134 147,057 27,184 1,405,815 Dec.
単位:t / Unit:t
生産数量 在庫数量
その他
Production 数 量 金 額(百万円) Others Inventory
Quantity Quantity Value (Million Yen) Quantity Quantity
平成 25 年 3,218,530 3,207,018 337,780 1,192 245,791 C.Y. 201326 3,133,715 3,140,506 336,727 1,264 237,734 C.Y. 201427 2,984,681 2,994,192 322,010 1,037 227,185 C.Y. 201528 2,905,765 2,908,371 313,492 1,671 222,907 C.Y. 201629 2,778,726 2,775,402 296,907 2,087 224,144 C.Y. 2017
平成 27 年度 2,959,552 2,983,646 320,882 1,360 215,972 F.Y. 201528 2,887,520 2,880,156 310,145 1,589 221,747 F.Y. 2016
29 年 1~3月 717,109 717,837 77,071 432 221,747 Q1 20174~6月 702,784 673,735 71,828 658 250,138 Q27~9月 670,920 679,715 72,654 581 240,762 Q310~12月 687,913 704,115 75,354 416 224,144 Q4
29 年 1月 243,754 232,317 24,930 134 234,210 Jan. 20172月 222,946 220,212 23,717 120 236,824 Feb.3月 250,409 265,308 28,424 178 221,747 Mar.4月 232,877 223,978 23,888 212 230,434 Apr.5月 234,084 223,982 23,890 262 240,274 May 6月 235,823 225,775 24,050 184 250,138 Jun.7月 219,022 230,332 24,679 252 238,576 Jul.8月 239,226 226,208 24,130 149 251,445 Aug.9月 212,672 223,175 23,845 180 240,762 Sep.10月 231,567 240,289 25,720 89 231,951 Oct.11月 213,097 227,205 24,338 176 217,667 Nov.12月 243,249 236,621 25,296 151 224,144 Dec.
販 売 Sales
出荷数量 Shipment Quantity
年 月
2. 新 聞 巻 取 紙 Newsprint paper in rolls
Year andMonth
販 売 Sales
出荷数量 Shipment Quantity
年 月
1. 紙 計 2~6 Paper total
Year andMonth
- 13 -
(2)製品時系列表(つづき) Historical Data by Commodity (continued)
② 紙(つづき) Paper (continued) 単位:t / Unit:t
生産数量 在庫数量
その他
Production 数 量 金 額(百万円) Others Inventory
Quantity Quantity Value (Million Yen) Quantity Quantity
平成 25 年 8,576,456 8,454,776 863,819 256,731 756,403 C.Y. 201326 8,491,333 8,197,717 889,733 244,901 811,918 C.Y. 201427 8,384,386 8,137,658 903,243 217,697 844,763 C.Y. 201528 8,308,816 8,098,453 872,056 213,309 848,405 C.Y. 201629 8,242,475 7,971,569 840,648 206,004 919,172 C.Y. 2017
平成 27 年度 8,355,404 8,062,674 895,214 222,199 837,289 F.Y. 201528 8,300,675 8,088,618 861,716 204,658 850,284 F.Y. 2016
29 年 1~3月 2,133,679 2,082,486 219,835 50,121 850,284 Q1 20174~6月 2,038,355 1,946,077 204,678 50,195 894,188 Q27~9月 2,016,072 1,946,460 205,107 54,642 910,767 Q310~12月 2,054,369 1,996,546 211,028 51,046 919,172 Q4
29 年 1月 700,446 631,220 67,079 16,275 901,041 Jan. 20172月 664,693 694,108 73,023 14,681 857,466 Feb.3月 768,540 757,158 79,733 19,165 850,284 Mar.4月 679,161 662,759 69,390 16,622 850,668 Apr.5月 706,129 634,238 66,735 17,528 905,583 May 6月 653,065 649,080 68,553 16,045 894,188 Jun.7月 625,935 627,961 66,466 18,809 873,871 Jul.8月 689,145 629,679 66,114 17,666 916,113 Aug.9月 700,992 688,820 72,527 18,167 910,767 Sep.10月 704,933 659,779 70,259 16,081 940,394 Oct.11月 679,910 676,361 71,592 17,083 927,419 Nov.12月 669,526 660,406 69,177 17,882 919,172 Dec.
単位:t / Unit:t
生産数量 在庫数量
その他
Production 数 量 金 額(百万円) Others Inventory
Quantity Quantity Value (Million Yen) Quantity Quantity
平成 25 年 1,954,466 1,981,774 197,489 9,242 194,920 C.Y. 201326 1,897,152 1,884,507 195,891 7,168 200,393 C.Y. 201427 1,826,347 1,819,576 192,999 6,198 198,966 C.Y. 201528 1,834,079 1,824,091 188,015 6,500 202,456 C.Y. 201629 1,783,799 1,776,226 180,965 5,754 204,280 C.Y. 2017
平成 27 年度 1,829,258 1,812,935 192,132 6,349 189,692 F.Y. 201528 1,831,024 1,818,151 185,491 6,422 196,146 F.Y. 2016
29 年 1~3月 466,591 471,409 47,534 1,492 196,146 Q1 20174~6月 435,373 435,758 44,208 1,001 194,764 Q27~9月 442,618 432,253 44,198 1,778 203,351 Q310~12月 439,217 436,806 45,025 1,483 204,280 Q4
29 年 1月 155,894 145,883 14,930 471 211,996 Jan. 20172月 145,773 156,041 15,743 465 201,263 Feb.3月 164,924 169,485 16,861 556 196,146 Mar.4月 146,027 146,936 14,866 397 194,844 Apr.5月 144,643 142,018 14,524 286 197,185 May 6月 144,703 146,804 14,818 318 194,764 Jun.7月 143,104 139,333 14,201 672 197,863 Jul.8月 151,148 141,389 14,390 432 207,191 Aug.9月 148,366 151,531 15,607 674 203,351 Sep.10月 156,403 149,988 15,568 596 209,171 Oct.11月 145,656 148,720 15,317 428 205,679 Nov.12月 137,158 138,098 14,140 459 204,280 Dec.
販 売 Sales
出荷数量 Shipment Quantity
年 月
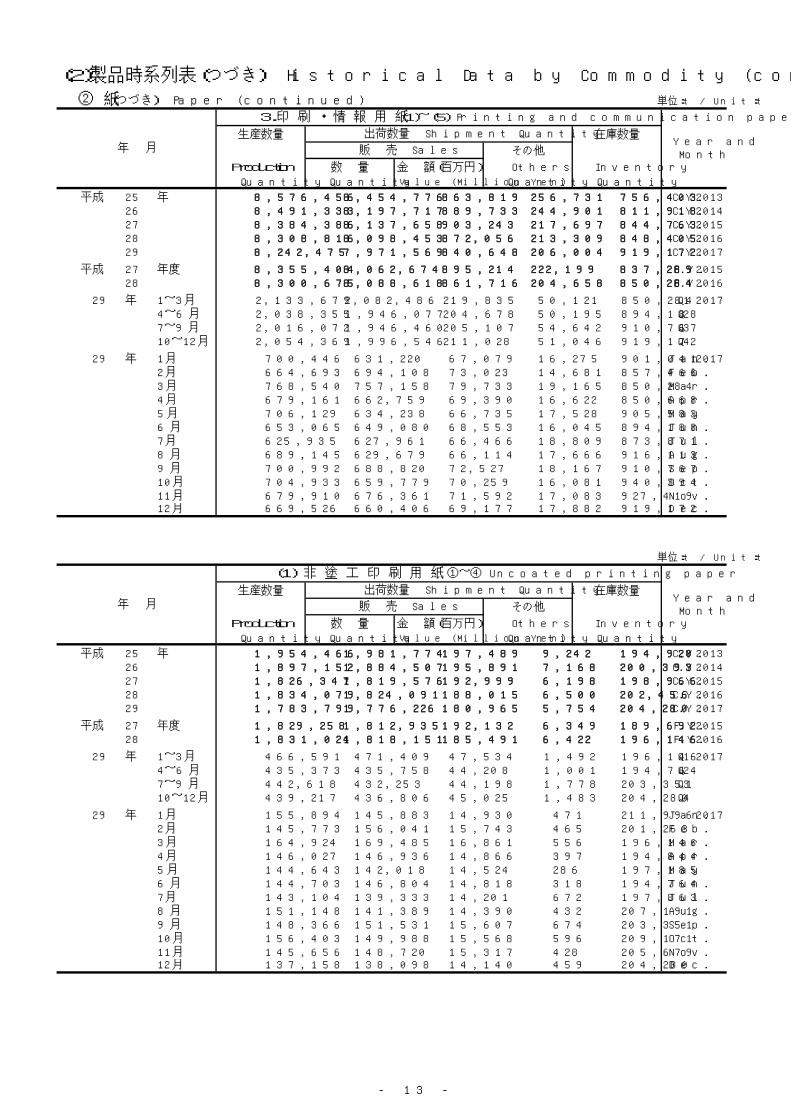
(1) 非 塗 工 印 刷 用 紙 ①~④ Uncoated printing paper
Year andMonth
販 売 Sales
出荷数量 Shipment Quantity
年 月
3.印 刷 ・ 情 報 用 紙 (1)~(5) Printing and communication paper
Year andMonth
- 14 -
(2)製品時系列表(つづき) Historical Data by Commodity (continued)
② 紙(つづき) Paper (continued) 単位:t / Unit:t
生産数量 在庫数量
その他
Production 数 量 金 額(百万円) Others Inventory
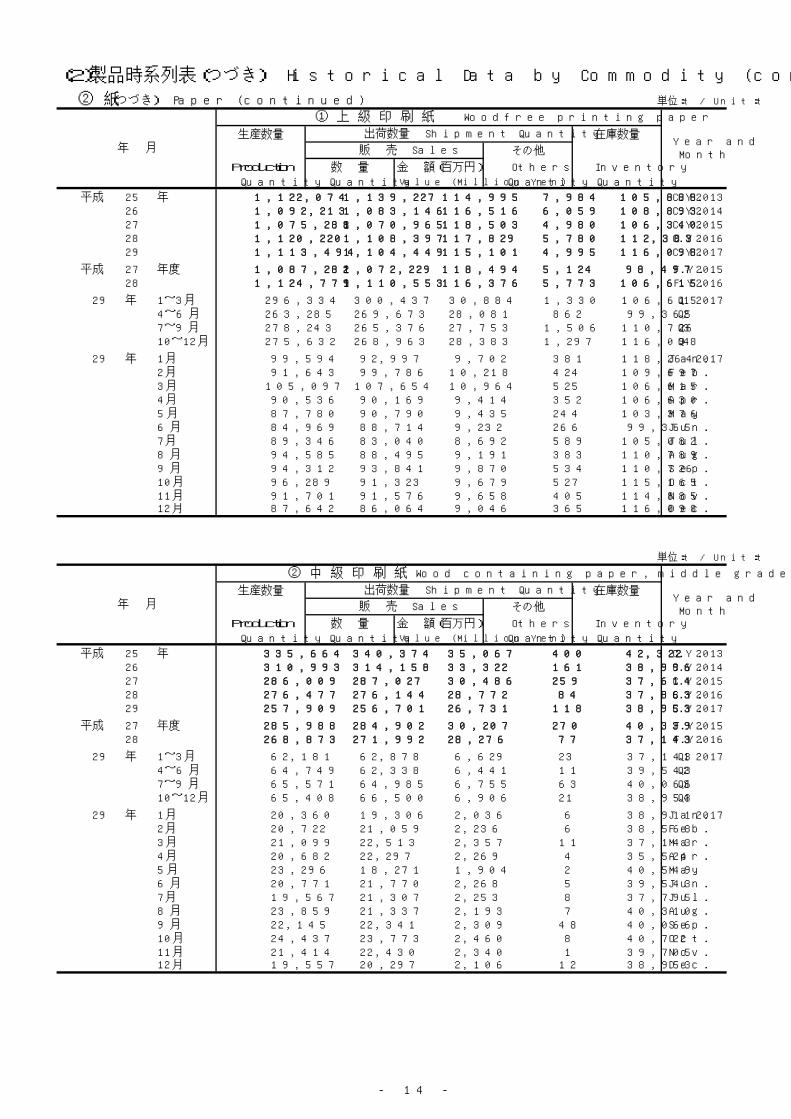
Quantity Quantity Value (Million Yen) Quantity Quantity
平成 25 年 1,122,074 1,139,227 114,995 7,984 105,888 C.Y. 201326 1,092,213 1,083,146 116,516 6,059 108,893 C.Y. 201427 1,075,288 1,070,965 118,503 4,980 106,340 C.Y. 201528 1,120,220 1,108,397 117,829 5,780 112,383 C.Y. 201629 1,113,494 1,104,449 115,101 4,995 116,098 C.Y. 2017
平成 27 年度 1,087,282 1,072,229 118,494 5,124 98,497 F.Y. 201528 1,124,779 1,110,553 116,376 5,773 106,615 F.Y. 2016
29 年 1~3月 296,334 300,437 30,884 1,330 106,615 Q1 20174~6月 263,285 269,673 28,081 862 99,365 Q27~9月 278,243 265,376 27,753 1,506 110,726 Q310~12月 275,632 268,963 28,383 1,297 116,098 Q4
29 年 1月 99,594 92,997 9,702 381 118,264 Jan. 20172月 91,643 99,786 10,218 424 109,697 Feb.3月 105,097 107,654 10,964 525 106,615 Mar.4月 90,536 90,169 9,414 352 106,630 Apr.5月 87,780 90,790 9,435 244 103,376 May 6月 84,969 88,714 9,232 266 99,365 Jun.7月 89,346 83,040 8,692 589 105,082 Jul.8月 94,585 88,495 9,191 383 110,789 Aug.9月 94,312 93,841 9,870 534 110,726 Sep.10月 96,289 91,323 9,679 527 115,165 Oct.11月 91,701 91,576 9,658 405 114,885 Nov.12月 87,642 86,064 9,046 365 116,098 Dec.
単位:t / Unit:t
生産数量 在庫数量
その他
Production 数 量 金 額(百万円) Others Inventory
Quantity Quantity Value (Million Yen) Quantity Quantity
平成 25 年 335,664 340,374 35,067 400 42,322 C.Y. 201326 310,993 314,158 33,322 161 38,996 C.Y. 201427 286,009 287,027 30,486 259 37,614 C.Y. 201528 276,477 276,144 28,772 84 37,863 C.Y. 201629 257,909 256,701 26,731 118 38,953 C.Y. 2017
平成 27 年度 285,988 284,902 30,207 270 40,339 F.Y. 201528 268,873 271,992 28,276 77 37,143 F.Y. 2016
29 年 1~3月 62,181 62,878 6,629 23 37,143 Q1 20174~6月 64,749 62,338 6,441 11 39,543 Q27~9月 65,571 64,985 6,755 63 40,066 Q310~12月 65,408 66,500 6,906 21 38,953 Q4
29 年 1月 20,360 19,306 2,036 6 38,911 Jan. 20172月 20,722 21,059 2,236 6 38,568 Feb.3月 21,099 22,513 2,357 11 37,143 Mar.4月 20,682 22,297 2,269 4 35,524 Apr.5月 23,296 18,271 1,904 2 40,549 May 6月 20,771 21,770 2,268 5 39,543 Jun.7月 19,567 21,307 2,253 8 37,795 Jul.8月 23,859 21,337 2,193 7 40,310 Aug.9月 22,145 22,341 2,309 48 40,066 Sep.10月 24,437 23,773 2,460 8 40,722 Oct.11月 21,414 22,430 2,340 1 39,705 Nov.12月 19,557 20,297 2,106 12 38,953 Dec.
販 売 Sales
出荷数量 Shipment QuantityYear andMonth
年 月
② 中 級 印 刷 紙 Wood containing paper, middle grade
販 売 Sales
出荷数量 Shipment Quantity
年 月
① 上 級 印 刷 紙 Woodfree printing paper
Year andMonth

- 15 -
(2)製品時系列表(つづき) Historical Data by Commodity (continued)
② 紙(つづき) Paper (continued) 単位:t / Unit:t
生産数量 在庫数量
その他
Production 数 量 金 額(百万円) Others Inventory
Quantity Quantity Value (Million Yen) Quantity Quantity
平成 25 年 471,406 477,671 41,244 787 41,953 C.Y. 201326 471,279 464,379 40,168 891 47,962 C.Y. 201427 443,006 439,910 38,093 932 50,126 C.Y. 201528 415,037 416,983 35,517 628 47,554 C.Y. 201629 387,706 389,668 32,649 616 44,978 C.Y. 2017
平成 27 年度 434,101 434,117 37,529 942 46,827 F.Y. 201528 413,937 412,389 34,829 564 47,814 F.Y. 2016
29 年 1~3月 102,474 102,078 8,529 136 47,814 Q1 20174~6月 100,829 97,750 8,169 116 50,778 Q27~9月 92,613 95,661 8,049 201 47,529 Q310~12月 91,790 94,179 7,902 163 44,978 Q4
29 年 1月 33,943 31,314 2,631 83 50,100 Jan. 20172月 31,718 33,145 2,779 33 48,640 Feb.3月 36,813 37,619 3,119 20 47,814 Mar.4月 32,222 32,743 2,760 31 47,263 Apr.5月 31,444 30,503 2,534 39 48,165 May 6月 37,163 34,504 2,875 46 50,778 Jun.7月 32,480 33,329 2,812 73 49,856 Jul.8月 30,408 29,516 2,478 38 50,711 Aug.9月 29,725 32,816 2,759 90 47,529 Sep.10月 33,196 32,188 2,712 61 48,477 Oct.11月 30,561 32,261 2,704 21 46,756 Nov.12月 28,033 29,730 2,486 81 44,978 Dec.
単位:t / Unit:t
生産数量 在庫数量
その他
Production 数 量 金 額(百万円) Others Inventory
Quantity Quantity Value (Million Yen) Quantity Quantity
平成 25 年 25,322 24,502 6,183 71 4,757 C.Y. 201326 22,667 22,824 5,885 57 4,542 C.Y. 201427 22,044 21,674 5,917 27 4,886 C.Y. 201528 22,345 22,567 5,897 8 4,656 C.Y. 201629 24,690 25,408 6,484 25 4,251 C.Y. 2017
平成 27 年度 21,887 21,687 5,902 13 4,029 F.Y. 201528 23,435 23,217 6,010 8 4,574 F.Y. 2016
29 年 1~3月 5,602 6,016 1,492 3 4,574 Q1 20174~6月 6,510 5,997 1,517 12 5,078 Q27~9月 6,191 6,231 1,641 8 5,030 Q310~12月 6,387 7,164 1,834 2 4,251 Q4
29 年 1月 1,997 2,266 561 1 4,721 Jan. 20172月 1,690 2,051 510 2 4,358 Feb.3月 1,915 1,699 421 - 4,574 Mar.4月 2,587 1,727 423 10 5,427 Apr.5月 2,123 2,454 651 1 5,095 May 6月 1,800 1,816 443 1 5,078 Jun.7月 1,711 1,657 444 2 5,130 Jul.8月 2,296 2,041 528 4 5,381 Aug.9月 2,184 2,533 669 2 5,030 Sep.10月 2,481 2,704 717 - 4,807 Oct.11月 1,980 2,453 615 1 4,333 Nov.12月 1,926 2,007 502 1 4,251 Dec.
販 売 Sales
出荷数量 Shipment Quantity
年 月
④ 薄 葉 印 刷 紙 Thin printing paper
Year andMonth
販 売 Sales
出荷数量 Shipment Quantity
年 月
③ 下 級 印 刷 紙 Wood containing paper, low grade
Year andMonth
- 16 -
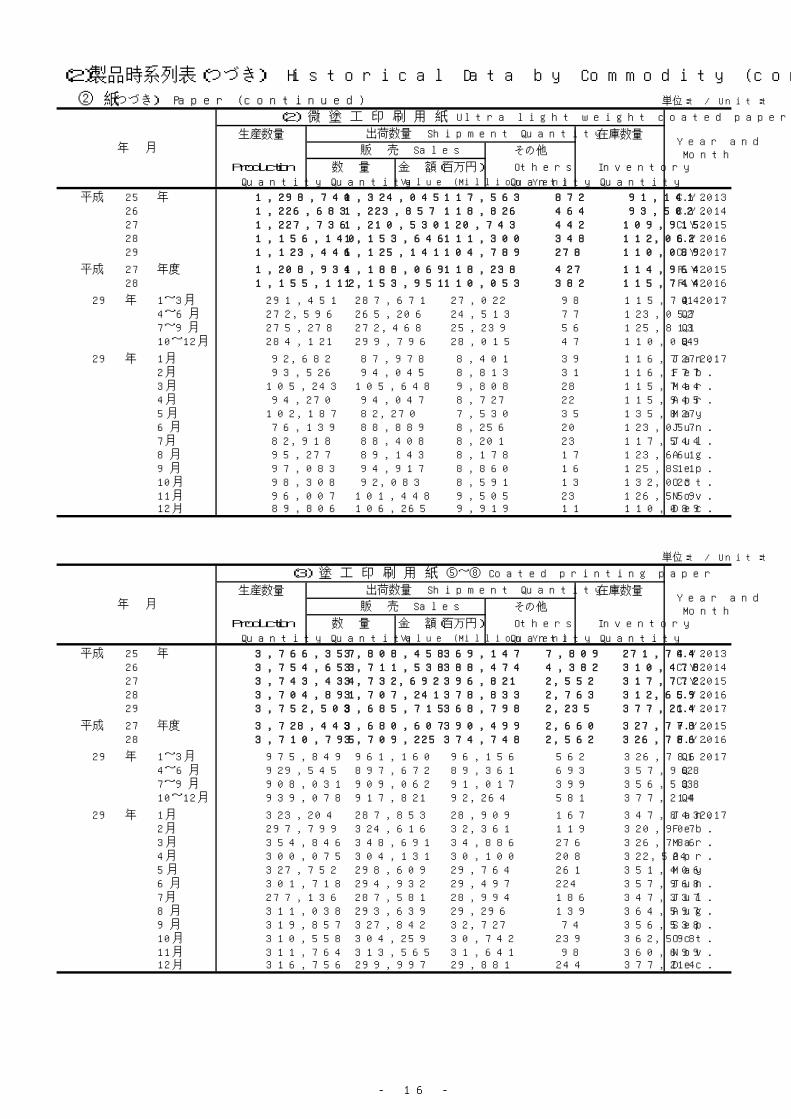
(2)製品時系列表(つづき) Historical Data by Commodity (continued)
② 紙(つづき) Paper (continued) 単位:t / Unit:t
生産数量 在庫数量
その他
Production 数 量 金 額(百万円) Others Inventory
Quantity Quantity Value (Million Yen) Quantity Quantity
平成 25 年 1,298,740 1,324,045 117,563 872 91,141 C.Y. 201326 1,226,683 1,223,857 118,826 464 93,502 C.Y. 201427 1,227,736 1,210,530 120,743 442 109,915 C.Y. 201528 1,156,140 1,153,646 111,300 348 112,062 C.Y. 201629 1,123,446 1,125,141 104,789 278 110,089 C.Y. 2017
平成 27 年度 1,208,934 1,188,069 118,238 427 114,964 F.Y. 201528 1,155,112 1,153,951 110,053 382 115,744 F.Y. 2016
29 年 1~3月 291,451 287,671 27,022 98 115,744 Q1 20174~6月 272,596 265,206 24,513 77 123,057 Q27~9月 275,278 272,468 25,239 56 125,811 Q310~12月 284,121 299,796 28,015 47 110,089 Q4
29 年 1月 92,682 87,978 8,401 39 116,727 Jan. 20172月 93,526 94,045 8,813 31 116,177 Feb.3月 105,243 105,648 9,808 28 115,744 Mar.4月 94,270 94,047 8,727 22 115,945 Apr.5月 102,187 82,270 7,530 35 135,827 May 6月 76,139 88,889 8,256 20 123,057 Jun.7月 82,918 88,408 8,201 23 117,544 Jul.8月 95,277 89,143 8,178 17 123,661 Aug.9月 97,083 94,917 8,860 16 125,811 Sep.10月 98,308 92,083 8,591 13 132,023 Oct.11月 96,007 101,448 9,505 23 126,559 Nov.12月 89,806 106,265 9,919 11 110,089 Dec.
単位:t / Unit:t
生産数量 在庫数量
その他
Production 数 量 金 額(百万円) Others Inventory
Quantity Quantity Value (Million Yen) Quantity Quantity
平成 25 年 3,766,357 3,808,458 369,147 7,809 271,744 C.Y. 201326 3,754,653 3,711,538 388,474 4,382 310,478 C.Y. 201427 3,743,434 3,732,692 396,821 2,552 317,772 C.Y. 201528 3,704,891 3,707,241 378,833 2,763 312,659 C.Y. 201629 3,752,503 3,685,715 368,798 2,235 377,214 C.Y. 2017
平成 27 年度 3,728,443 3,680,607 390,499 2,660 327,778 F.Y. 201528 3,710,795 3,709,225 374,748 2,562 326,786 F.Y. 2016
29 年 1~3月 975,849 961,160 96,156 562 326,786 Q1 20174~6月 929,545 897,672 89,361 693 357,968 Q27~9月 908,031 909,062 91,017 399 356,538 Q310~12月 939,078 917,821 92,264 581 377,214 Q4
29 年 1月 323,204 287,853 28,909 167 347,843 Jan. 20172月 297,799 324,616 32,361 119 320,907 Feb.3月 354,846 348,691 34,886 276 326,786 Mar.4月 300,075 304,131 30,100 208 322,524 Apr.5月 327,752 298,609 29,764 261 351,406 May 6月 301,718 294,932 29,497 224 357,968 Jun.7月 277,136 287,581 28,994 186 347,337 Jul.8月 311,038 293,639 29,296 139 364,597 Aug.9月 319,857 327,842 32,727 74 356,538 Sep.10月 310,558 304,259 30,742 239 362,598 Oct.11月 311,764 313,565 31,641 98 360,699 Nov.12月 316,756 299,997 29,881 244 377,214 Dec.
販 売 Sales
出荷数量 Shipment QuantityYear andMonth
年 月
(3) 塗 工 印 刷 用 紙 ⑤~⑧ Coated printing paper
販 売 Sales
出荷数量 Shipment Quantity
年 月
(2) 微 塗 工 印 刷 用 紙 Ultra light weight coated paper
Year andMonth
- 17 -
(2)製品時系列表(つづき) Historical Data by Commodity (continued)
② 紙(つづき) Paper (continued) 単位:t / Unit:t
生産数量 在庫数量
その他
Production 数 量 金 額(百万円) Others Inventory
Quantity Quantity Value (Million Yen) Quantity Quantity
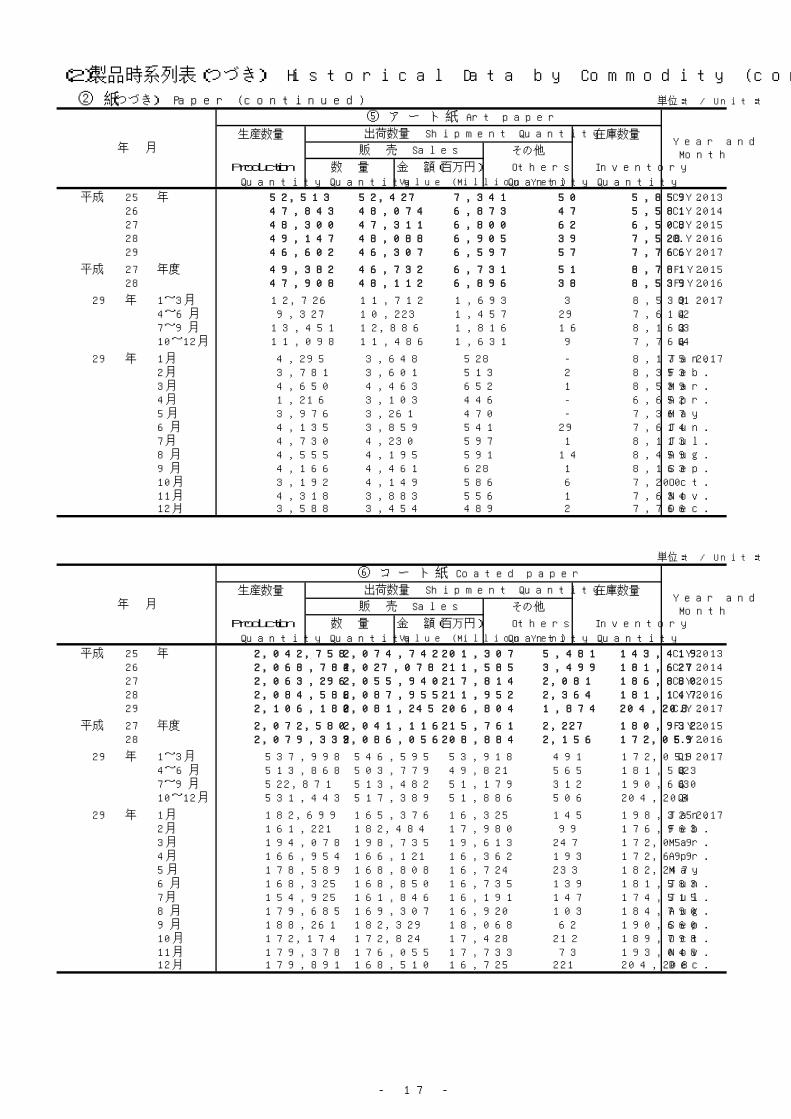
平成 25 年 52,513 52,427 7,341 50 5,859 C.Y. 201326 47,843 48,074 6,873 47 5,581 C.Y. 201427 48,300 47,311 6,800 62 6,508 C.Y. 201528 49,147 48,088 6,905 39 7,528 C.Y. 201629 46,602 46,307 6,597 57 7,766 C.Y. 2017
平成 27 年度 49,382 46,732 6,731 51 8,781 F.Y. 201528 47,908 48,112 6,896 38 8,539 F.Y. 2016
29 年 1~3月 12,726 11,712 1,693 3 8,539 Q1 20174~6月 9,327 10,223 1,457 29 7,614 Q27~9月 13,451 12,886 1,816 16 8,163 Q310~12月 11,098 11,486 1,631 9 7,766 Q4
29 年 1月 4,295 3,648 528 - 8,175 Jan. 20172月 3,781 3,601 513 2 8,353 Feb.3月 4,650 4,463 652 1 8,539 Mar.4月 1,216 3,103 446 - 6,652 Apr.5月 3,976 3,261 470 - 7,367 May 6月 4,135 3,859 541 29 7,614 Jun.7月 4,730 4,230 597 1 8,113 Jul.8月 4,555 4,195 591 14 8,459 Aug.9月 4,166 4,461 628 1 8,163 Sep.10月 3,192 4,149 586 6 7,200 Oct.11月 4,318 3,883 556 1 7,634 Nov.12月 3,588 3,454 489 2 7,766 Dec.
単位:t / Unit:t
生産数量 在庫数量
その他
Production 数 量 金 額(百万円) Others Inventory
Quantity Quantity Value (Million Yen) Quantity Quantity
平成 25 年 2,042,758 2,074,742 201,307 5,481 143,419 C.Y. 201326 2,068,784 2,027,078 211,585 3,499 181,627 C.Y. 201427 2,063,296 2,055,940 217,814 2,081 186,880 C.Y. 201528 2,084,586 2,087,955 211,952 2,364 181,147 C.Y. 201629 2,106,180 2,081,245 206,804 1,874 204,208 C.Y. 2017
平成 27 年度 2,072,580 2,041,116 215,761 2,227 180,932 F.Y. 201528 2,079,339 2,086,056 208,884 2,156 172,059 F.Y. 2016
29 年 1~3月 537,998 546,595 53,918 491 172,059 Q1 20174~6月 513,868 503,779 49,821 565 181,583 Q27~9月 522,871 513,482 51,179 312 190,660 Q310~12月 531,443 517,389 51,886 506 204,208 Q4
29 年 1月 182,699 165,376 16,325 145 198,325 Jan. 20172月 161,221 182,484 17,980 99 176,963 Feb.3月 194,078 198,735 19,613 247 172,059 Mar.4月 166,954 166,121 16,362 193 172,699 Apr.5月 178,589 168,808 16,724 233 182,247 May 6月 168,325 168,850 16,735 139 181,583 Jun.7月 154,925 161,846 16,191 147 174,515 Jul.8月 179,685 169,307 16,920 103 184,790 Aug.9月 188,261 182,329 18,068 62 190,660 Sep.10月 172,174 172,824 17,428 212 189,798 Oct.11月 179,378 176,055 17,733 73 193,048 Nov.12月 179,891 168,510 16,725 221 204,208 Dec.
販 売 Sales
出荷数量 Shipment Quantity
年 月
⑥ コ ー ト 紙 Coated paper
Year andMonth
販 売 Sales年 月
⑤ ア ー ト 紙 Art paper
Year andMonth
出荷数量 Shipment Quantity
- 18 -
(2)製品時系列表(つづき) Historical Data by Commodity (continued)
② 紙(つづき) Paper (continued) 単位:t / Unit:t
生産数量 在庫数量
その他
Production 数 量 金 額(百万円) Others Inventory
Quantity Quantity Value (Million Yen) Quantity Quantity
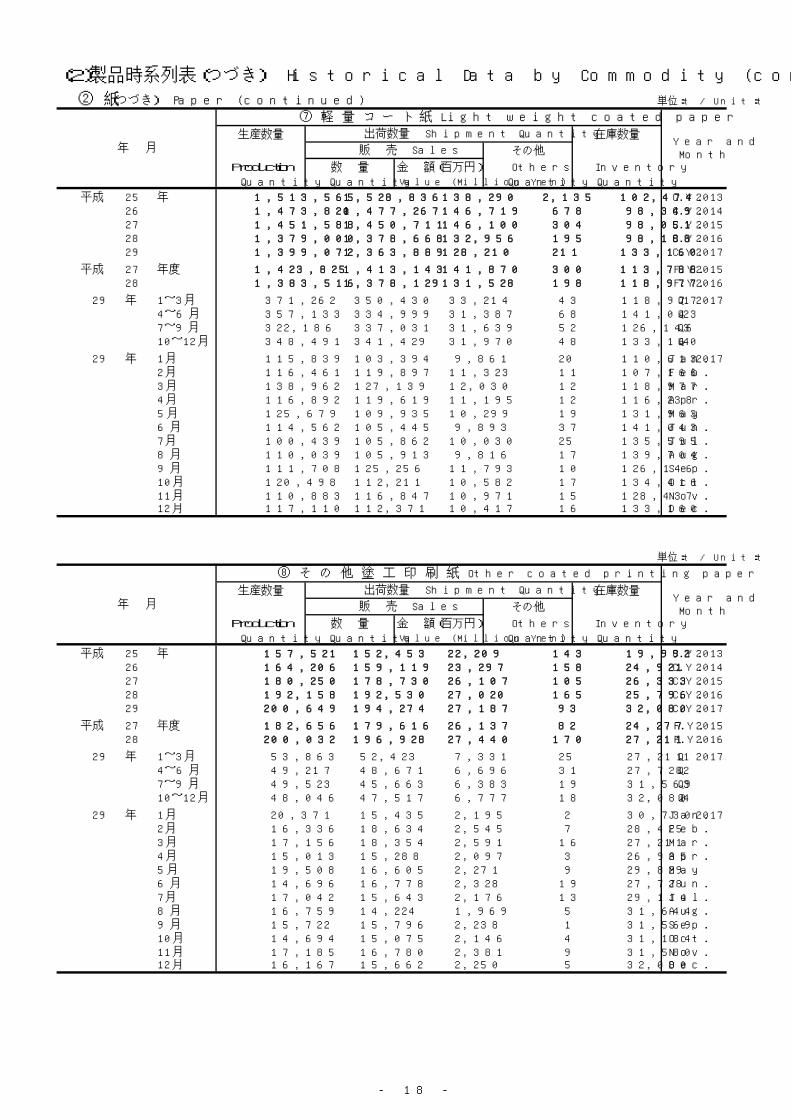
平成 25 年 1,513,565 1,528,836 138,290 2,135 102,474 C.Y. 201326 1,473,820 1,477,267 146,719 678 98,349 C.Y. 201427 1,451,588 1,450,711 146,100 304 98,051 C.Y. 201528 1,379,000 1,378,668 132,956 195 98,188 C.Y. 201629 1,399,072 1,363,889 128,210 211 133,160 C.Y. 2017
平成 27 年度 1,423,825 1,413,143 141,870 300 113,788 F.Y. 201528 1,383,516 1,378,129 131,528 198 118,977 F.Y. 2016
29 年 1~3月 371,262 350,430 33,214 43 118,977 Q1 20174~6月 357,133 334,999 31,387 68 141,043 Q27~9月 322,186 337,031 31,639 52 126,146 Q310~12月 348,491 341,429 31,970 48 133,160 Q4
29 年 1月 115,839 103,394 9,861 20 110,613 Jan. 20172月 116,461 119,897 11,323 11 107,166 Feb.3月 138,962 127,139 12,030 12 118,977 Mar.4月 116,892 119,619 11,195 12 116,238 Apr.5月 125,679 109,935 10,299 19 131,963 May 6月 114,562 105,445 9,893 37 141,043 Jun.7月 100,439 105,862 10,030 25 135,595 Jul.8月 110,039 105,913 9,816 17 139,704 Aug.9月 111,708 125,256 11,793 10 126,146 Sep.10月 120,498 112,211 10,582 17 134,416 Oct.11月 110,883 116,847 10,971 15 128,437 Nov.12月 117,110 112,371 10,417 16 133,160 Dec.
単位:t / Unit:t
生産数量 在庫数量
その他
Production 数 量 金 額(百万円) Others Inventory
Quantity Quantity Value (Million Yen) Quantity Quantity
平成 25 年 157,521 152,453 22,209 143 19,992 C.Y. 201326 164,206 159,119 23,297 158 24,921 C.Y. 201427 180,250 178,730 26,107 105 26,333 C.Y. 201528 192,158 192,530 27,020 165 25,796 C.Y. 201629 200,649 194,274 27,187 93 32,080 C.Y. 2017
平成 27 年度 182,656 179,616 26,137 82 24,277 F.Y. 201528 200,032 196,928 27,440 170 27,211 F.Y. 2016
29 年 1~3月 53,863 52,423 7,331 25 27,211 Q1 20174~6月 49,217 48,671 6,696 31 27,728 Q27~9月 49,523 45,663 6,383 19 31,569 Q310~12月 48,046 47,517 6,777 18 32,080 Q4
29 年 1月 20,371 15,435 2,195 2 30,730 Jan. 20172月 16,336 18,634 2,545 7 28,425 Feb.3月 17,156 18,354 2,591 16 27,211 Mar.4月 15,013 15,288 2,097 3 26,935 Apr.5月 19,508 16,605 2,271 9 29,829 May 6月 14,696 16,778 2,328 19 27,728 Jun.7月 17,042 15,643 2,176 13 29,114 Jul.8月 16,759 14,224 1,969 5 31,644 Aug.9月 15,722 15,796 2,238 1 31,569 Sep.10月 14,694 15,075 2,146 4 31,184 Oct.11月 17,185 16,780 2,381 9 31,580 Nov.12月 16,167 15,662 2,250 5 32,080 Dec.
販 売 SalesYear andMonth
年 月
⑧ そ の 他 塗 工 印 刷 紙 Other coated printing paper
出荷数量 Shipment Quantity
販 売 Sales年 月
⑦ 軽 量 コ ー ト 紙 Light weight coated paper
Year andMonth
出荷数量 Shipment Quantity
- 19 -
(2)製品時系列表(つづき) Historical Data by Commodity (continued)
② 紙(つづき) Paper (continued) 単位:t / Unit:t
生産数量 在庫数量
その他
Production 数 量 金 額(百万円) Others Inventory
Quantity Quantity Value (Million Yen) Quantity Quantity
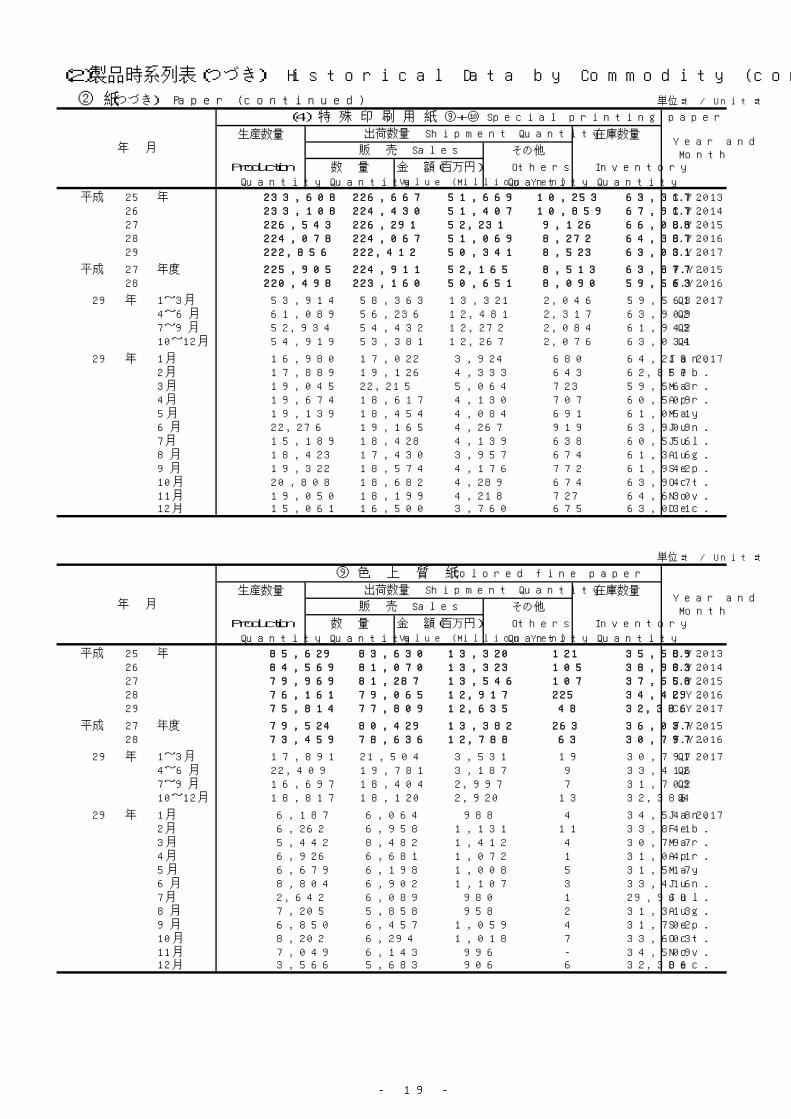
平成 25 年 233,608 226,667 51,669 10,253 63,317 C.Y. 201326 233,108 224,430 51,407 10,859 67,917 C.Y. 201427 226,543 226,291 52,231 9,126 66,088 C.Y. 201528 224,078 224,067 51,069 8,272 64,387 C.Y. 201629 222,856 222,412 50,341 8,523 63,031 C.Y. 2017
平成 27 年度 225,905 224,911 52,165 8,513 63,877 F.Y. 201528 220,498 223,160 50,651 8,090 59,563 F.Y. 2016
29 年 1~3月 53,914 58,363 13,321 2,046 59,563 Q1 20174~6月 61,089 56,236 12,481 2,317 63,909 Q27~9月 52,934 54,432 12,272 2,084 61,942 Q310~12月 54,919 53,381 12,267 2,076 63,031 Q4
29 年 1月 16,980 17,022 3,924 680 64,218 Jan. 20172月 17,889 19,126 4,333 643 62,857 Feb.3月 19,045 22,215 5,064 723 59,563 Mar.4月 19,674 18,617 4,130 707 60,509 Apr.5月 19,139 18,454 4,084 691 61,051 May 6月 22,276 19,165 4,267 919 63,909 Jun.7月 15,189 18,428 4,139 638 60,556 Jul.8月 18,423 17,430 3,957 674 61,316 Aug.9月 19,322 18,574 4,176 772 61,942 Sep.10月 20,808 18,682 4,289 674 63,947 Oct.11月 19,050 18,199 4,218 727 64,630 Nov.12月 15,061 16,500 3,760 675 63,031 Dec.
単位:t / Unit:t
生産数量 在庫数量
その他
Production 数 量 金 額(百万円) Others Inventory
Quantity Quantity Value (Million Yen) Quantity Quantity
平成 25 年 85,629 83,630 13,320 121 35,589 C.Y. 201326 84,569 81,070 13,323 105 38,983 C.Y. 201427 79,969 81,287 13,546 107 37,558 C.Y. 201528 76,161 79,065 12,917 225 34,429 C.Y. 201629 75,814 77,809 12,635 48 32,386 C.Y. 2017
平成 27 年度 79,524 80,429 13,382 263 36,037 F.Y. 201528 73,459 78,636 12,788 63 30,797 F.Y. 2016
29 年 1~3月 17,891 21,504 3,531 19 30,797 Q1 20174~6月 22,409 19,781 3,187 9 33,416 Q27~9月 16,697 18,404 2,997 7 31,702 Q310~12月 18,817 18,120 2,920 13 32,386 Q4
29 年 1月 6,187 6,064 988 4 34,548 Jan. 20172月 6,262 6,958 1,131 11 33,841 Feb.3月 5,442 8,482 1,412 4 30,797 Mar.4月 6,926 6,681 1,072 1 31,041 Apr.5月 6,679 6,198 1,008 5 31,517 May 6月 8,804 6,902 1,107 3 33,416 Jun.7月 2,642 6,089 980 1 29,968 Jul.8月 7,205 5,858 958 2 31,313 Aug.9月 6,850 6,457 1,059 4 31,702 Sep.10月 8,202 6,294 1,018 7 33,603 Oct.11月 7,049 6,143 996 - 34,509 Nov.12月 3,566 5,683 906 6 32,386 Dec.
販 売 Sales年 月
⑨ 色 上 質 紙 Colored fine paper
Year andMonth
出荷数量 Shipment Quantity
販 売 Sales年 月
(4) 特 殊 印 刷 用 紙 ⑨+⑩ Special printing paper
Year andMonth
出荷数量 Shipment Quantity
- 20 -
(2)製品時系列表(つづき) Historical Data by Commodity (continued)
② 紙(つづき) Paper (continued) 単位:t / Unit:t
生産数量 在庫数量
その他
Production 数 量 金 額(百万円) Others Inventory
Quantity Quantity Value (Million Yen) Quantity Quantity
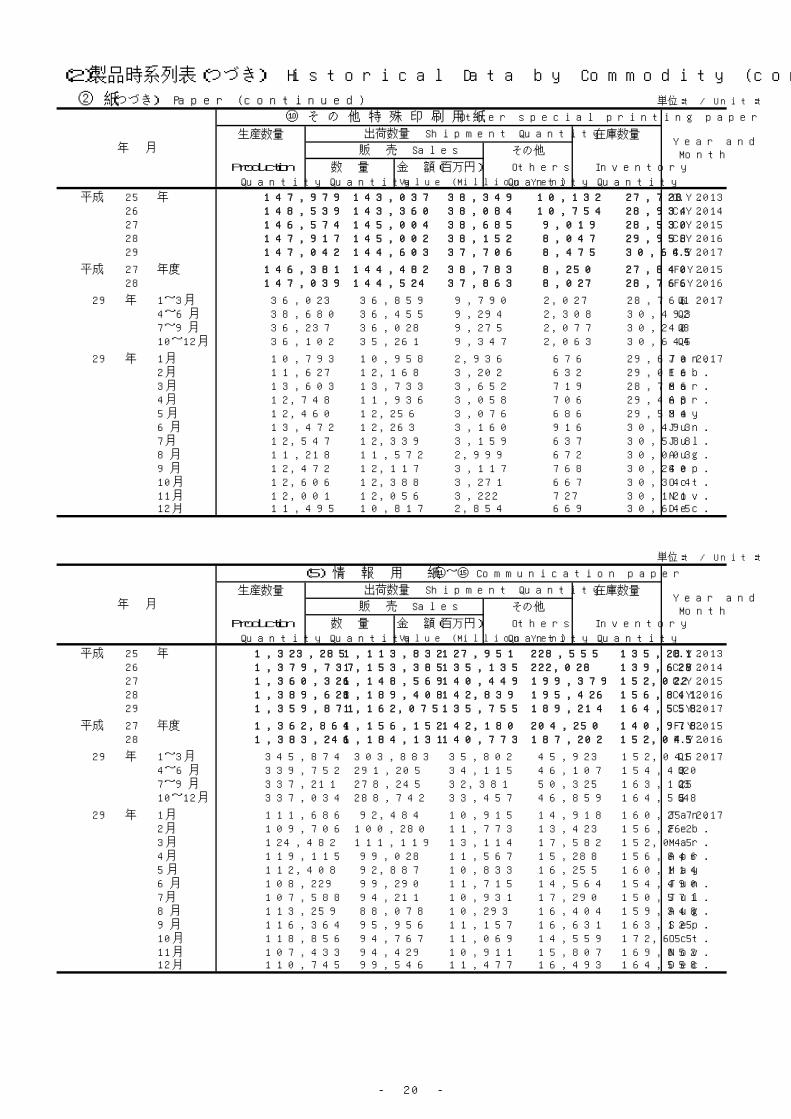
平成 25 年 147,979 143,037 38,349 10,132 27,728 C.Y. 201326 148,539 143,360 38,084 10,754 28,934 C.Y. 201427 146,574 145,004 38,685 9,019 28,530 C.Y. 201528 147,917 145,002 38,152 8,047 29,958 C.Y. 201629 147,042 144,603 37,706 8,475 30,645 C.Y. 2017
平成 27 年度 146,381 144,482 38,783 8,250 27,840 F.Y. 201528 147,039 144,524 37,863 8,027 28,766 F.Y. 2016
29 年 1~3月 36,023 36,859 9,790 2,027 28,766 Q1 20174~6月 38,680 36,455 9,294 2,308 30,493 Q27~9月 36,237 36,028 9,275 2,077 30,240 Q310~12月 36,102 35,261 9,347 2,063 30,645 Q4
29 年 1月 10,793 10,958 2,936 676 29,670 Jan. 20172月 11,627 12,168 3,202 632 29,016 Feb.3月 13,603 13,733 3,652 719 28,766 Mar.4月 12,748 11,936 3,058 706 29,468 Apr.5月 12,460 12,256 3,076 686 29,534 May 6月 13,472 12,263 3,160 916 30,493 Jun.7月 12,547 12,339 3,159 637 30,588 Jul.8月 11,218 11,572 2,999 672 30,003 Aug.9月 12,472 12,117 3,117 768 30,240 Sep.10月 12,606 12,388 3,271 667 30,344 Oct.11月 12,001 12,056 3,222 727 30,121 Nov.12月 11,495 10,817 2,854 669 30,645 Dec.
単位:t / Unit:t
生産数量 在庫数量
その他
Production 数 量 金 額(百万円) Others Inventory
Quantity Quantity Value (Million Yen) Quantity Quantity
平成 25 年 1,323,285 1,113,832 127,951 228,555 135,281 C.Y. 201326 1,379,737 1,153,385 135,135 222,028 139,628 C.Y. 201427 1,360,326 1,148,569 140,449 199,379 152,022 C.Y. 201528 1,389,628 1,189,408 142,839 195,426 156,841 C.Y. 201629 1,359,871 1,162,075 135,755 189,214 164,558 C.Y. 2017
平成 27 年度 1,362,864 1,156,152 142,180 204,250 140,978 F.Y. 201528 1,383,246 1,184,131 140,773 187,202 152,045 F.Y. 2016
29 年 1~3月 345,874 303,883 35,802 45,923 152,045 Q1 20174~6月 339,752 291,205 34,115 46,107 154,490 Q27~9月 337,211 278,245 32,381 50,325 163,125 Q310~12月 337,034 288,742 33,457 46,859 164,558 Q4
29 年 1月 111,686 92,484 10,915 14,918 160,257 Jan. 20172月 109,706 100,280 11,773 13,423 156,262 Feb.3月 124,482 111,119 13,114 17,582 152,045 Mar.4月 119,115 99,028 11,567 15,288 156,846 Apr.5月 112,408 92,887 10,833 16,255 160,114 May 6月 108,229 99,290 11,715 14,564 154,490 Jun.7月 107,588 94,211 10,931 17,290 150,571 Jul.8月 113,259 88,078 10,293 16,404 159,348 Aug.9月 116,364 95,956 11,157 16,631 163,125 Sep.10月 118,856 94,767 11,069 14,559 172,655 Oct.11月 107,433 94,429 10,911 15,807 169,852 Nov.12月 110,745 99,546 11,477 16,493 164,558 Dec.
Year andMonth
年 月
(5) 情 報 用 紙 ⑪~⑮ Communication paper
出荷数量 Shipment Quantity
販 売 Sales
年 月
⑩ そ の 他 特 殊 印 刷 用 紙 Other special printing paper
Year andMonth
出荷数量 Shipment Quantity
販 売 Sales
- 21 -
(2)製品時系列表(つづき) Historical Data by Commodity (continued)
② 紙(つづき) Paper (continued) 単位:t / Unit:t
生産数量 在庫数量
その他
Production 数 量 金 額(百万円) Others Inventory
Quantity Quantity Value (Million Yen) Quantity Quantity
平成 25 年 149,987 14,568 2,551 136,686 8,599 C.Y. 201326 147,585 15,880 2,658 130,067 10,237 C.Y. 201427 138,692 21,850 3,418 116,292 10,787 C.Y. 201528 144,941 35,222 4,499 109,332 11,174 C.Y. 201629 150,246 46,718 5,266 103,068 11,634 C.Y. 2017
平成 27 年度 141,845 24,497 3,673 116,312 10,146 F.Y. 201528 145,238 38,243 4,725 105,931 11,210 F.Y. 2016
29 年 1~3月 36,651 10,184 1,179 26,431 11,210 Q1 20174~6月 36,157 11,836 1,345 24,901 10,630 Q27~9月 38,976 11,650 1,303 27,224 10,732 Q310~12月 38,462 13,048 1,439 24,512 11,634 Q4
29 年 1月 12,464 3,293 394 8,521 11,824 Jan. 20172月 10,892 3,470 389 7,524 11,722 Feb.3月 13,295 3,421 396 10,386 11,210 Mar.4月 12,953 4,063 459 8,588 11,512 Apr.5月 14,409 4,139 467 8,119 13,663 May 6月 8,795 3,634 419 8,194 10,630 Jun.7月 12,153 3,102 369 9,205 10,476 Jul.8月 14,807 4,705 504 9,374 11,204 Aug.9月 12,016 3,843 430 8,645 10,732 Sep.10月 14,863 4,332 484 7,487 13,776 Oct.11月 11,375 4,659 501 8,910 11,582 Nov.12月 12,224 4,057 454 8,115 11,634 Dec.
単位:t / Unit:t
生産数量 在庫数量
その他
Production 数 量 金 額(百万円) Others Inventory
Quantity Quantity Value (Million Yen) Quantity Quantity
平成 25 年 242,496 245,716 27,447 1,089 28,374 C.Y. 201326 250,686 245,652 28,228 1,278 32,131 C.Y. 201427 232,366 229,176 26,890 1,081 34,240 C.Y. 201528 235,197 236,235 27,045 1,091 32,112 C.Y. 201629 235,223 230,462 26,301 932 35,940 C.Y. 2017
平成 27 年度 229,027 231,003 27,126 1,149 29,339 F.Y. 201528 238,990 235,260 26,757 1,179 31,890 F.Y. 2016
29 年 1~3月 59,215 59,147 6,781 290 31,890 Q1 20174~6月 57,185 59,332 6,748 210 29,533 Q27~9月 58,891 56,154 6,420 233 32,036 Q310~12月 59,932 55,829 6,352 199 35,940 Q4
29 年 1月 18,535 18,368 2,108 102 32,177 Jan. 20172月 18,772 19,248 2,215 91 31,610 Feb.3月 21,908 21,531 2,458 97 31,890 Mar.4月 20,298 20,813 2,351 131 31,244 Apr.5月 18,405 18,604 2,124 48 30,997 May 6月 18,482 19,915 2,273 31 29,533 Jun.7月 18,951 18,768 2,128 96 29,619 Jul.8月 21,179 18,256 2,091 74 32,468 Aug.9月 18,761 19,130 2,201 63 32,036 Sep.10月 19,277 19,075 2,179 22 32,216 Oct.11月 19,083 18,118 2,065 125 33,056 Nov.12月 21,572 18,636 2,108 52 35,940 Dec.
年 月
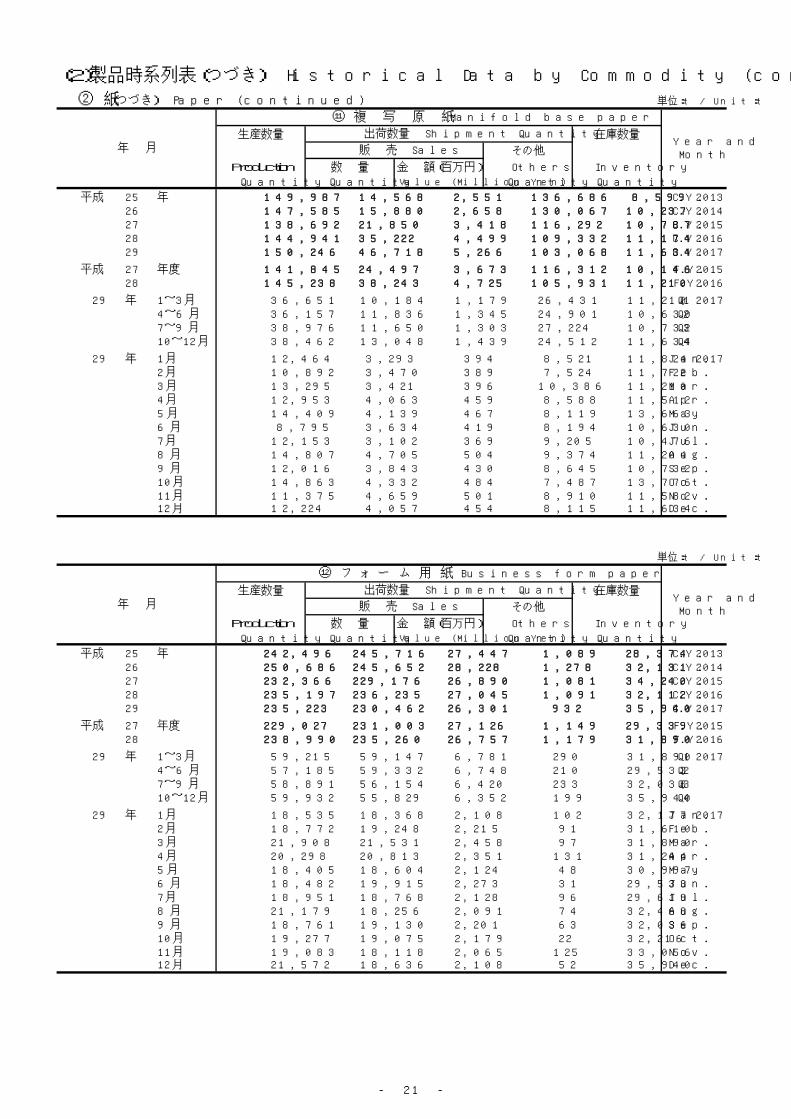
⑫ フ ォ ー ム 用 紙 Business form paper
Year andMonth
出荷数量 Shipment Quantity
販 売 Sales
年 月
⑪ 複 写 原 紙 Manifold base paper
Year andMonth
出荷数量 Shipment Quantity
販 売 Sales
- 22 -
(2)製品時系列表(つづき) Historical Data by Commodity (continued)
② 紙(つづき) Paper (continued) 単位:t / Unit:t
生産数量 在庫数量
その他
Production 数 量 金 額(百万円) Others Inventory
Quantity Quantity Value (Million Yen) Quantity Quantity
平成 25 年 753,359 765,489 80,730 873 80,106 C.Y. 201326 808,168 806,455 87,421 830 80,991 C.Y. 201427 815,602 804,765 92,366 735 91,093 C.Y. 201528 830,990 823,065 94,008 779 98,239 C.Y. 201629 813,675 808,624 90,202 881 102,406 C.Y. 2017
平成 27 年度 815,027 808,948 93,735 766 85,045 F.Y. 201528 832,837 822,190 93,054 766 94,926 F.Y. 2016
29 年 1~3月 214,453 217,570 24,411 196 94,926 Q1 20174~6月 206,299 201,053 22,441 181 99,990 Q27~9月 196,298 190,105 21,167 196 105,985 Q310~12月 196,625 199,896 22,183 308 102,406 Q4
29 年 1月 71,196 65,943 7,404 63 103,429 Jan. 20172月 67,488 71,962 8,078 54 98,901 Feb.3月 75,769 79,665 8,929 79 94,926 Mar.4月 71,295 68,109 7,625 67 98,045 Apr.5月 66,145 64,129 7,155 64 99,997 May 6月 68,859 68,815 7,661 50 99,990 Jun.7月 62,301 65,737 7,305 72 96,480 Jul.8月 64,374 58,663 6,551 94 102,097 Aug.9月 69,623 65,705 7,311 30 105,985 Sep.10月 70,378 64,854 7,206 136 111,373 Oct.11月 62,807 65,585 7,274 109 108,486 Nov.12月 63,440 69,457 7,703 63 102,406 Dec.
単位:t / Unit:t
生産数量 在庫数量
その他
Production 数 量 金 額(百万円) Others Inventory
Quantity Quantity Value (Million Yen) Quantity Quantity
平成 25 年 121,159 33,953 6,600 85,504 13,321 C.Y. 201326 115,678 32,430 6,435 85,863 10,726 C.Y. 201427 114,349 37,826 6,791 77,541 9,732 C.Y. 201528 114,500 35,142 6,335 80,037 9,077 C.Y. 201629 135,064 52,348 7,691 81,972 9,830 C.Y. 2017
平成 27 年度 117,405 36,470 6,712 82,571 10,185 F.Y. 201528 111,472 37,481 6,425 75,362 8,838 F.Y. 2016
29 年 1~3月 28,183 10,093 1,637 18,335 8,838 Q1 20174~6月 34,160 12,792 2,012 20,412 9,800 Q27~9月 36,706 15,012 2,001 21,902 9,589 Q310~12月 36,015 14,451 2,041 21,323 9,830 Q4
29 年 1月 7,534 2,996 509 5,961 7,656 Jan. 20172月 10,206 3,504 545 5,617 8,743 Feb.3月 10,443 3,593 583 6,757 8,838 Mar.4月 12,524 3,914 623 6,468 10,982 Apr.5月 11,729 4,067 591 7,894 10,752 May 6月 9,907 4,811 798 6,050 9,800 Jun.7月 11,939 4,715 650 7,692 9,329 Jul.8月 10,872 4,810 653 6,496 8,895 Aug.9月 13,895 5,487 698 7,714 9,589 Sep.10月 12,149 4,345 654 6,732 10,661 Oct.11月 12,174 4,452 636 6,531 11,852 Nov.12月 11,692 5,654 751 8,060 9,830 Dec.
Year andMonth
年 月
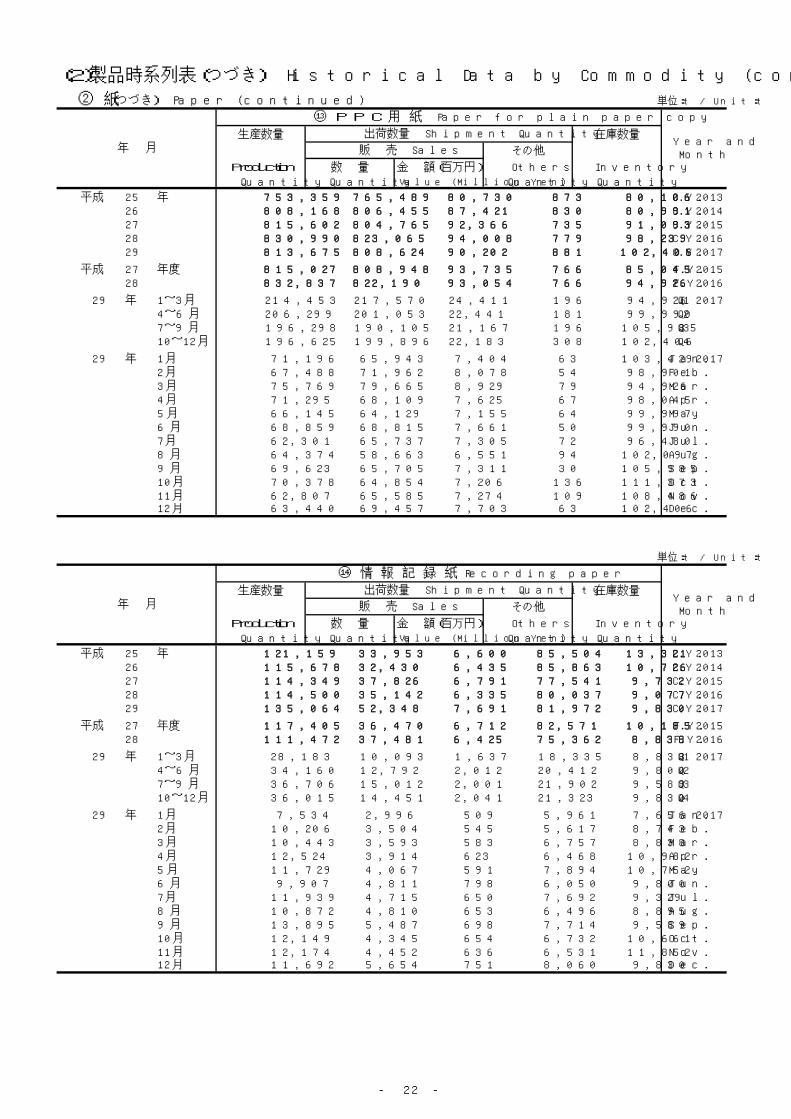
⑭ 情 報 記 録 紙 Recording paper
出荷数量 Shipment Quantity
販 売 Sales
年 月
⑬ P P C 用 紙 Paper for plain paper copy
Year andMonth
出荷数量 Shipment Quantity
販 売 Sales
- 23 -
(2)製品時系列表(つづき) Historical Data by Commodity (continued)
② 紙(つづき) Paper (continued) 単位:t / Unit:t
生産数量 在庫数量
その他
Production 数 量 金 額(百万円) Others Inventory
Quantity Quantity Value (Million Yen) Quantity Quantity
平成 25 年 56,284 54,106 10,623 4,403 4,881 C.Y. 201326 57,620 52,968 10,393 3,990 5,543 C.Y. 201427 59,317 54,952 10,984 3,730 6,170 C.Y. 201528 64,000 59,744 10,952 4,187 6,239 C.Y. 201629 25,663 23,923 6,295 2,361 4,748 C.Y. 2017
平成 27 年度 59,560 55,234 10,934 3,452 6,263 F.Y. 201528 54,709 50,957 9,812 3,964 5,181 F.Y. 2016
29 年 1~3月 7,372 6,889 1,794 671 5,181 Q1 20174~6月 5,951 6,192 1,569 403 4,537 Q27~9月 6,340 5,324 1,490 770 4,783 Q310~12月 6,000 5,518 1,442 517 4,748 Q4
29 年 1月 1,957 1,884 500 271 5,171 Jan. 20172月 2,348 2,096 546 137 5,286 Feb.3月 3,067 2,909 748 263 5,181 Mar.4月 2,045 2,129 509 34 5,063 Apr.5月 1,720 1,948 496 130 4,705 May 6月 2,186 2,115 564 239 4,537 Jun.7月 2,244 1,889 479 225 4,667 Jul.8月 2,027 1,644 494 366 4,684 Aug.9月 2,069 1,791 517 179 4,783 Sep.10月 2,189 2,161 546 182 4,629 Oct.11月 1,994 1,615 435 132 4,876 Nov.12月 1,817 1,742 461 203 4,748 Dec.
単位:t / Unit:t
生産数量 在庫数量
その他
Production 数 量 金 額(百万円) Others Inventory
Quantity Quantity Value (Million Yen) Quantity Quantity
平成 25 年 879,771 873,459 98,294 7,297 104,990 C.Y. 201326 905,397 904,563 100,798 6,685 99,219 C.Y. 201427 891,164 870,456 100,694 4,844 112,330 C.Y. 201528 877,241 884,006 96,874 3,797 101,864 C.Y. 201629 896,348 888,949 95,859 2,316 106,939 C.Y. 2017
平成 27 年度 886,936 869,087 99,997 4,910 114,494 F.Y. 201528 874,358 881,700 95,716 2,934 104,313 F.Y. 2016
29 年 1~3月 224,281 221,371 23,960 486 104,313 Q1 20174~6月 221,673 220,216 23,838 462 105,332 Q27~9月 218,996 222,186 23,776 773 101,312 Q310~12月 231,398 225,176 24,285 595 106,939 Q4
29 年 1月 69,308 70,327 7,608 126 100,728 Jan. 20172月 72,742 72,534 7,835 217 100,726 Feb.3月 82,231 78,510 8,517 143 104,313 Mar.4月 76,465 74,070 8,003 148 106,569 Apr.5月 76,825 73,206 7,950 184 110,011 May 6月 68,383 72,940 7,885 130 105,332 Jun.7月 66,543 71,842 7,744 190 99,786 Jul.8月 75,957 73,406 7,798 216 102,121 Aug.9月 76,496 76,938 8,234 367 101,312 Sep.10月 81,342 75,405 8,095 132 107,118 Oct.11月 75,967 75,766 8,199 314 107,004 Nov.12月 74,089 74,005 7,991 149 106,939 Dec.
年 月
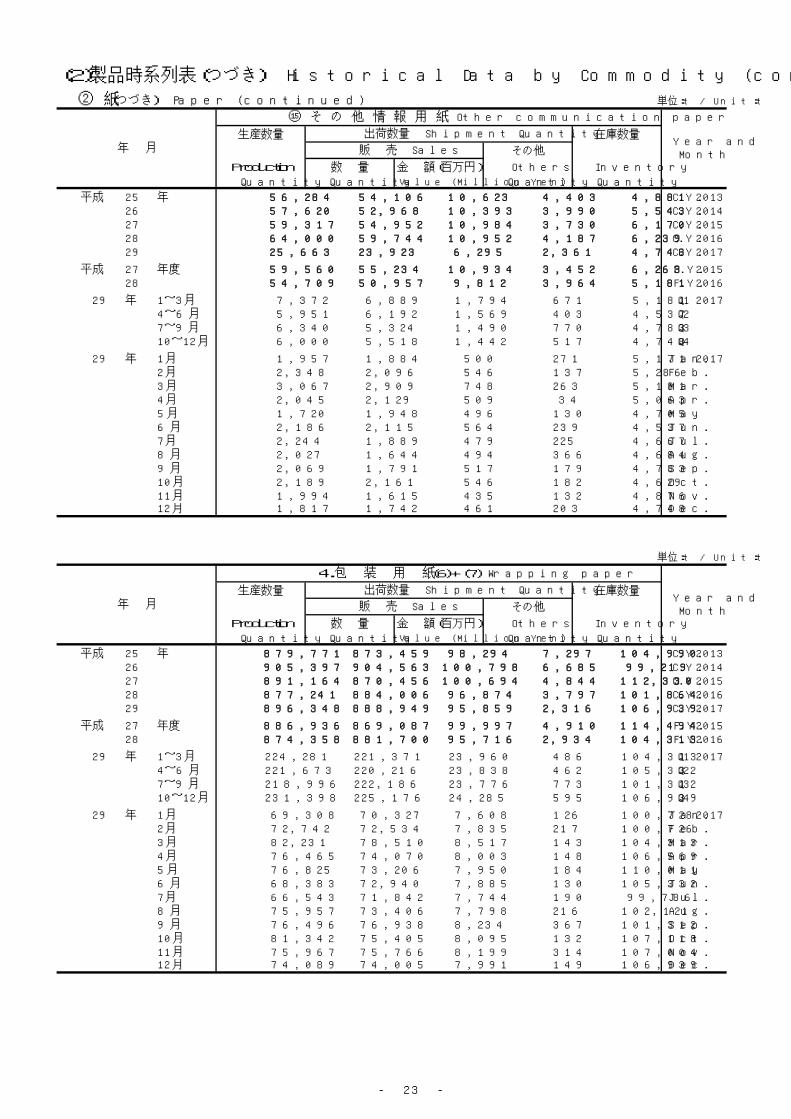
4.包 装 用 紙 (6)+(7) Wrapping paper
Year andMonth
出荷数量 Shipment Quantity
販 売 Sales
年 月
⑮ そ の 他 情 報 用 紙 Other communication paper
Year andMonth
出荷数量 Shipment Quantity
販 売 Sales
- 24 -
(2)製品時系列表(つづき) Historical Data by Commodity (continued)
② 紙(つづき) Paper (continued) 単位:t / Unit:t
生産数量 在庫数量
その他
Production 数 量 金 額(百万円) Others Inventory
Quantity Quantity Value (Million Yen) Quantity Quantity
平成 25 年 565,581 562,811 56,755 5,150 63,854 C.Y. 201326 590,759 588,898 59,968 4,747 60,965 C.Y. 201427 586,223 571,157 60,596 3,381 69,868 C.Y. 201528 580,801 584,847 58,038 2,526 63,296 C.Y. 201629 594,132 589,017 57,882 1,280 67,130 C.Y. 2017
平成 27 年度 585,241 572,685 60,302 3,522 69,427 F.Y. 201528 578,445 582,515 57,188 1,727 63,630 F.Y. 2016
29 年 1~3月 147,776 147,203 14,456 239 63,630 Q1 20174~6月 147,343 146,051 14,370 284 64,638 Q27~9月 145,740 147,992 14,501 375 62,011 Q310~12月 153,273 147,771 14,555 382 67,130 Q4
29 年 1月 45,544 47,155 4,602 70 61,615 Jan. 20172月 47,252 47,604 4,676 95 61,168 Feb.3月 54,980 52,444 5,178 74 63,630 Mar.4月 49,479 48,987 4,817 67 64,055 Apr.5月 51,796 48,645 4,803 144 67,062 May 6月 46,068 48,419 4,750 73 64,638 Jun.7月 45,091 48,026 4,756 104 61,599 Jul.8月 49,800 49,097 4,779 90 62,212 Aug.9月 50,849 50,869 4,966 181 62,011 Sep.10月 54,946 48,903 4,777 40 68,013 Oct.11月 50,387 49,574 4,903 256 68,570 Nov.12月 47,940 49,294 4,875 86 67,130 Dec.
単位:t / Unit:t
生産数量 在庫数量
その他
Production 数 量 金 額(百万円) Others Inventory
Quantity Quantity Value (Million Yen) Quantity Quantity
平成 25 年 339,598 340,398 32,443 1,747 35,971 C.Y. 201326 349,702 349,700 33,917 1,514 34,459 C.Y. 201427 341,633 329,901 33,568 2,389 42,428 C.Y. 201528 338,526 341,901 32,125 2,241 36,812 C.Y. 201629 342,367 341,595 31,585 875 36,709 C.Y. 2017
平成 27 年度 339,851 330,574 33,311 2,747 41,374 F.Y. 201528 339,137 342,560 31,725 1,561 36,390 F.Y. 2016
29 年 1~3月 85,979 86,200 7,935 201 36,390 Q1 20174~6月 85,560 86,876 8,066 250 34,824 Q27~9月 82,944 85,373 7,911 245 32,150 Q310~12月 87,884 83,146 7,673 179 36,709 Q4
29 年 1月 25,406 27,349 2,489 55 34,814 Jan. 20172月 26,919 27,960 2,567 85 33,688 Feb.3月 33,654 30,891 2,879 61 36,390 Mar.4月 30,994 29,902 2,772 55 37,427 Apr.5月 29,530 28,444 2,643 132 38,381 May 6月 25,036 28,530 2,651 63 34,824 Jun.7月 25,583 28,204 2,645 90 32,113 Jul.8月 27,699 28,242 2,596 72 31,498 Aug.9月 29,662 28,927 2,670 83 32,150 Sep.10月 32,618 28,571 2,614 32 36,165 Oct.11月 28,621 27,284 2,534 78 37,424 Nov.12月 26,645 27,291 2,525 69 36,709 Dec.
Year andMonth
年 月
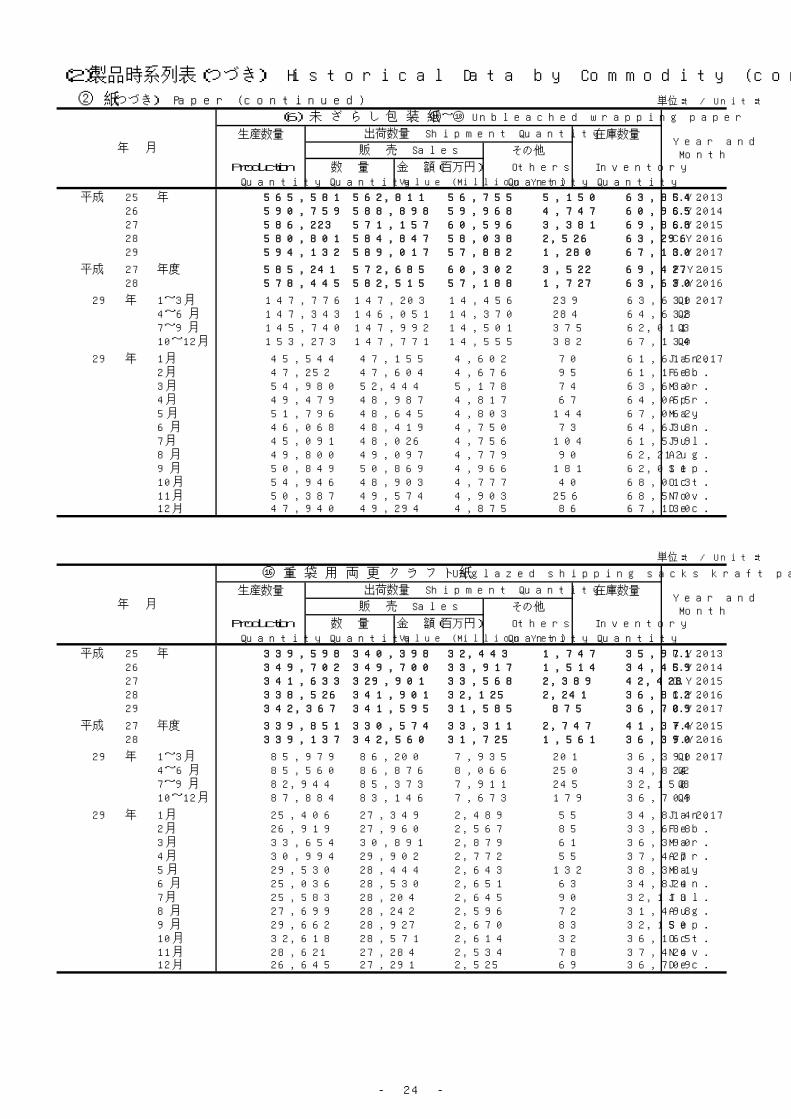
⑯ 重 袋 用 両 更 ク ラ フ ト 紙 Unglazed shipping sacks kraft paper
出荷数量 Shipment Quantity
販 売 Sales
年 月
(6) 未 ざ ら し 包 装 紙 ⑯~⑱ Unbleached wrapping paper
Year andMonth
出荷数量 Shipment Quantity
販 売 Sales
- 25 -
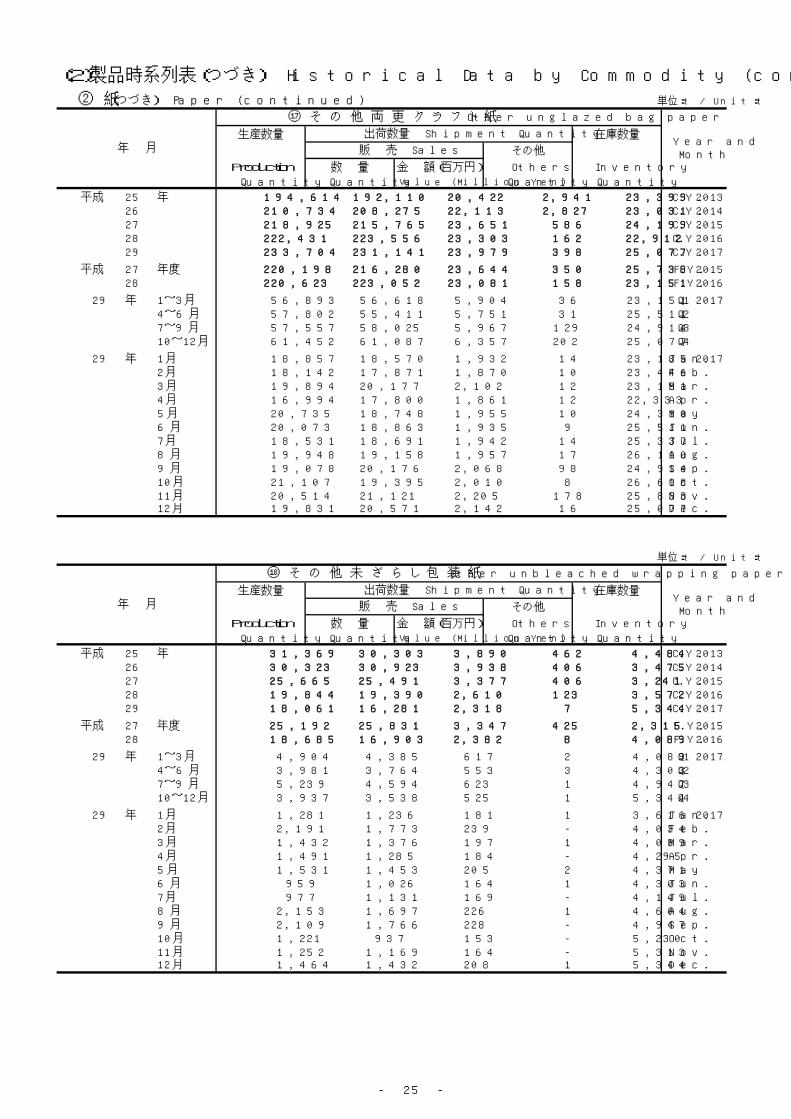
(2)製品時系列表(つづき) Historical Data by Commodity (continued)
② 紙(つづき) Paper (continued) 単位:t / Unit:t
生産数量 在庫数量
その他
Production 数 量 金 額(百万円) Others Inventory
Quantity Quantity Value (Million Yen) Quantity Quantity
平成 25 年 194,614 192,110 20,422 2,941 23,399 C.Y. 201326 210,734 208,275 22,113 2,827 23,031 C.Y. 201427 218,925 215,765 23,651 586 24,199 C.Y. 201528 222,431 223,556 23,303 162 22,912 C.Y. 201629 233,704 231,141 23,979 398 25,077 C.Y. 2017
平成 27 年度 220,198 216,280 23,644 350 25,738 F.Y. 201528 220,623 223,052 23,081 158 23,151 F.Y. 2016
29 年 1~3月 56,893 56,618 5,904 36 23,151 Q1 20174~6月 57,802 55,411 5,751 31 25,511 Q27~9月 57,557 58,025 5,967 129 24,914 Q310~12月 61,452 61,087 6,357 202 25,077 Q4
29 年 1月 18,857 18,570 1,932 14 23,185 Jan. 20172月 18,142 17,871 1,870 10 23,446 Feb.3月 19,894 20,177 2,102 12 23,151 Mar.4月 16,994 17,800 1,861 12 22,333 Apr.5月 20,735 18,748 1,955 10 24,310 May 6月 20,073 18,863 1,935 9 25,511 Jun.7月 18,531 18,691 1,942 14 25,337 Jul.8月 19,948 19,158 1,957 17 26,110 Aug.9月 19,078 20,176 2,068 98 24,914 Sep.10月 21,107 19,395 2,010 8 26,618 Oct.11月 20,514 21,121 2,205 178 25,833 Nov.12月 19,831 20,571 2,142 16 25,077 Dec.
単位:t / Unit:t
生産数量 在庫数量
その他
Production 数 量 金 額(百万円) Others Inventory
Quantity Quantity Value (Million Yen) Quantity Quantity
平成 25 年 31,369 30,303 3,890 462 4,484 C.Y. 201326 30,323 30,923 3,938 406 3,475 C.Y. 201427 25,665 25,491 3,377 406 3,241 C.Y. 201528 19,844 19,390 2,610 123 3,572 C.Y. 201629 18,061 16,281 2,318 7 5,344 C.Y. 2017
平成 27 年度 25,192 25,831 3,347 425 2,315 F.Y. 201528 18,685 16,903 2,382 8 4,089 F.Y. 2016
29 年 1~3月 4,904 4,385 617 2 4,089 Q1 20174~6月 3,981 3,764 553 3 4,303 Q27~9月 5,239 4,594 623 1 4,947 Q310~12月 3,937 3,538 525 1 5,344 Q4
29 年 1月 1,281 1,236 181 1 3,616 Jan. 20172月 2,191 1,773 239 - 4,034 Feb.3月 1,432 1,376 197 1 4,089 Mar.4月 1,491 1,285 184 - 4,295 Apr.5月 1,531 1,453 205 2 4,371 May 6月 959 1,026 164 1 4,303 Jun.7月 977 1,131 169 - 4,149 Jul.8月 2,153 1,697 226 1 4,604 Aug.9月 2,109 1,766 228 - 4,947 Sep.10月 1,221 937 153 - 5,230 Oct.11月 1,252 1,169 164 - 5,313 Nov.12月 1,464 1,432 208 1 5,344 Dec.
年 月
⑱ そ の 他 未 ざ ら し 包 装 紙 Other unbleached wrapping paper
Year andMonth
出荷数量 Shipment Quantity
販 売 Sales
年 月
⑰ そ の 他 両 更 ク ラ フ ト 紙 Other unglazed bag paper
Year andMonth
出荷数量 Shipment Quantity
販 売 Sales
- 26 -
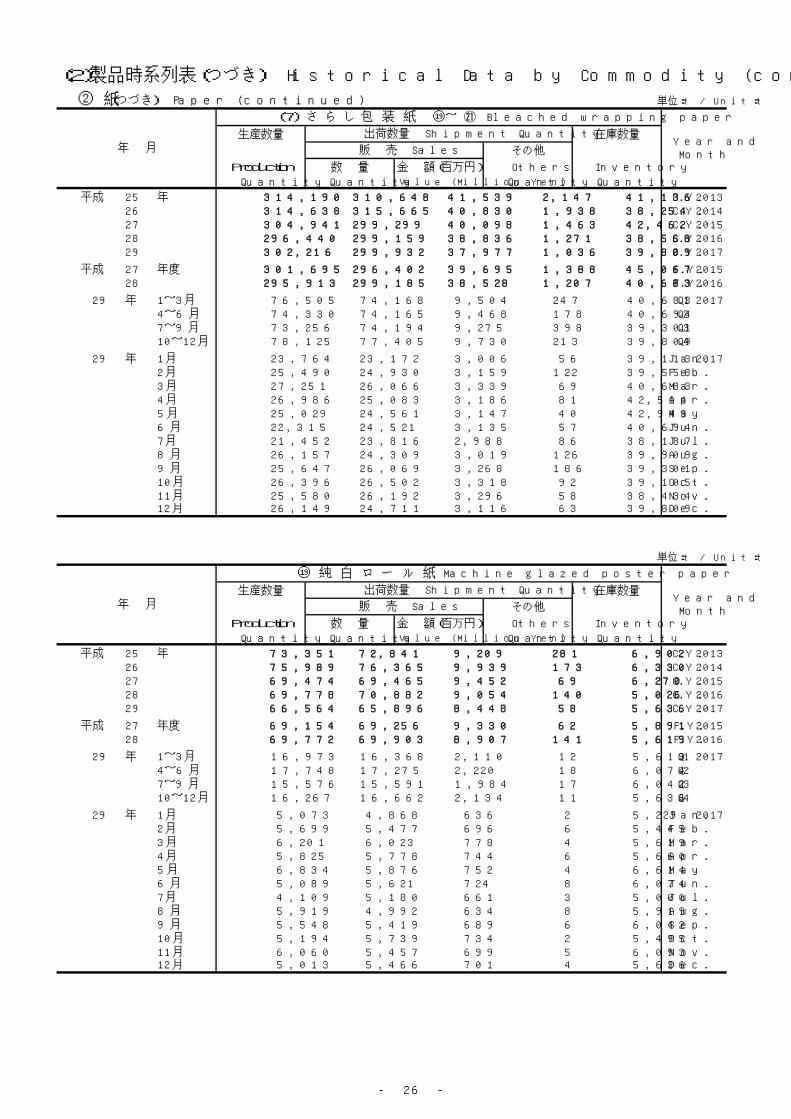
(2)製品時系列表(つづき) Historical Data by Commodity (continued)
② 紙(つづき) Paper (continued) 単位:t / Unit:t
生産数量 在庫数量
その他
Production 数 量 金 額(百万円) Others Inventory
Quantity Quantity Value (Million Yen) Quantity Quantity
平成 25 年 314,190 310,648 41,539 2,147 41,136 C.Y. 201326 314,638 315,665 40,830 1,938 38,254 C.Y. 201427 304,941 299,299 40,098 1,463 42,462 C.Y. 201528 296,440 299,159 38,836 1,271 38,568 C.Y. 201629 302,216 299,932 37,977 1,036 39,809 C.Y. 2017
平成 27 年度 301,695 296,402 39,695 1,388 45,067 F.Y. 201528 295,913 299,185 38,528 1,207 40,683 F.Y. 2016
29 年 1~3月 76,505 74,168 9,504 247 40,683 Q1 20174~6月 74,330 74,165 9,468 178 40,694 Q27~9月 73,256 74,194 9,275 398 39,301 Q310~12月 78,125 77,405 9,730 213 39,809 Q4
29 年 1月 23,764 23,172 3,006 56 39,113 Jan. 20172月 25,490 24,930 3,159 122 39,558 Feb.3月 27,251 26,066 3,339 69 40,683 Mar.4月 26,986 25,083 3,186 81 42,514 Apr.5月 25,029 24,561 3,147 40 42,949 May 6月 22,315 24,521 3,135 57 40,694 Jun.7月 21,452 23,816 2,988 86 38,187 Jul.8月 26,157 24,309 3,019 126 39,909 Aug.9月 25,647 26,069 3,268 186 39,301 Sep.10月 26,396 26,502 3,318 92 39,105 Oct.11月 25,580 26,192 3,296 58 38,434 Nov.12月 26,149 24,711 3,116 63 39,809 Dec.
単位:t / Unit:t
生産数量 在庫数量
その他
Production 数 量 金 額(百万円) Others Inventory
Quantity Quantity Value (Million Yen) Quantity Quantity
平成 25 年 73,351 72,841 9,209 281 6,902 C.Y. 201326 75,989 76,365 9,939 173 6,330 C.Y. 201427 69,474 69,465 9,452 69 6,270 C.Y. 201528 69,778 70,882 9,054 140 5,026 C.Y. 201629 66,564 65,896 8,448 58 5,636 C.Y. 2017
平成 27 年度 69,154 69,256 9,330 62 5,891 F.Y. 201528 69,772 69,903 8,907 141 5,619 F.Y. 2016
29 年 1~3月 16,973 16,368 2,110 12 5,619 Q1 20174~6月 17,748 17,275 2,220 18 6,074 Q27~9月 15,576 15,591 1,984 17 6,042 Q310~12月 16,267 16,662 2,134 11 5,636 Q4
29 年 1月 5,073 4,868 636 2 5,229 Jan. 20172月 5,699 5,477 696 6 5,445 Feb.3月 6,201 6,023 778 4 5,619 Mar.4月 5,825 5,778 744 6 5,660 Apr.5月 6,834 5,876 752 4 6,614 May 6月 5,089 5,621 724 8 6,074 Jun.7月 4,109 5,180 661 3 5,000 Jul.8月 5,919 4,992 634 8 5,919 Aug.9月 5,548 5,419 689 6 6,042 Sep.10月 5,194 5,739 734 2 5,495 Oct.11月 6,060 5,457 699 5 6,093 Nov.12月 5,013 5,466 701 4 5,636 Dec.
Year andMonth
年 月
⑲ 純 白 ロ ー ル 紙 Machine glazed poster paper
出荷数量 Shipment Quantity
販 売 Sales
年 月
(7) さ ら し 包 装 紙 ⑲~ ㉑ Bleached wrapping paper
Year andMonth
出荷数量 Shipment Quantity
販 売 Sales
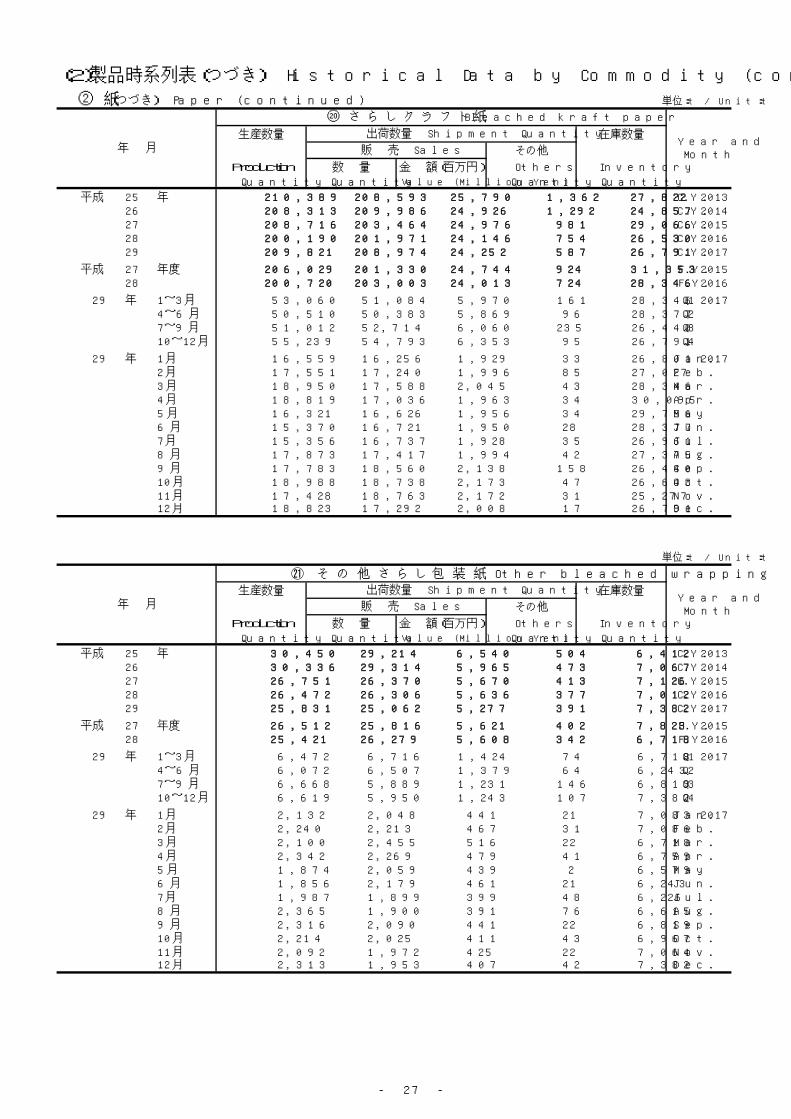
- 27 -
(2)製品時系列表(つづき) Historical Data by Commodity (continued)
② 紙(つづき) Paper (continued) 単位:t / Unit:t
生産数量 在庫数量
その他
Production 数 量 金 額(百万円) Others Inventory
Quantity Quantity Value (Million Yen) Quantity Quantity
平成 25 年 210,389 208,593 25,790 1,362 27,822 C.Y. 201326 208,313 209,986 24,926 1,292 24,857 C.Y. 201427 208,716 203,464 24,976 981 29,066 C.Y. 201528 200,190 201,971 24,146 754 26,530 C.Y. 201629 209,821 208,974 24,252 587 26,791 C.Y. 2017
平成 27 年度 206,029 201,330 24,744 924 31,353 F.Y. 201528 200,720 203,003 24,013 724 28,346 F.Y. 2016
29 年 1~3月 53,060 51,084 5,970 161 28,346 Q1 20174~6月 50,510 50,383 5,869 96 28,377 Q27~9月 51,012 52,714 6,060 235 26,440 Q310~12月 55,239 54,793 6,353 95 26,791 Q4
29 年 1月 16,559 16,256 1,929 33 26,801 Jan. 20172月 17,551 17,240 1,996 85 27,027 Feb.3月 18,950 17,588 2,045 43 28,346 Mar.4月 18,819 17,036 1,963 34 30,095 Apr.5月 16,321 16,626 1,956 34 29,756 May 6月 15,370 16,721 1,950 28 28,377 Jun.7月 15,356 16,737 1,928 35 26,961 Jul.8月 17,873 17,417 1,994 42 27,375 Aug.9月 17,783 18,560 2,138 158 26,440 Sep.10月 18,988 18,738 2,173 47 26,643 Oct.11月 17,428 18,763 2,172 31 25,277 Nov.12月 18,823 17,292 2,008 17 26,791 Dec.
単位:t / Unit:t
㉑ そ の 他 さ ら し 包 装 紙 Other bleached wrapping
生産数量 在庫数量
その他
Production 数 量 金 額(百万円) Others Inventory
Quantity Quantity Value (Million Yen) Quantity Quantity
平成 25 年 30,450 29,214 6,540 504 6,412 C.Y. 201326 30,336 29,314 5,965 473 7,067 C.Y. 201427 26,751 26,370 5,670 413 7,126 C.Y. 201528 26,472 26,306 5,636 377 7,012 C.Y. 201629 25,831 25,062 5,277 391 7,382 C.Y. 2017
平成 27 年度 26,512 25,816 5,621 402 7,823 F.Y. 201528 25,421 26,279 5,608 342 6,718 F.Y. 2016
29 年 1~3月 6,472 6,716 1,424 74 6,718 Q1 20174~6月 6,072 6,507 1,379 64 6,243 Q27~9月 6,668 5,889 1,231 146 6,819 Q310~12月 6,619 5,950 1,243 107 7,382 Q4
29 年 1月 2,132 2,048 441 21 7,083 Jan. 20172月 2,240 2,213 467 31 7,086 Feb.3月 2,100 2,455 516 22 6,718 Mar.4月 2,342 2,269 479 41 6,759 Apr.5月 1,874 2,059 439 2 6,579 May 6月 1,856 2,179 461 21 6,243 Jun.7月 1,987 1,899 399 48 6,226 Jul.8月 2,365 1,900 391 76 6,615 Aug.9月 2,316 2,090 441 22 6,819 Sep.10月 2,214 2,025 411 43 6,967 Oct.11月 2,092 1,972 425 22 7,064 Nov.12月 2,313 1,953 407 42 7,382 Dec.
年 月Year andMonth
出荷数量 Shipment Quantity
販 売 Sales
年 月
⑳ さ ら し ク ラ フ ト 紙 Bleached kraft paper
Year andMonth
出荷数量 Shipment Quantity
販 売 Sales
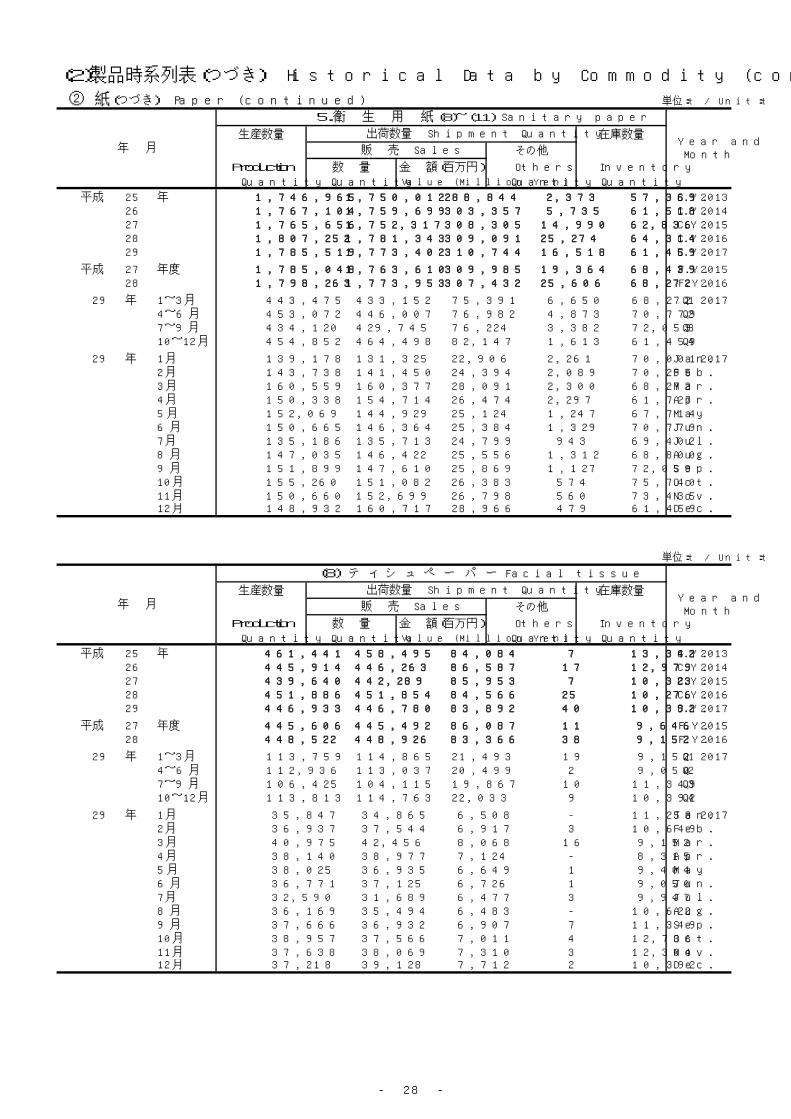
- 28 -
(2)製品時系列表(つづき) Historical Data by Commodity (continued)
② 紙(つづき) Paper (continued) 単位:t / Unit:t
生産数量 在庫数量
その他
Production 数 量 金 額(百万円) Others Inventory
Quantity Quantity Value (Million Yen) Quantity Quantity
平成 25 年 1,746,965 1,750,012 288,844 2,373 57,369 C.Y. 201326 1,767,104 1,759,699 303,357 5,735 61,518 C.Y. 201427 1,765,656 1,752,317 308,305 14,990 62,836 C.Y. 201528 1,807,252 1,781,343 309,091 25,274 64,314 C.Y. 201629 1,785,519 1,773,402 310,744 16,518 61,459 C.Y. 2017
平成 27 年度 1,785,048 1,763,610 309,985 19,364 68,439 F.Y. 201528 1,798,263 1,773,953 307,432 25,606 68,272 F.Y. 2016
29 年 1~3月 443,475 433,152 75,391 6,650 68,272 Q1 20174~6月 453,072 446,007 76,982 4,873 70,779 Q27~9月 434,120 429,745 76,224 3,382 72,059 Q310~12月 454,852 464,498 82,147 1,613 61,459 Q4
29 年 1月 139,178 131,325 22,906 2,261 70,001 Jan. 20172月 143,738 141,450 24,394 2,089 70,295 Feb.3月 160,559 160,377 28,091 2,300 68,272 Mar.4月 150,338 154,714 26,474 2,297 61,727 Apr.5月 152,069 144,929 25,124 1,247 67,714 May 6月 150,665 146,364 25,384 1,329 70,779 Jun.7月 135,186 135,713 24,799 943 69,402 Jul.8月 147,035 146,422 25,556 1,312 68,800 Aug.9月 151,899 147,610 25,869 1,127 72,059 Sep.10月 155,260 151,082 26,383 574 75,740 Oct.11月 150,660 152,699 26,798 560 73,435 Nov.12月 148,932 160,717 28,966 479 61,459 Dec.
単位:t / Unit:t
生産数量 在庫数量
その他
Production 数 量 金 額(百万円) Others Inventory
Quantity Quantity Value (Million Yen) Quantity Quantity
平成 25 年 461,441 458,495 84,084 7 13,342 C.Y. 201326 445,914 446,263 86,587 17 12,979 C.Y. 201427 439,640 442,289 85,953 7 10,323 C.Y. 201528 451,886 451,854 84,566 25 10,276 C.Y. 201629 446,933 446,780 83,892 40 10,392 C.Y. 2017
平成 27 年度 445,606 445,492 86,087 11 9,646 F.Y. 201528 448,522 448,926 83,366 38 9,152 F.Y. 2016
29 年 1~3月 113,759 114,865 21,493 19 9,152 Q1 20174~6月 112,936 113,037 20,499 2 9,050 Q27~9月 106,425 104,115 19,867 10 11,349 Q310~12月 113,813 114,763 22,033 9 10,392 Q4
29 年 1月 35,847 34,865 6,508 - 11,258 Jan. 20172月 36,937 37,544 6,917 3 10,649 Feb.3月 40,975 42,456 8,068 16 9,152 Mar.4月 38,140 38,977 7,124 - 8,315 Apr.5月 38,025 36,935 6,649 1 9,404 May 6月 36,771 37,125 6,726 1 9,050 Jun.7月 32,590 31,689 6,477 3 9,947 Jul.8月 36,169 35,494 6,483 - 10,622 Aug.9月 37,666 36,932 6,907 7 11,349 Sep.10月 38,957 37,566 7,011 4 12,736 Oct.11月 37,638 38,069 7,310 3 12,304 Nov.12月 37,218 39,128 7,712 2 10,392 Dec.
年 月
(8) テ ィ シ ュ ペ ー パ ー Facial tissue
Year andMonth
出荷数量 Shipment Quantity
販 売 Sales
年 月
5.衛 生 用 紙 (8)~(11) Sanitary paper
Year andMonth
出荷数量 Shipment Quantity
販 売 Sales
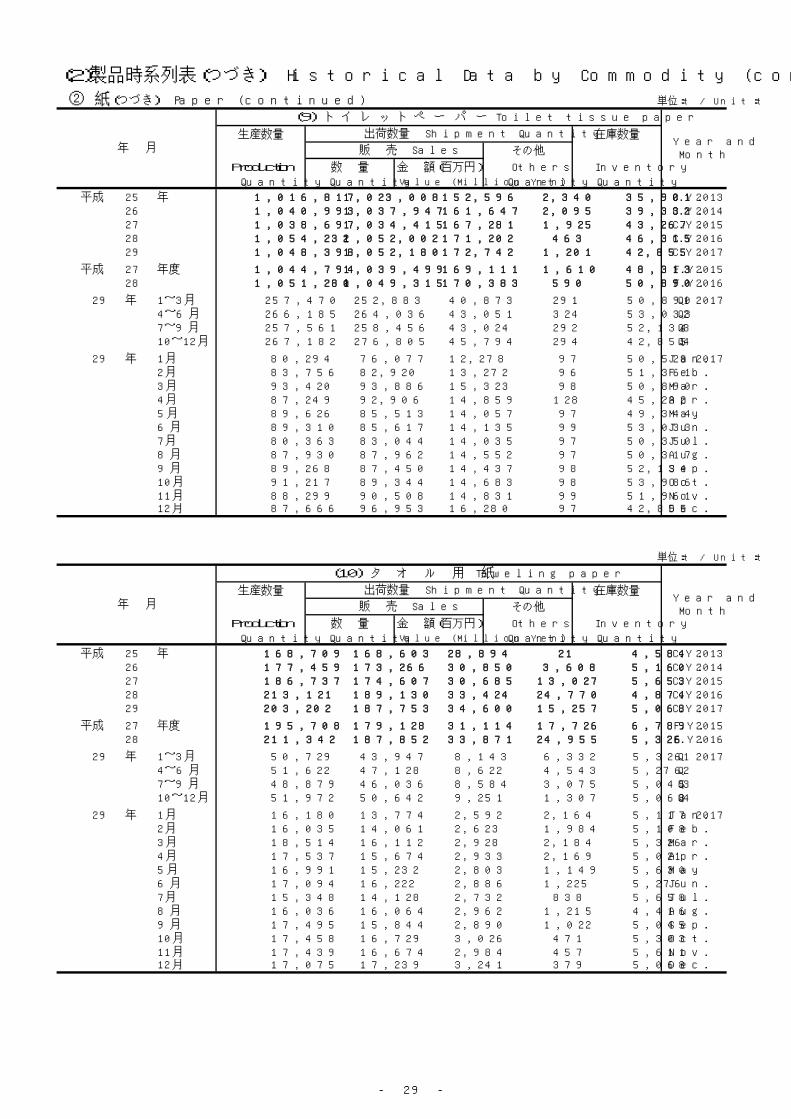
- 29 -
(2)製品時系列表(つづき) Historical Data by Commodity (continued)
② 紙(つづき) Paper (continued) 単位:t / Unit:t
生産数量 在庫数量
その他
Production 数 量 金 額(百万円) Others Inventory
Quantity Quantity Value (Million Yen) Quantity Quantity
平成 25 年 1,016,817 1,023,008 152,596 2,340 35,901 C.Y. 201326 1,040,993 1,037,947 161,647 2,095 39,332 C.Y. 201427 1,038,697 1,034,415 167,281 1,925 43,267 C.Y. 201528 1,054,232 1,052,002 171,202 463 46,315 C.Y. 201629 1,048,398 1,052,180 172,742 1,201 42,855 C.Y. 2017
平成 27 年度 1,044,794 1,039,499 169,111 1,610 48,313 F.Y. 201528 1,051,280 1,049,315 170,383 590 50,890 F.Y. 2016
29 年 1~3月 257,470 252,883 40,873 291 50,890 Q1 20174~6月 266,185 264,036 43,051 324 53,033 Q27~9月 257,561 258,456 43,024 292 52,134 Q310~12月 267,182 276,805 45,794 294 42,855 Q4
29 年 1月 80,294 76,077 12,278 97 50,528 Jan. 20172月 83,756 82,920 13,272 96 51,361 Feb.3月 93,420 93,886 15,323 98 50,890 Mar.4月 87,249 92,906 14,859 128 45,232 Apr.5月 89,626 85,513 14,057 97 49,344 May 6月 89,310 85,617 14,135 99 53,033 Jun.7月 80,363 83,044 14,035 97 50,350 Jul.8月 87,930 87,962 14,552 97 50,317 Aug.9月 89,268 87,450 14,437 98 52,134 Sep.10月 91,217 89,344 14,683 98 53,986 Oct.11月 88,299 90,508 14,831 99 51,961 Nov.12月 87,666 96,953 16,280 97 42,855 Dec.
単位:t / Unit:t
生産数量 在庫数量
その他
Production 数 量 金 額(百万円) Others Inventory
Quantity Quantity Value (Million Yen) Quantity Quantity
平成 25 年 168,709 168,603 28,894 21 4,584 C.Y. 201326 177,459 173,266 30,850 3,608 5,160 C.Y. 201427 186,737 174,607 30,685 13,027 5,653 C.Y. 201528 213,121 189,130 33,424 24,770 4,874 C.Y. 201629 203,202 187,753 34,600 15,257 5,068 C.Y. 2017
平成 27 年度 195,708 179,128 31,114 17,726 6,789 F.Y. 201528 211,342 187,852 33,871 24,955 5,326 F.Y. 2016
29 年 1~3月 50,729 43,947 8,143 6,332 5,326 Q1 20174~6月 51,622 47,128 8,622 4,543 5,276 Q27~9月 48,879 46,036 8,584 3,075 5,045 Q310~12月 51,972 50,642 9,251 1,307 5,068 Q4
29 年 1月 16,180 13,774 2,592 2,164 5,117 Jan. 20172月 16,035 14,061 2,623 1,984 5,108 Feb.3月 18,514 16,112 2,928 2,184 5,326 Mar.4月 17,537 15,674 2,933 2,169 5,021 Apr.5月 16,991 15,232 2,803 1,149 5,630 May 6月 17,094 16,222 2,886 1,225 5,276 Jun.7月 15,348 14,128 2,732 838 5,658 Jul.8月 16,036 16,064 2,962 1,215 4,416 Aug.9月 17,495 15,844 2,890 1,022 5,045 Sep.10月 17,458 16,729 3,026 471 5,303 Oct.11月 17,439 16,674 2,984 457 5,611 Nov.12月 17,075 17,239 3,241 379 5,068 Dec.
年 月
(10) タ オ ル 用 紙 Toweling paper
Year andMonth
出荷数量 Shipment Quantity
販 売 Sales
年 月
(9) ト イ レ ッ ト ペ ー パ ー Toilet tissue paper
Year andMonth
出荷数量 Shipment Quantity
販 売 Sales

- 30 -
(2)製品時系列表(つづき) Historical Data by Commodity (continued)
② 紙(つづき) Paper (continued) 単位:t / Unit:t
生産数量 在庫数量
その他
Production 数 量 金 額(百万円) Others Inventory
Quantity Quantity Value (Million Yen) Quantity Quantity
平成 25 年 99,998 99,906 23,270 5 3,542 C.Y. 201326 102,738 102,223 24,273 15 4,047 C.Y. 201427 100,582 101,006 24,386 31 3,593 C.Y. 201528 88,013 88,357 19,899 16 2,849 C.Y. 201629 86,986 86,689 19,510 20 3,144 C.Y. 2017
平成 27 年度 98,940 99,491 23,673 17 3,691 F.Y. 201528 87,119 87,860 19,812 23 2,904 F.Y. 2016
29 年 1~3月 21,517 21,457 4,882 8 2,904 Q1 20174~6月 22,329 21,806 4,810 4 3,420 Q27~9月 21,255 21,138 4,749 5 3,531 Q310~12月 21,885 22,288 5,069 3 3,144 Q4
29 年 1月 6,857 6,609 1,528 - 3,098 Jan. 20172月 7,010 6,925 1,582 6 3,177 Feb.3月 7,650 7,923 1,772 2 2,904 Mar.4月 7,412 7,157 1,558 - 3,159 Apr.5月 7,427 7,249 1,615 - 3,336 May 6月 7,490 7,400 1,637 4 3,420 Jun.7月 6,885 6,852 1,555 5 3,447 Jul.8月 6,900 6,902 1,559 - 3,445 Aug.9月 7,470 7,384 1,635 - 3,531 Sep.10月 7,628 7,443 1,663 1 3,715 Oct.11月 7,284 7,448 1,673 1 3,559 Nov.12月 6,973 7,397 1,733 1 3,144 Dec.
単位:t / Unit:t
生産数量 在庫数量
その他
Production 数 量 金 額(百万円) Others Inventory
Quantity Quantity Value (Million Yen) Quantity Quantity
平成 25 年 759,727 612,097 151,221 146,976 89,172 C.Y. 201326 820,829 669,573 162,776 144,460 96,768 C.Y. 201427 803,843 665,951 163,480 137,371 96,999 C.Y. 201528 806,591 691,121 165,272 118,708 94,320 C.Y. 201629 877,449 764,109 176,728 115,547 94,101 C.Y. 2017
平成 27 年度 806,677 673,978 163,762 133,568 96,543 F.Y. 201528 819,366 704,343 166,403 116,645 96,500 F.Y. 2016
29 年 1~3月 220,012 188,164 42,369 30,750 96,500 Q1 20174~6月 214,801 186,843 43,850 29,810 94,963 Q27~9月 218,244 189,408 43,815 27,448 96,581 Q310~12月 224,392 199,694 46,694 27,539 94,101 Q4
29 年 1月 73,419 61,671 13,593 10,734 96,260 Jan. 20172月 70,088 59,681 13,659 10,415 96,327 Feb.3月 76,505 66,812 15,117 9,601 96,500 Mar.4月 74,661 61,851 14,515 9,928 99,465 Apr.5月 69,050 61,105 14,204 9,823 97,693 May 6月 71,090 63,887 15,131 10,059 94,963 Jun.7月 71,200 64,792 15,050 10,030 91,375 Jul.8月 71,859 60,966 13,944 8,598 93,791 Aug.9月 75,185 63,650 14,821 8,820 96,581 Sep.10月 77,246 65,550 15,252 9,499 98,883 Oct.11月 73,186 66,759 15,815 9,517 95,938 Nov.12月 73,960 67,385 15,627 8,523 94,101 Dec.
年 月
6.雑 種 紙 (12)+(13) Miscellaneous paper
Year andMonth
出荷数量 Shipment Quantity
販 売 Sales
年 月
(11) そ の 他 衛 生 用 紙 Other sanitary paper
Year andMonth
出荷数量 Shipment Quantity
販 売 Sales
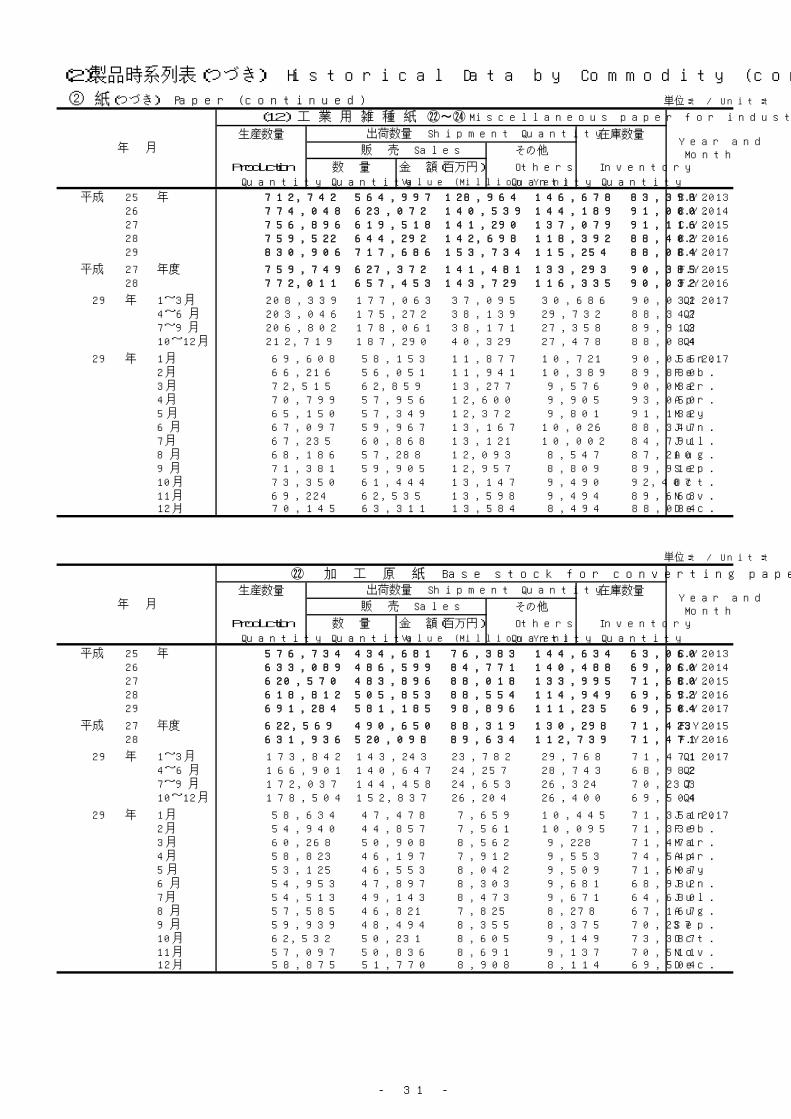
- 31 -
(2)製品時系列表(つづき) Historical Data by Commodity (continued)
② 紙(つづき) Paper (continued) 単位:t / Unit:t
生産数量 在庫数量
その他
Production 数 量 金 額(百万円) Others Inventory
Quantity Quantity Value (Million Yen) Quantity Quantity
平成 25 年 712,742 564,997 128,964 146,678 83,398 C.Y. 201326 774,048 623,072 140,539 144,189 91,000 C.Y. 201427 756,896 619,518 141,290 137,079 91,116 C.Y. 201528 759,522 644,292 142,698 118,392 88,402 C.Y. 201629 830,906 717,686 153,734 115,254 88,084 C.Y. 2017
平成 27 年度 759,749 627,372 141,481 133,293 90,385 F.Y. 201528 772,011 657,453 143,729 116,335 90,032 F.Y. 2016
29 年 1~3月 208,339 177,063 37,095 30,686 90,032 Q1 20174~6月 203,046 175,272 38,139 29,732 88,347 Q27~9月 206,802 178,061 38,171 27,358 89,912 Q310~12月 212,719 187,290 40,329 27,478 88,084 Q4
29 年 1月 69,608 58,153 11,877 10,721 90,055 Jan. 20172月 66,216 56,051 11,941 10,389 89,880 Feb.3月 72,515 62,859 13,277 9,576 90,032 Mar.4月 70,799 57,956 12,600 9,905 93,050 Apr.5月 65,150 57,349 12,372 9,801 91,132 May 6月 67,097 59,967 13,167 10,026 88,347 Jun.7月 67,235 60,868 13,121 10,002 84,791 Jul.8月 68,186 57,288 12,093 8,547 87,210 Aug.9月 71,381 59,905 12,957 8,809 89,912 Sep.10月 73,350 61,444 13,147 9,490 92,407 Oct.11月 69,224 62,535 13,598 9,494 89,663 Nov.12月 70,145 63,311 13,584 8,494 88,084 Dec.
単位:t / Unit:t
㉒ 加 工 原 紙 Base stock for converting paper
生産数量 在庫数量
その他
Production 数 量 金 額(百万円) Others Inventory
Quantity Quantity Value (Million Yen) Quantity Quantity
平成 25 年 576,734 434,681 76,383 144,634 63,060 C.Y. 201326 633,089 486,599 84,771 140,488 69,060 C.Y. 201427 620,570 483,896 88,018 133,995 71,680 C.Y. 201528 618,812 505,853 88,554 114,949 69,692 C.Y. 201629 691,284 581,185 98,896 111,235 69,504 C.Y. 2017
平成 27 年度 622,569 490,650 88,319 130,298 71,423 F.Y. 201528 631,936 520,098 89,634 112,739 71,471 F.Y. 2016
29 年 1~3月 173,842 143,243 23,782 29,768 71,471 Q1 20174~6月 166,901 140,647 24,257 28,743 68,982 Q27~9月 172,037 144,458 24,653 26,324 70,237 Q310~12月 178,504 152,837 26,204 26,400 69,504 Q4
29 年 1月 58,634 47,478 7,659 10,445 71,351 Jan. 20172月 54,940 44,857 7,561 10,095 71,339 Feb.3月 60,268 50,908 8,562 9,228 71,471 Mar.4月 58,823 46,197 7,912 9,553 74,544 Apr.5月 53,125 46,553 8,042 9,509 71,607 May 6月 54,953 47,897 8,303 9,681 68,982 Jun.7月 54,513 49,143 8,473 9,671 64,680 Jul.8月 57,585 46,821 7,825 8,278 67,167 Aug.9月 59,939 48,494 8,355 8,375 70,237 Sep.10月 62,532 50,231 8,605 9,149 73,387 Oct.11月 57,097 50,836 8,691 9,137 70,511 Nov.12月 58,875 51,770 8,908 8,114 69,504 Dec.
販 売 Sales
出荷数量 Shipment Quantity
年 月Year andMonth
年 月
(12) 工 業 用 雑 種 紙 ㉒~㉔ Miscellaneous paper for industry
Year andMonth
出荷数量 Shipment Quantity
販 売 Sales
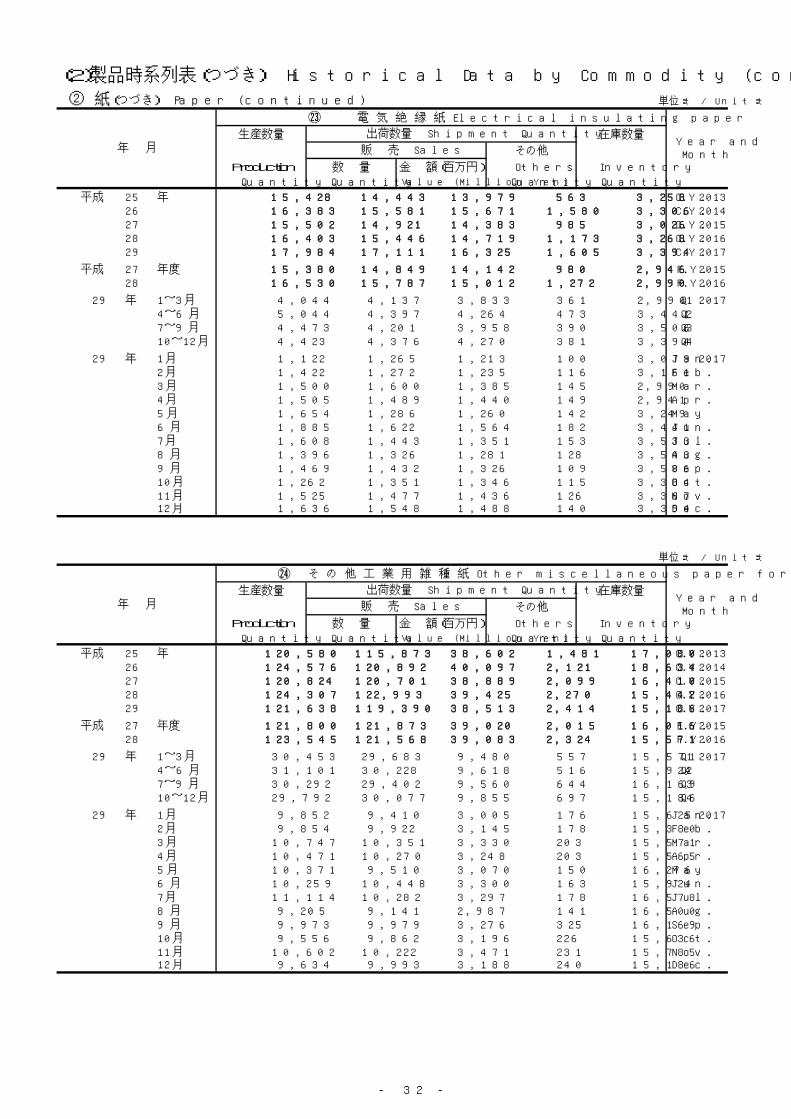
- 32 -
(2)製品時系列表(つづき) Historical Data by Commodity (continued)
② 紙(つづき) Paper (continued) 単位:t / Unit:t
㉓ 電 気 絶 縁 紙 Electrical insulating paper
生産数量 在庫数量
その他
Production 数 量 金 額(百万円) Others Inventory
Quantity Quantity Value (Million Yen) Quantity Quantity
平成 25 年 15,428 14,443 13,979 563 3,258 C.Y. 201326 16,383 15,581 15,671 1,580 3,306 C.Y. 201427 15,502 14,921 14,383 985 3,026 C.Y. 201528 16,403 15,446 14,719 1,173 3,268 C.Y. 201629 17,984 17,111 16,325 1,605 3,394 C.Y. 2017
平成 27 年度 15,380 14,849 14,142 980 2,946 F.Y. 201528 16,530 15,787 15,012 1,272 2,990 F.Y. 2016
29 年 1~3月 4,044 4,137 3,833 361 2,990 Q1 20174~6月 5,044 4,397 4,264 473 3,441 Q27~9月 4,473 4,201 3,958 390 3,506 Q310~12月 4,423 4,376 4,270 381 3,394 Q4
29 年 1月 1,122 1,265 1,213 100 3,079 Jan. 20172月 1,422 1,272 1,235 116 3,161 Feb.3月 1,500 1,600 1,385 145 2,990 Mar.4月 1,505 1,489 1,440 149 2,941 Apr.5月 1,654 1,286 1,260 142 3,249 May 6月 1,885 1,622 1,564 182 3,441 Jun.7月 1,608 1,443 1,351 153 3,533 Jul.8月 1,396 1,326 1,281 128 3,543 Aug.9月 1,469 1,432 1,326 109 3,506 Sep.10月 1,262 1,351 1,346 115 3,384 Oct.11月 1,525 1,477 1,436 126 3,367 Nov.12月 1,636 1,548 1,488 140 3,394 Dec.
単位:t / Unit:t
㉔ そ の 他 工 業 用 雑 種 紙 Other miscellaneous paper for industry
生産数量 在庫数量
その他
Production 数 量 金 額(百万円) Others Inventory
Quantity Quantity Value (Million Yen) Quantity Quantity
平成 25 年 120,580 115,873 38,602 1,481 17,080 C.Y. 201326 124,576 120,892 40,097 2,121 18,634 C.Y. 201427 120,824 120,701 38,889 2,099 16,410 C.Y. 201528 124,307 122,993 39,425 2,270 15,442 C.Y. 201629 121,638 119,390 38,513 2,414 15,186 C.Y. 2017
平成 27 年度 121,800 121,873 39,020 2,015 16,016 F.Y. 201528 123,545 121,568 39,083 2,324 15,571 F.Y. 2016
29 年 1~3月 30,453 29,683 9,480 557 15,571 Q1 20174~6月 31,101 30,228 9,618 516 15,924 Q27~9月 30,292 29,402 9,560 644 16,169 Q310~12月 29,792 30,077 9,855 697 15,186 Q4
29 年 1月 9,852 9,410 3,005 176 15,625 Jan. 20172月 9,854 9,922 3,145 178 15,380 Feb.3月 10,747 10,351 3,330 203 15,571 Mar.4月 10,471 10,270 3,248 203 15,565 Apr.5月 10,371 9,510 3,070 150 16,276 May 6月 10,259 10,448 3,300 163 15,924 Jun.7月 11,114 10,282 3,297 178 16,578 Jul.8月 9,205 9,141 2,987 141 16,500 Aug.9月 9,973 9,979 3,276 325 16,169 Sep.10月 9,556 9,862 3,196 226 15,636 Oct.11月 10,602 10,222 3,471 231 15,785 Nov.12月 9,634 9,993 3,188 240 15,186 Dec.
販 売 Sales
出荷数量 Shipment Quantity
年 月Year andMonth
販 売 Sales
出荷数量 Shipment Quantity
年 月Year andMonth
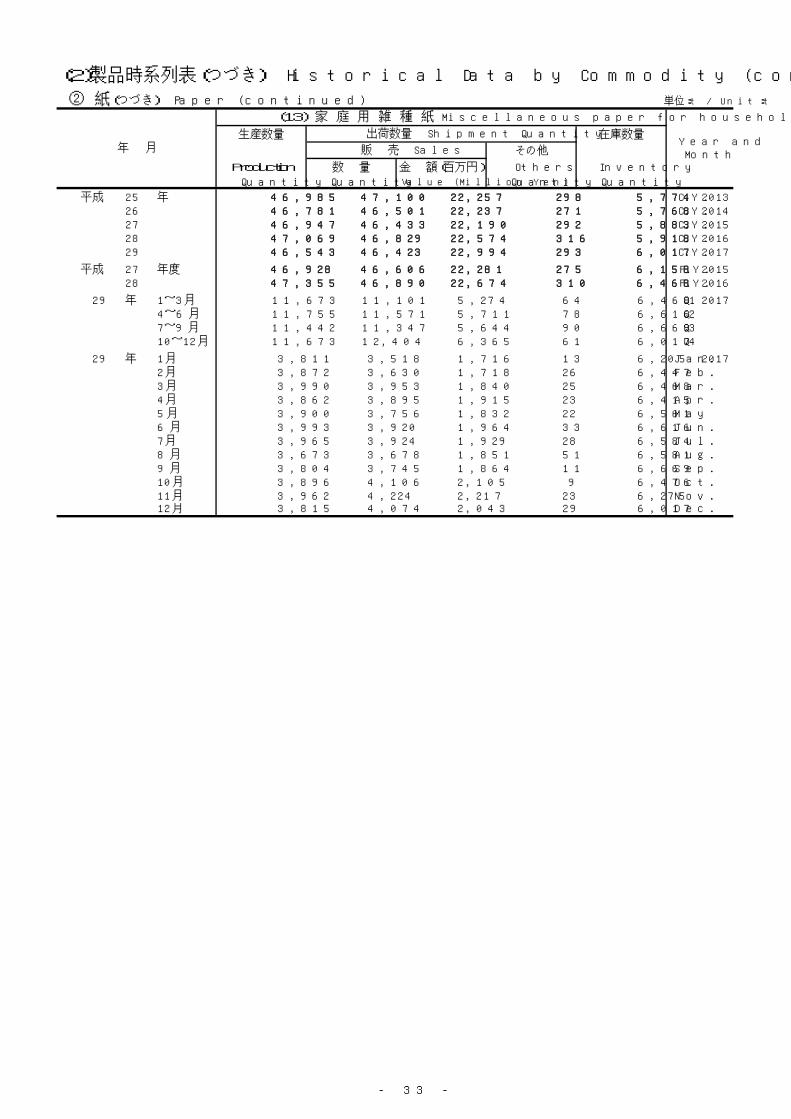
- 33 -
(2)製品時系列表(つづき) Historical Data by Commodity (continued)
② 紙(つづき) Paper (continued) 単位:t / Unit:t
生産数量 在庫数量
その他
Production 数 量 金 額(百万円) Others Inventory
Quantity Quantity Value (Million Yen) Quantity Quantity
平成 25 年 46,985 47,100 22,257 298 5,774 C.Y. 201326 46,781 46,501 22,237 271 5,768 C.Y. 201427 46,947 46,433 22,190 292 5,883 C.Y. 201528 47,069 46,829 22,574 316 5,918 C.Y. 201629 46,543 46,423 22,994 293 6,017 C.Y. 2017
平成 27 年度 46,928 46,606 22,281 275 6,158 F.Y. 201528 47,355 46,890 22,674 310 6,468 F.Y. 2016
29 年 1~3月 11,673 11,101 5,274 64 6,468 Q1 20174~6月 11,755 11,571 5,711 78 6,616 Q27~9月 11,442 11,347 5,644 90 6,669 Q310~12月 11,673 12,404 6,365 61 6,017 Q4
29 年 1月 3,811 3,518 1,716 13 6,205 Jan. 20172月 3,872 3,630 1,718 26 6,447 Feb.3月 3,990 3,953 1,840 25 6,468 Mar.4月 3,862 3,895 1,915 23 6,415 Apr.5月 3,900 3,756 1,832 22 6,561 May 6月 3,993 3,920 1,964 33 6,616 Jun.7月 3,965 3,924 1,929 28 6,584 Jul.8月 3,673 3,678 1,851 51 6,581 Aug.9月 3,804 3,745 1,864 11 6,669 Sep.10月 3,896 4,106 2,105 9 6,476 Oct.11月 3,962 4,224 2,217 23 6,275 Nov.12月 3,815 4,074 2,043 29 6,017 Dec.
販 売 Sales
出荷数量 Shipment Quantity
年 月
(13) 家 庭 用 雑 種 紙 Miscellaneous paper for household
Year andMonth
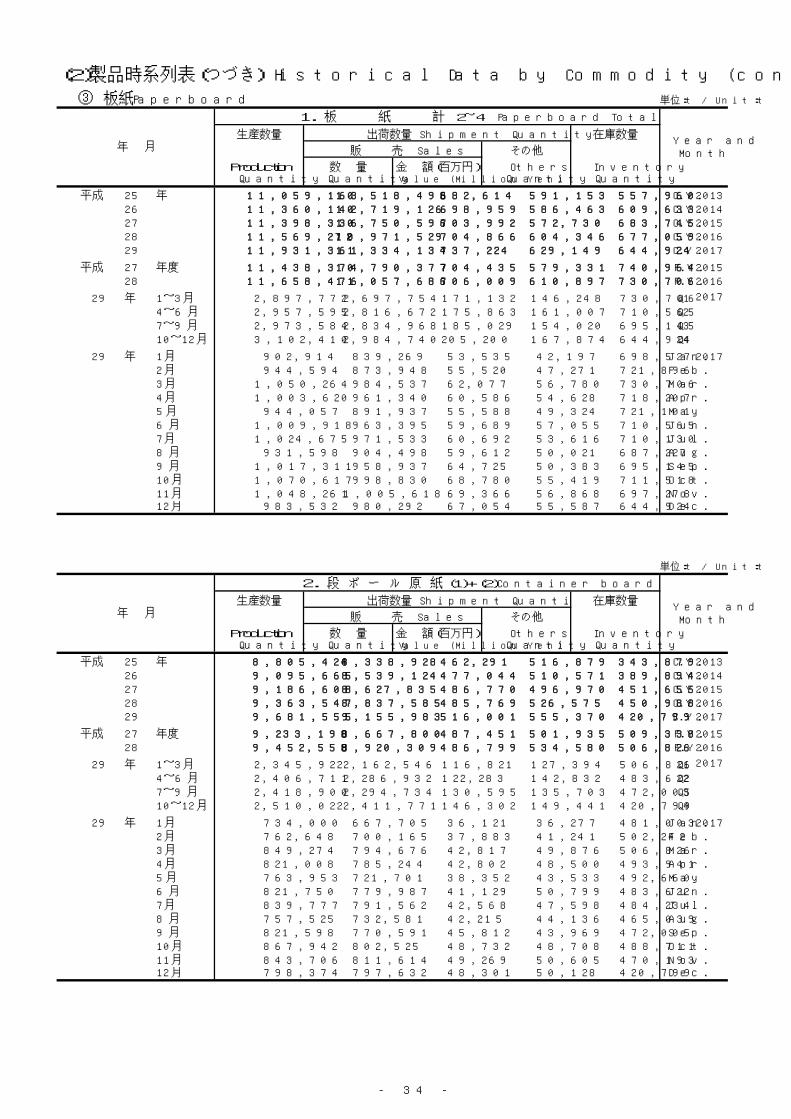
- 34 -
(2)製品時系列表(つづき) Historical Data by Commodity (continued)
③ 板紙 Paperboard 単位:t / Unit:t
生産数量 在庫数量
その他
Production 数 量 金 額(百万円) Others InventoryQuantity Quantity Value (Million Yen) Quantity Quantity
平成 25 年 11,059,163 10,518,498 682,614 591,153 557,960 C.Y. 201326 11,360,142 10,719,126 698,959 586,463 609,633 C.Y. 201427 11,398,336 10,750,596 703,992 572,730 683,745 C.Y. 201528 11,569,272 10,971,529 704,866 604,346 677,059 C.Y. 201629 11,931,361 11,334,134 737,224 629,149 644,924 C.Y. 2017
平成 27 年度 11,438,374 10,790,377 704,435 579,331 740,964 F.Y. 201528 11,658,476 11,057,686 706,009 610,897 730,706 F.Y. 2016
29 年 1~3月 2,897,772 2,697,754 171,132 146,248 730,706 Q1 2017
4~6月 2,957,595 2,816,672 175,863 161,007 710,565 Q27~9月 2,973,584 2,834,968 185,029 154,020 695,145 Q310~12月 3,102,410 2,984,740 205,200 167,874 644,924 Q4
29 年 1月 902,914 839,269 53,535 42,197 698,527 Jan. 20172月 944,594 873,948 55,520 47,271 721,896 Feb.3月 1,050,264 984,537 62,077 56,780 730,706 Mar.4月 1,003,620 961,340 60,586 54,628 718,207 Apr.5月 944,057 891,937 55,588 49,324 721,101 May 6月 1,009,918 963,395 59,689 57,055 710,565 Jun.7月 1,024,675 971,533 60,692 53,616 710,130 Jul.8月 931,598 904,498 59,612 50,021 687,227 Aug.9月 1,017,311 958,937 64,725 50,383 695,145 Sep.10月 1,070,617 998,830 68,780 55,419 711,518 Oct.11月 1,048,261 1,005,618 69,366 56,868 697,278 Nov.12月 983,532 980,292 67,054 55,587 644,924 Dec.
単位:t / Unit:t
生産数量 在庫数量
その他
Production 数 量 金 額(百万円) Others InventoryQuantity Quantity Value (Million Yen) Quantity Quantity
平成 25 年 8,805,424 8,338,928 462,291 516,879 343,879 C.Y. 201326 9,095,665 8,539,124 477,044 510,571 389,894 C.Y. 201427 9,186,608 8,627,835 486,770 496,970 451,655 C.Y. 201528 9,363,547 8,837,585 485,769 526,575 450,988 C.Y. 201629 9,681,555 9,155,983 516,001 555,370 420,799 C.Y. 2017
平成 27 年度 9,233,198 8,667,800 487,451 501,935 509,338 F.Y. 201528 9,452,558 8,920,309 486,799 534,580 506,826 F.Y. 2016
29 年 1~3月 2,345,922 2,162,546 116,821 127,394 506,826 Q1 2017
4~6月 2,406,711 2,286,932 122,283 142,832 483,622 Q27~9月 2,418,900 2,294,734 130,595 135,703 472,005 Q310~12月 2,510,022 2,411,771 146,302 149,441 420,799 Q4
29 年 1月 734,000 667,705 36,121 36,277 481,003 Jan. 20172月 762,648 700,165 37,883 41,241 502,242 Feb.3月 849,274 794,676 42,817 49,876 506,826 Mar.4月 821,008 785,244 42,802 48,500 493,941 Apr.5月 763,953 721,701 38,352 43,533 492,660 May 6月 821,750 779,987 41,129 50,799 483,622 Jun.7月 839,777 791,562 42,568 47,598 484,234 Jul.8月 757,525 732,581 42,215 44,136 465,039 Aug.9月 821,598 770,591 45,812 43,969 472,005 Sep.10月 867,942 802,525 48,732 48,708 488,711 Oct.11月 843,706 811,614 49,269 50,605 470,193 Nov.12月 798,374 797,632 48,301 50,128 420,799 Dec.
年 月
2. 段 ボ ー ル 原 紙 (1)+(2)Container board
Year andMonth
出荷数量 Shipment Quantity
販 売 Sales
年 月
1. 板 紙 計 2~4 Paperboard Total
Year andMonth
出荷数量 Shipment Quantity
販 売 Sales

- 35 -
(2)製品時系列表(つづき) Historical Data by Commodity (continued)
③ 板紙 (つづき) Paperboard (continued) 単位:t / Unit:t
生産数量 在庫数量
その他
Production 数 量 金 額(百万円) Others InventoryQuantity Quantity Value (Million Yen) Quantity Quantity
平成 25 年 5,258,819 4,971,620 289,280 305,118 229,233 C.Y. 201326 5,402,039 5,069,024 297,972 301,583 260,710 C.Y. 201427 5,458,603 5,121,224 304,234 295,056 302,991 C.Y. 201528 5,546,715 5,255,104 303,635 305,537 289,007 C.Y. 201629 5,778,317 5,458,203 321,791 322,688 286,099 C.Y. 2017
平成 27 年度 5,477,921 5,137,797 304,327 296,684 353,441 F.Y. 201528 5,589,216 5,299,777 303,888 310,125 332,570 F.Y. 2016
29 年 1~3月 1,391,629 1,273,166 72,387 74,756 332,570 Q1 2017
4~6月 1,418,937 1,373,950 76,883 81,215 296,191 Q27~9月 1,456,757 1,374,038 81,533 79,101 299,786 Q310~12月 1,510,994 1,437,049 90,988 87,616 286,099 Q4
29 年 1月 436,902 391,061 22,325 21,131 313,714 Jan. 20172月 450,707 412,929 23,571 24,166 327,323 Feb.3月 504,020 469,176 26,491 29,459 332,570 Mar.4月 489,191 476,271 26,996 28,323 317,018 Apr.5月 445,242 427,634 23,864 24,791 309,835 May 6月 484,504 470,045 26,023 28,101 296,191 Jun.7月 496,352 473,673 26,705 27,733 291,132 Jul.8月 465,805 438,449 26,461 25,842 292,643 Aug.9月 494,600 461,916 28,367 25,526 299,786 Sep.10月 522,030 474,695 30,066 28,561 318,557 Oct.11月 512,804 481,943 30,593 29,935 319,478 Nov.12月 476,160 480,411 30,329 29,120 286,099 Dec.
単位:t / Unit:t
生産数量 在庫数量
その他
Production 数 量 金 額(百万円) Others InventoryQuantity Quantity Value (Million Yen) Quantity Quantity
平成 25 年 3,781,770 3,543,473 212,285 252,813 174,493 C.Y. 201326 3,901,128 3,628,815 218,872 249,657 197,219 C.Y. 201427 3,899,703 3,629,390 221,479 243,146 224,368 C.Y. 201528 3,957,216 3,713,602 219,915 253,542 214,331 C.Y. 201629 4,127,640 3,864,217 233,179 267,399 210,325 C.Y. 2017
平成 27 年度 3,913,148 3,635,608 221,189 244,761 271,365 F.Y. 201528 3,975,471 3,747,799 220,280 256,520 242,480 F.Y. 2016
29 年 1~3月 992,254 903,349 52,790 60,742 242,480 Q1 2017
4~6月 1,004,270 970,718 55,636 68,239 207,789 Q27~9月 1,055,518 978,662 59,298 66,725 217,913 Q310~12月 1,075,598 1,011,488 65,455 71,693 210,325 Q4
29 年 1月 313,546 277,644 16,296 17,132 233,099 Jan. 20172月 320,993 294,131 17,183 19,685 240,275 Feb.3月 357,715 331,574 19,311 23,925 242,480 Mar.4月 348,596 338,176 19,598 22,989 229,909 Apr.5月 318,869 299,981 17,138 21,058 227,738 May 6月 336,805 332,561 18,900 24,192 207,789 Jun.7月 359,122 337,012 19,533 23,891 206,008 Jul.8月 342,728 312,472 19,214 21,631 214,631 Aug.9月 353,668 329,178 20,551 21,203 217,913 Sep.10月 372,644 336,222 21,769 23,343 230,992 Oct.11月 366,358 340,452 22,088 24,658 232,238 Nov.12月 336,596 334,814 21,598 23,692 210,325 Dec.
年 月
① 外 装 用 ( ク ラ フ ト ) Kraft liner board
Year andMonth
出荷数量 Shipment Quantity
販 売 Sales
年 月
(1) ラ イ ナ ー ①~③ Liner board
Year andMonth
出荷数量 Shipment Quantity
販 売 Sales
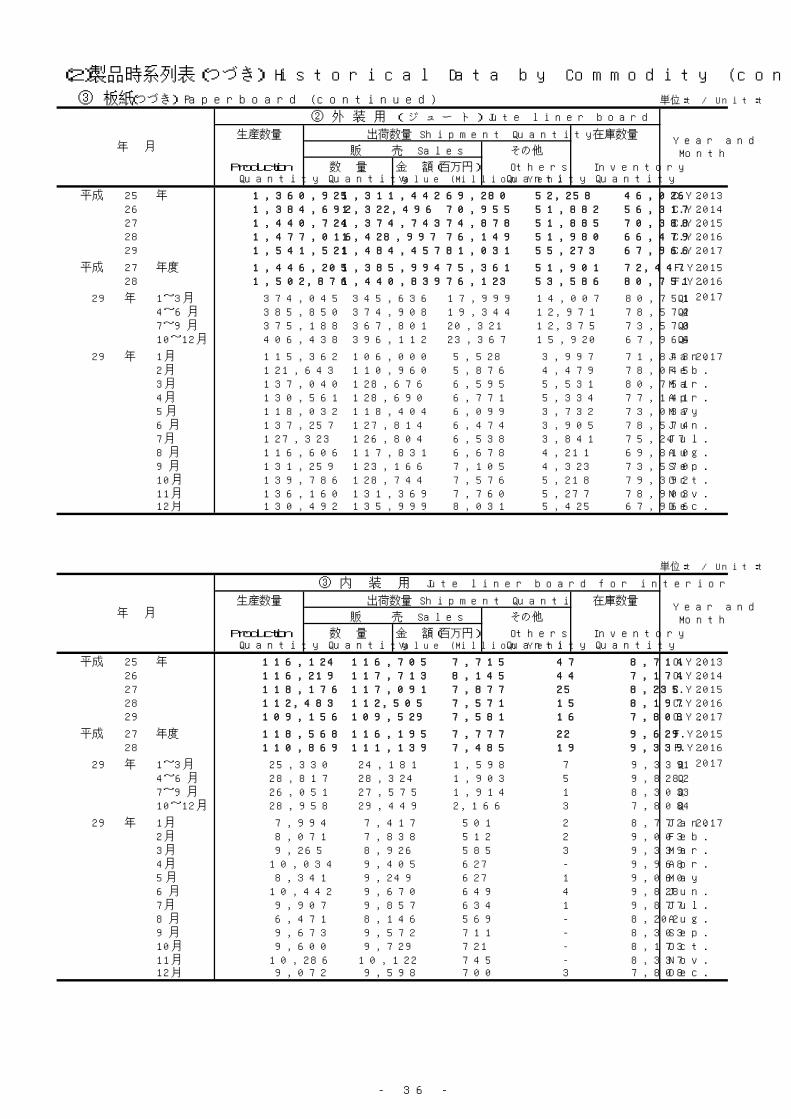
- 36 -
(2)製品時系列表(つづき) Historical Data by Commodity (continued)
③ 板紙 (つづき) Paperboard (continued) 単位:t / Unit:t
生産数量 在庫数量
その他
Production 数 量 金 額(百万円) Others InventoryQuantity Quantity Value (Million Yen) Quantity Quantity
平成 25 年 1,360,925 1,311,442 69,280 52,258 46,026 C.Y. 201326 1,384,692 1,322,496 70,955 51,882 56,317 C.Y. 201427 1,440,724 1,374,743 74,878 51,885 70,388 C.Y. 201528 1,477,016 1,428,997 76,149 51,980 66,479 C.Y. 201629 1,541,521 1,484,457 81,031 55,273 67,966 C.Y. 2017
平成 27 年度 1,446,205 1,385,994 75,361 51,901 72,447 F.Y. 201528 1,502,876 1,440,839 76,123 53,586 80,751 F.Y. 2016
29 年 1~3月 374,045 345,636 17,999 14,007 80,751 Q1 2017
4~6月 385,850 374,908 19,344 12,971 78,574 Q27~9月 375,188 367,801 20,321 12,375 73,570 Q310~12月 406,438 396,112 23,367 15,920 67,966 Q4
29 年 1月 115,362 106,000 5,528 3,997 71,843 Jan. 20172月 121,643 110,960 5,876 4,479 78,045 Feb.3月 137,040 128,676 6,595 5,531 80,751 Mar.4月 130,561 128,690 6,771 5,334 77,141 Apr.5月 118,032 118,404 6,099 3,732 73,037 May 6月 137,257 127,814 6,474 3,905 78,574 Jun.7月 127,323 126,804 6,538 3,841 75,247 Jul.8月 116,606 117,831 6,678 4,211 69,810 Aug.9月 131,259 123,166 7,105 4,323 73,570 Sep.10月 139,786 128,744 7,576 5,218 79,392 Oct.11月 136,160 131,369 7,760 5,277 78,903 Nov.12月 130,492 135,999 8,031 5,425 67,966 Dec.
単位:t / Unit:t
生産数量 在庫数量
その他
Production 数 量 金 額(百万円) Others InventoryQuantity Quantity Value (Million Yen) Quantity Quantity
平成 25 年 116,124 116,705 7,715 47 8,714 C.Y. 201326 116,219 117,713 8,145 44 7,174 C.Y. 201427 118,176 117,091 7,877 25 8,235 C.Y. 201528 112,483 112,505 7,571 15 8,197 C.Y. 201629 109,156 109,529 7,581 16 7,808 C.Y. 2017
平成 27 年度 118,568 116,195 7,777 22 9,629 F.Y. 201528 110,869 111,139 7,485 19 9,339 F.Y. 2016
29 年 1~3月 25,330 24,181 1,598 7 9,339 Q1 2017
4~6月 28,817 28,324 1,903 5 9,828 Q27~9月 26,051 27,575 1,914 1 8,303 Q310~12月 28,958 29,449 2,166 3 7,808 Q4
29 年 1月 7,994 7,417 501 2 8,772 Jan. 20172月 8,071 7,838 512 2 9,003 Feb.3月 9,265 8,926 585 3 9,339 Mar.4月 10,034 9,405 627 - 9,968 Apr.5月 8,341 9,249 627 1 9,060 May 6月 10,442 9,670 649 4 9,828 Jun.7月 9,907 9,857 634 1 9,877 Jul.8月 6,471 8,146 569 - 8,202 Aug.9月 9,673 9,572 711 - 8,303 Sep.10月 9,600 9,729 721 - 8,173 Oct.11月 10,286 10,122 745 - 8,337 Nov.12月 9,072 9,598 700 3 7,808 Dec.
年 月
③ 内 装 用 Jute liner board for interior
Year andMonth
出荷数量 Shipment Quantity
販 売 Sales
年 月
② 外 装 用 ( ジ ュ ー ト ) Jute liner board
Year andMonth
出荷数量 Shipment Quantity
販 売 Sales
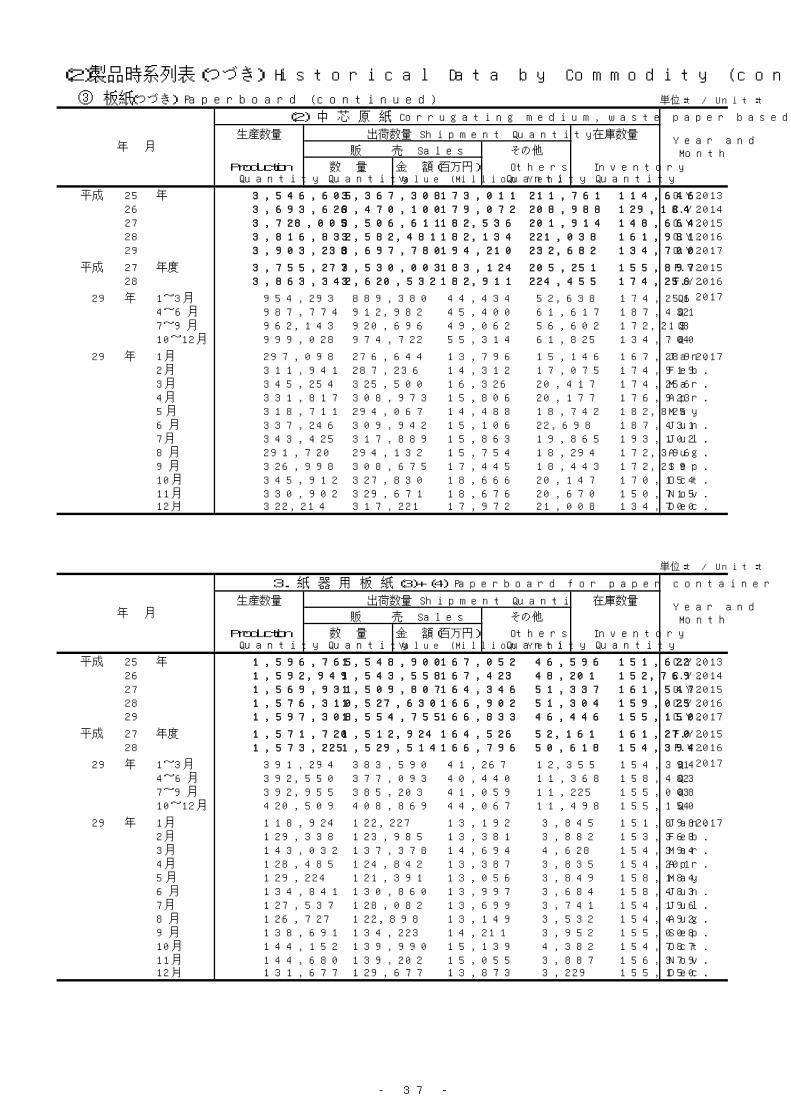
- 37 -
(2)製品時系列表(つづき) Historical Data by Commodity (continued)
③ 板紙 (つづき) Paperboard (continued) 単位:t / Unit:t
生産数量 在庫数量
その他
Production 数 量 金 額(百万円) Others InventoryQuantity Quantity Value (Million Yen) Quantity Quantity
平成 25 年 3,546,605 3,367,308 173,011 211,761 114,646 C.Y. 201326 3,693,626 3,470,100 179,072 208,988 129,184 C.Y. 201427 3,728,005 3,506,611 182,536 201,914 148,664 C.Y. 201528 3,816,832 3,582,481 182,134 221,038 161,981 C.Y. 201629 3,903,238 3,697,780 194,210 232,682 134,700 C.Y. 2017
平成 27 年度 3,755,277 3,530,003 183,124 205,251 155,897 F.Y. 201528 3,863,342 3,620,532 182,911 224,455 174,256 F.Y. 2016
29 年 1~3月 954,293 889,380 44,434 52,638 174,256 Q1 2017
4~6月 987,774 912,982 45,400 61,617 187,431 Q27~9月 962,143 920,696 49,062 56,602 172,219 Q310~12月 999,028 974,722 55,314 61,825 134,700 Q4
29 年 1月 297,098 276,644 13,796 15,146 167,289 Jan. 20172月 311,941 287,236 14,312 17,075 174,919 Feb.3月 345,254 325,500 16,326 20,417 174,256 Mar.4月 331,817 308,973 15,806 20,177 176,923 Apr.5月 318,711 294,067 14,488 18,742 182,825 May 6月 337,246 309,942 15,106 22,698 187,431 Jun.7月 343,425 317,889 15,863 19,865 193,102 Jul.8月 291,720 294,132 15,754 18,294 172,396 Aug.9月 326,998 308,675 17,445 18,443 172,219 Sep.10月 345,912 327,830 18,666 20,147 170,154 Oct.11月 330,902 329,671 18,676 20,670 150,715 Nov.12月 322,214 317,221 17,972 21,008 134,700 Dec.
単位:t / Unit:t
生産数量 在庫数量
その他
Production 数 量 金 額(百万円) Others InventoryQuantity Quantity Value (Million Yen) Quantity Quantity
平成 25 年 1,596,765 1,548,900 167,052 46,596 151,622 C.Y. 201326 1,592,949 1,543,558 167,423 48,201 152,769 C.Y. 201427 1,569,931 1,509,807 164,346 51,337 161,547 C.Y. 201528 1,576,310 1,527,630 166,902 51,304 159,025 C.Y. 201629 1,597,308 1,554,755 166,833 46,446 155,150 C.Y. 2017
平成 27 年度 1,571,720 1,512,924 164,526 52,161 161,270 F.Y. 201528 1,573,225 1,529,514 166,796 50,618 154,394 F.Y. 2016
29 年 1~3月 391,294 383,590 41,267 12,355 154,394 Q1 2017
4~6月 392,550 377,093 40,440 11,368 158,483 Q27~9月 392,955 385,203 41,059 11,225 155,008 Q310~12月 420,509 408,869 44,067 11,498 155,150 Q4
29 年 1月 118,924 122,227 13,192 3,845 151,898 Jan. 20172月 129,338 123,985 13,381 3,882 153,368 Feb.3月 143,032 137,378 14,694 4,628 154,394 Mar.4月 128,485 124,842 13,387 3,835 154,201 Apr.5月 129,224 121,391 13,056 3,849 158,184 May 6月 134,841 130,860 13,997 3,684 158,483 Jun.7月 127,537 128,082 13,699 3,741 154,196 Jul.8月 126,727 122,898 13,149 3,532 154,492 Aug.9月 138,691 134,223 14,211 3,952 155,008 Sep.10月 144,152 139,990 15,139 4,382 154,787 Oct.11月 144,680 139,202 15,055 3,887 156,379 Nov.12月 131,677 129,677 13,873 3,229 155,150 Dec.
年 月
3. 紙 器 用 板 紙 (3)+(4) Paperboard for paper container
Year andMonth
出荷数量 Shipment Quantity
販 売 Sales
年 月
(2) 中 芯 原 紙 Corrugating medium, waste paper based
Year andMonth
出荷数量 Shipment Quantity
販 売 Sales
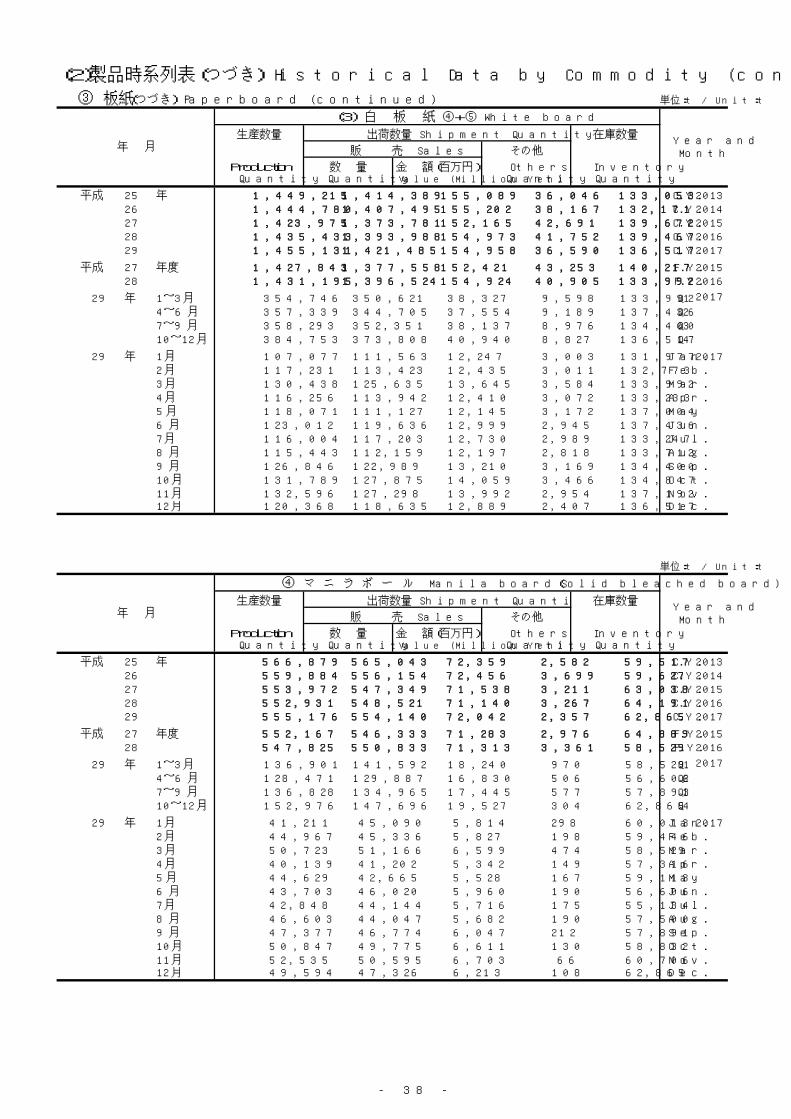
- 38 -
(2)製品時系列表(つづき) Historical Data by Commodity (continued)
③ 板紙 (つづき) Paperboard (continued) 単位:t / Unit:t
生産数量 在庫数量
その他
Production 数 量 金 額(百万円) Others InventoryQuantity Quantity Value (Million Yen) Quantity Quantity
平成 25 年 1,449,215 1,414,389 155,089 36,046 133,053 C.Y. 201326 1,444,780 1,407,495 155,202 38,167 132,171 C.Y. 201427 1,423,975 1,373,781 152,165 42,691 139,672 C.Y. 201528 1,435,433 1,393,988 154,973 41,752 139,467 C.Y. 201629 1,455,131 1,421,485 154,958 36,590 136,517 C.Y. 2017
平成 27 年度 1,427,843 1,377,558 152,421 43,253 140,217 F.Y. 201528 1,431,195 1,396,524 154,924 40,905 133,992 F.Y. 2016
29 年 1~3月 354,746 350,621 38,327 9,598 133,992 Q1 2017
4~6月 357,339 344,705 37,554 9,189 137,436 Q27~9月 358,293 352,351 38,137 8,976 134,400 Q310~12月 384,753 373,808 40,940 8,827 136,517 Q4
29 年 1月 107,077 111,563 12,247 3,003 131,977 Jan. 20172月 117,231 113,423 12,435 3,011 132,773 Feb.3月 130,438 125,635 13,645 3,584 133,992 Mar.4月 116,256 113,942 12,410 3,072 133,233 Apr.5月 118,071 111,127 12,145 3,172 137,004 May 6月 123,012 119,636 12,999 2,945 137,436 Jun.7月 116,004 117,203 12,730 2,989 133,247 Jul.8月 115,443 112,159 12,197 2,818 133,712 Aug.9月 126,846 122,989 13,210 3,169 134,400 Sep.10月 131,789 127,875 14,059 3,466 134,847 Oct.11月 132,596 127,298 13,992 2,954 137,192 Nov.12月 120,368 118,635 12,889 2,407 136,517 Dec.
単位:t / Unit:t
生産数量 在庫数量
その他
Production 数 量 金 額(百万円) Others InventoryQuantity Quantity Value (Million Yen) Quantity Quantity
平成 25 年 566,879 565,043 72,359 2,582 59,517 C.Y. 201326 559,884 556,154 72,456 3,699 59,627 C.Y. 201427 553,972 547,349 71,538 3,211 63,038 C.Y. 201528 552,931 548,521 71,140 3,267 64,191 C.Y. 201629 555,176 554,140 72,042 2,357 62,865 C.Y. 2017
平成 27 年度 552,167 546,333 71,283 2,976 64,889 F.Y. 201528 547,825 550,833 71,313 3,361 58,529 F.Y. 2016
29 年 1~3月 136,901 141,592 18,240 970 58,529 Q1 2017
4~6月 128,471 129,887 16,830 506 56,606 Q27~9月 136,828 134,965 17,445 577 57,891 Q310~12月 152,976 147,696 19,527 304 62,865 Q4
29 年 1月 41,211 45,090 5,814 298 60,013 Jan. 20172月 44,967 45,336 5,827 198 59,446 Feb.3月 50,723 51,166 6,599 474 58,529 Mar.4月 40,139 41,202 5,342 149 57,316 Apr.5月 44,629 42,665 5,528 167 59,113 May 6月 43,703 46,020 5,960 190 56,606 Jun.7月 42,848 44,144 5,716 175 55,134 Jul.8月 46,603 44,047 5,682 190 57,500 Aug.9月 47,377 46,774 6,047 212 57,891 Sep.10月 50,847 49,775 6,611 130 58,832 Oct.11月 52,535 50,595 6,703 66 60,706 Nov.12月 49,594 47,326 6,213 108 62,865 Dec.
年 月
④ マ ニ ラ ボ ー ル Manila board(Solid bleached board)
Year andMonth
出荷数量 Shipment Quantity
販 売 Sales
年 月
(3) 白 板 紙 ④+⑤ White board
Year andMonth
出荷数量 Shipment Quantity
販 売 Sales
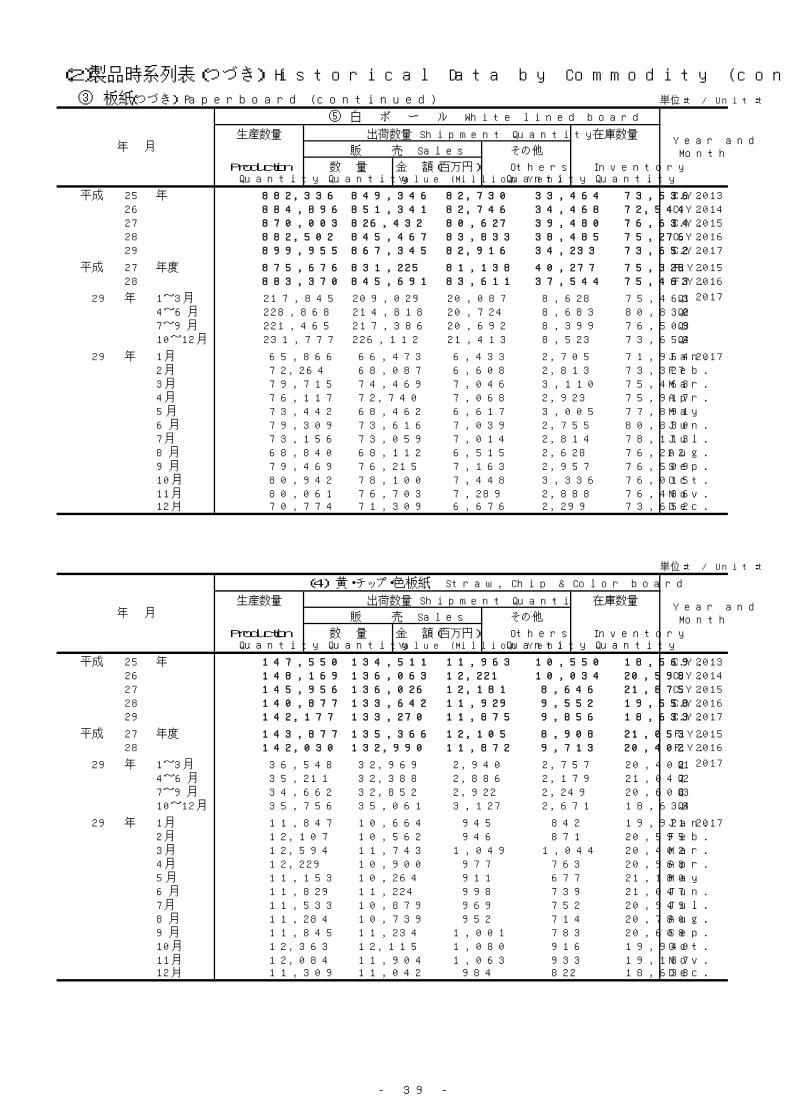
- 39 -
(2)製品時系列表(つづき) Historical Data by Commodity (continued)
③ 板紙 (つづき) Paperboard (continued) 単位:t / Unit:t
生産数量 在庫数量
その他
Production 数 量 金 額(百万円) Others InventoryQuantity Quantity Value (Million Yen) Quantity Quantity
平成 25 年 882,336 849,346 82,730 33,464 73,536 C.Y. 201326 884,896 851,341 82,746 34,468 72,544 C.Y. 201427 870,003 826,432 80,627 39,480 76,634 C.Y. 201528 882,502 845,467 83,833 38,485 75,276 C.Y. 201629 899,955 867,345 82,916 34,233 73,652 C.Y. 2017
平成 27 年度 875,676 831,225 81,138 40,277 75,328 F.Y. 201528 883,370 845,691 83,611 37,544 75,463 F.Y. 2016
29 年 1~3月 217,845 209,029 20,087 8,628 75,463 Q1 2017
4~6月 228,868 214,818 20,724 8,683 80,830 Q27~9月 221,465 217,386 20,692 8,399 76,509 Q310~12月 231,777 226,112 21,413 8,523 73,652 Q4
29 年 1月 65,866 66,473 6,433 2,705 71,964 Jan. 20172月 72,264 68,087 6,608 2,813 73,327 Feb.3月 79,715 74,469 7,046 3,110 75,463 Mar.4月 76,117 72,740 7,068 2,923 75,917 Apr.5月 73,442 68,462 6,617 3,005 77,891 May 6月 79,309 73,616 7,039 2,755 80,830 Jun.7月 73,156 73,059 7,014 2,814 78,113 Jul.8月 68,840 68,112 6,515 2,628 76,212 Aug.9月 79,469 76,215 7,163 2,957 76,509 Sep.10月 80,942 78,100 7,448 3,336 76,015 Oct.11月 80,061 76,703 7,289 2,888 76,486 Nov.12月 70,774 71,309 6,676 2,299 73,652 Dec.
単位:t / Unit:t
生産数量 在庫数量
その他
Production 数 量 金 額(百万円) Others InventoryQuantity Quantity Value (Million Yen) Quantity Quantity
平成 25 年 147,550 134,511 11,963 10,550 18,569 C.Y. 201326 148,169 136,063 12,221 10,034 20,598 C.Y. 201427 145,956 136,026 12,181 8,646 21,875 C.Y. 201528 140,877 133,642 11,929 9,552 19,558 C.Y. 201629 142,177 133,270 11,875 9,856 18,633 C.Y. 2017
平成 27 年度 143,877 135,366 12,105 8,908 21,053 F.Y. 201528 142,030 132,990 11,872 9,713 20,402 F.Y. 2016
29 年 1~3月 36,548 32,969 2,940 2,757 20,402 Q1 2017
4~6月 35,211 32,388 2,886 2,179 21,047 Q27~9月 34,662 32,852 2,922 2,249 20,608 Q310~12月 35,756 35,061 3,127 2,671 18,633 Q4
29 年 1月 11,847 10,664 945 842 19,921 Jan. 20172月 12,107 10,562 946 871 20,595 Feb.3月 12,594 11,743 1,049 1,044 20,402 Mar.4月 12,229 10,900 977 763 20,968 Apr.5月 11,153 10,264 911 677 21,180 May 6月 11,829 11,224 998 739 21,047 Jun.7月 11,533 10,879 969 752 20,949 Jul.8月 11,284 10,739 952 714 20,780 Aug.9月 11,845 11,234 1,001 783 20,608 Sep.10月 12,363 12,115 1,080 916 19,940 Oct.11月 12,084 11,904 1,063 933 19,187 Nov.12月 11,309 11,042 984 822 18,633 Dec.
年 月
(4) 黄・チップ・色板紙 Straw, Chip & Color board
Year andMonth
出荷数量 Shipment Quantity
販 売 Sales
年 月
⑤ 白 ボ ー ル White lined board
Year andMonth
出荷数量 Shipment Quantity
販 売 Sales
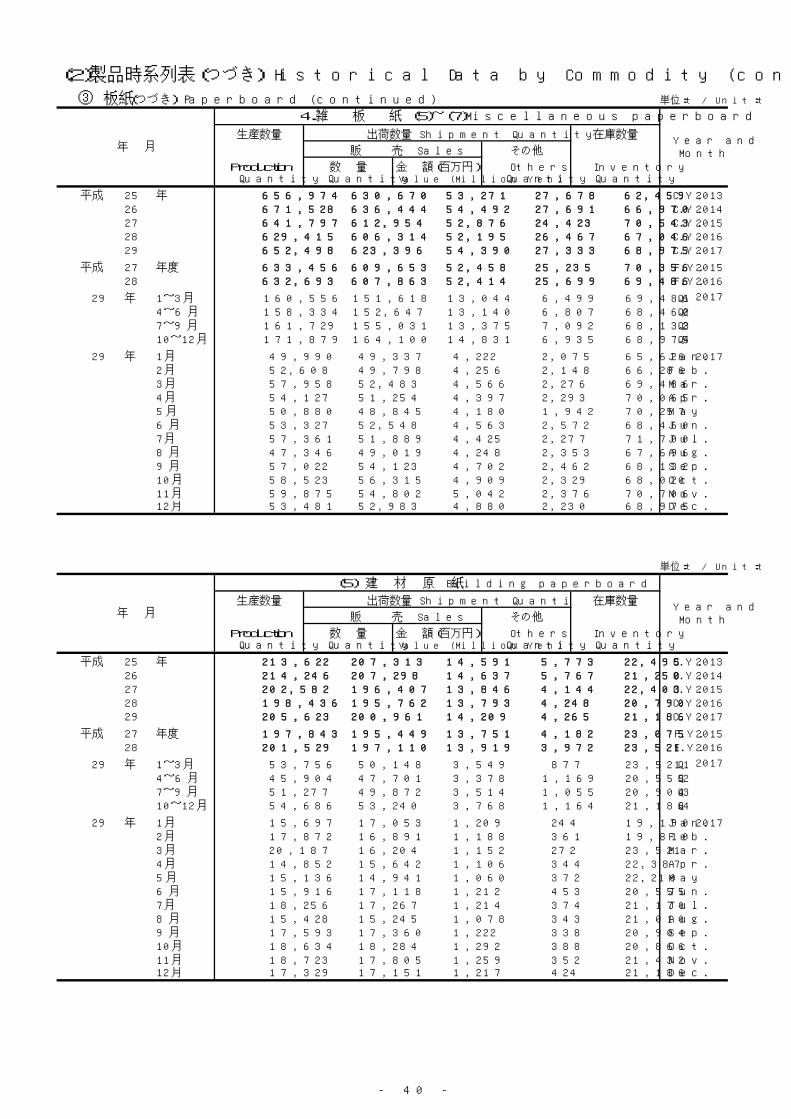
- 40 -
(2)製品時系列表(つづき) Historical Data by Commodity (continued)
③ 板紙 (つづき) Paperboard (continued) 単位:t / Unit:t
生産数量 在庫数量
その他
Production 数 量 金 額(百万円) Others InventoryQuantity Quantity Value (Million Yen) Quantity Quantity
平成 25 年 656,974 630,670 53,271 27,678 62,459 C.Y. 201326 671,528 636,444 54,492 27,691 66,970 C.Y. 201427 641,797 612,954 52,876 24,423 70,543 C.Y. 201528 629,415 606,314 52,195 26,467 67,046 C.Y. 201629 652,498 623,396 54,390 27,333 68,975 C.Y. 2017
平成 27 年度 633,456 609,653 52,458 25,235 70,356 F.Y. 201528 632,693 607,863 52,414 25,699 69,486 F.Y. 2016
29 年 1~3月 160,556 151,618 13,044 6,499 69,486 Q1 2017
4~6月 158,334 152,647 13,140 6,807 68,460 Q27~9月 161,729 155,031 13,375 7,092 68,132 Q310~12月 171,879 164,100 14,831 6,935 68,975 Q4
29 年 1月 49,990 49,337 4,222 2,075 65,626 Jan. 20172月 52,608 49,798 4,256 2,148 66,286 Feb.3月 57,958 52,483 4,566 2,276 69,486 Mar.4月 54,127 51,254 4,397 2,293 70,065 Apr.5月 50,880 48,845 4,180 1,942 70,257 May 6月 53,327 52,548 4,563 2,572 68,460 Jun.7月 57,361 51,889 4,425 2,277 71,700 Jul.8月 47,346 49,019 4,248 2,353 67,696 Aug.9月 57,022 54,123 4,702 2,462 68,132 Sep.10月 58,523 56,315 4,909 2,329 68,020 Oct.11月 59,875 54,802 5,042 2,376 70,706 Nov.12月 53,481 52,983 4,880 2,230 68,975 Dec.
単位:t / Unit:t
生産数量 在庫数量
その他
Production 数 量 金 額(百万円) Others InventoryQuantity Quantity Value (Million Yen) Quantity Quantity
平成 25 年 213,622 207,313 14,591 5,773 22,495 C.Y. 201326 214,246 207,298 14,637 5,767 21,250 C.Y. 201427 202,582 196,407 13,846 4,144 22,403 C.Y. 201528 198,436 195,762 13,793 4,248 20,790 C.Y. 201629 205,623 200,961 14,209 4,265 21,186 C.Y. 2017
平成 27 年度 197,843 195,449 13,751 4,182 23,075 F.Y. 201528 201,529 197,110 13,919 3,972 23,521 F.Y. 2016
29 年 1~3月 53,756 50,148 3,549 877 23,521 Q1 2017
4~6月 45,904 47,701 3,378 1,169 20,555 Q27~9月 51,277 49,872 3,514 1,055 20,904 Q310~12月 54,686 53,240 3,768 1,164 21,186 Q4
29 年 1月 15,697 17,053 1,209 244 19,190 Jan. 20172月 17,872 16,891 1,188 361 19,810 Feb.3月 20,187 16,204 1,152 272 23,521 Mar.4月 14,852 15,642 1,106 344 22,387 Apr.5月 15,136 14,941 1,060 372 22,210 May 6月 15,916 17,118 1,212 453 20,555 Jun.7月 18,256 17,267 1,214 374 21,170 Jul.8月 15,428 15,245 1,078 343 21,010 Aug.9月 17,593 17,360 1,222 338 20,904 Sep.10月 18,634 18,284 1,292 388 20,866 Oct.11月 18,723 17,805 1,259 352 21,432 Nov.12月 17,329 17,151 1,217 424 21,186 Dec.
年 月
(5) 建 材 原 紙 Building paperboard
Year andMonth
出荷数量 Shipment Quantity
販 売 Sales
年 月
4.雑 板 紙 (5)~(7)Miscellaneous paperboard
Year andMonth
出荷数量 Shipment Quantity
販 売 Sales
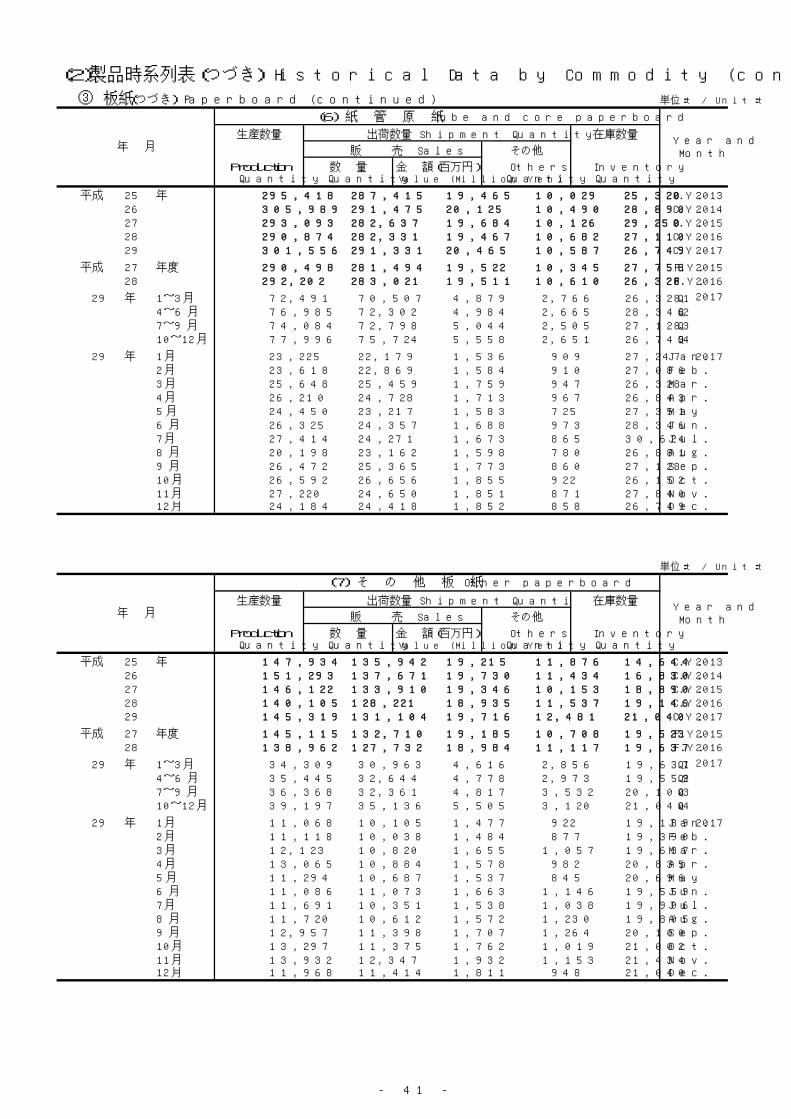
- 41 -
(2)製品時系列表(つづき) Historical Data by Commodity (continued)
③ 板紙 (つづき) Paperboard (continued) 単位:t / Unit:t
生産数量 在庫数量
その他
Production 数 量 金 額(百万円) Others InventoryQuantity Quantity Value (Million Yen) Quantity Quantity
平成 25 年 295,418 287,415 19,465 10,029 25,320 C.Y. 201326 305,989 291,475 20,125 10,490 28,890 C.Y. 201427 293,093 282,637 19,684 10,126 29,250 C.Y. 201528 290,874 282,331 19,467 10,682 27,110 C.Y. 201629 301,556 291,331 20,465 10,587 26,749 C.Y. 2017
平成 27 年度 290,498 281,494 19,522 10,345 27,758 F.Y. 201528 292,202 283,021 19,511 10,610 26,328 F.Y. 2016
29 年 1~3月 72,491 70,507 4,879 2,766 26,328 Q1 2017
4~6月 76,985 72,302 4,984 2,665 28,346 Q27~9月 74,084 72,798 5,044 2,505 27,128 Q310~12月 77,996 75,724 5,558 2,651 26,749 Q4
29 年 1月 23,225 22,179 1,536 909 27,247 Jan. 20172月 23,618 22,869 1,584 910 27,086 Feb.3月 25,648 25,459 1,759 947 26,328 Mar.4月 26,210 24,728 1,713 967 26,843 Apr.5月 24,450 23,217 1,583 725 27,351 May 6月 26,325 24,357 1,688 973 28,346 Jun.7月 27,414 24,271 1,673 865 30,624 Jul.8月 20,198 23,162 1,598 780 26,881 Aug.9月 26,472 25,365 1,773 860 27,128 Sep.10月 26,592 26,656 1,855 922 26,152 Oct.11月 27,220 24,650 1,851 871 27,840 Nov.12月 24,184 24,418 1,852 858 26,749 Dec.
単位:t / Unit:t
生産数量 在庫数量
その他
Production 数 量 金 額(百万円) Others InventoryQuantity Quantity Value (Million Yen) Quantity Quantity
平成 25 年 147,934 135,942 19,215 11,876 14,644 C.Y. 201326 151,293 137,671 19,730 11,434 16,830 C.Y. 201427 146,122 133,910 19,346 10,153 18,890 C.Y. 201528 140,105 128,221 18,935 11,537 19,146 C.Y. 201629 145,319 131,104 19,716 12,481 21,040 C.Y. 2017
平成 27 年度 145,115 132,710 19,185 10,708 19,523 F.Y. 201528 138,962 127,732 18,984 11,117 19,637 F.Y. 2016
29 年 1~3月 34,309 30,963 4,616 2,856 19,637 Q1 2017
4~6月 35,445 32,644 4,778 2,973 19,559 Q27~9月 36,368 32,361 4,817 3,532 20,100 Q310~12月 39,197 35,136 5,505 3,120 21,040 Q4
29 年 1月 11,068 10,105 1,477 922 19,189 Jan. 20172月 11,118 10,038 1,484 877 19,390 Feb.3月 12,123 10,820 1,655 1,057 19,637 Mar.4月 13,065 10,884 1,578 982 20,835 Apr.5月 11,294 10,687 1,537 845 20,696 May 6月 11,086 11,073 1,663 1,146 19,559 Jun.7月 11,691 10,351 1,538 1,038 19,906 Jul.8月 11,720 10,612 1,572 1,230 19,805 Aug.9月 12,957 11,398 1,707 1,264 20,100 Sep.10月 13,297 11,375 1,762 1,019 21,002 Oct.11月 13,932 12,347 1,932 1,153 21,434 Nov.12月 11,968 11,414 1,811 948 21,040 Dec.
年 月
(7) そ の 他 板 紙 Other paperboard
Year andMonth
出荷数量 Shipment Quantity
販 売 Sales
年 月
(6) 紙 管 原 紙 Tube and core paperboard
Year andMonth
出荷数量 Shipment Quantity
販 売 Sales
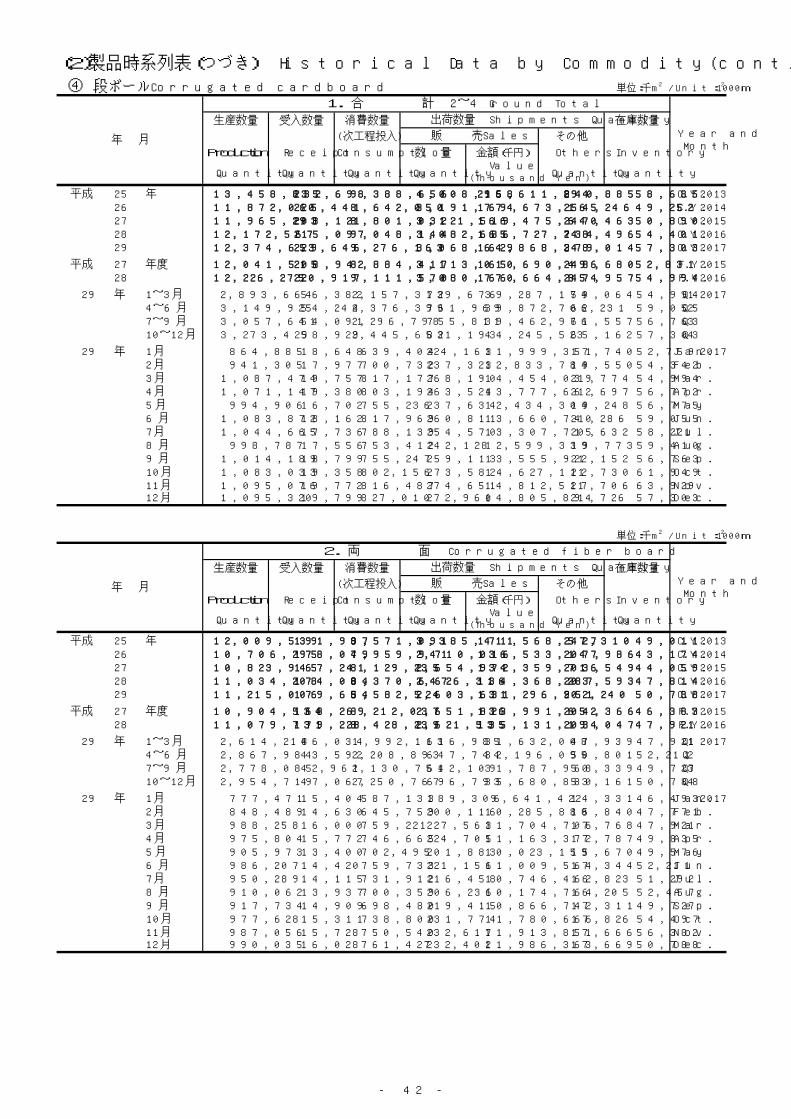
- 42 -
(2)製品時系列表(つづき) Historical Data by Commodity(continued)
④ 段ボール Corrugated cardboard 単位:千m2 /Unit:1000m
2
生産数量 受入数量 消費数量 在庫数量
(次工程投入) その他
Production Receipt Consumption 数 量 金額(千円) Others Inventory
Quantity Quantity Quantity QuantityValue
(Thousand Yen) Quantity Quantity
平成 25 年 13,458,832 235,698 9,388,656 4,008,968 215,611,840 294,885 58,685 C.Y. 2013 26 11,872,065 220,441 8,642,050 3,191,774 169,673,165 254,246 49,252 C.Y. 2014 27 11,965,293 208,121 8,801,032 3,121,519 166,475,640 247,463 50,890 C.Y. 2015 28 12,172,567 215,097 9,048,144 3,082,686 165,727,734 248,496 54,401 C.Y. 2016 29 12,374,659 223,646 9,276,163 3,068,649 162,868,379 248,014 57,303 C.Y. 2017
平成 27 年度 12,041,515 208,942 8,884,417 3,113,010 165,690,496 248,680 52,831 F.Y. 2015 28 12,226,275 220,917 9,111,570 3,080,770 166,664,854 247,957 54,994 F.Y. 2016
29 年 1~3月 2,893,664 56,382 2,157,313 729,676 39,287,174 59,064 54,994 Q1 20174~6月 3,149,925 54,244 2,376,399 761,969 39,872,706 62,231 59,055 Q27~9月 3,057,641 54,091 2,296,798 755,811 39,462,976 61,557 56,763 Q310~12月 3,273,429 58,929 2,445,653 821,193 44,245,523 65,162 57,303 Q4
29 年 1月 864,885 18,648 639,404 224,163 11,999,351 17,740 52,759 Jan. 20172月 941,305 17,977 700,732 237,323 12,833,784 19,550 54,342 Feb.3月 1,087,474 19,757 817,177 268,190 14,454,039 21,774 54,994 Mar.4月 1,071,147 19,380 803,194 263,524 13,777,662 21,697 56,772 Apr.5月 994,906 16,702 755,236 237,634 12,434,304 19,248 56,775 May 6月 1,083,872 18,162 817,969 260,811 13,660,740 21,286 59,055 Jun.7月 1,044,665 17,736 788,139 254,570 13,307,715 20,632 58,221 Jul.8月 998,787 17,556 753,412 242,128 12,599,339 19,773 59,410 Aug.9月 1,014,189 18,799 755,247 259,113 13,555,922 21,152 56,763 Sep.10月 1,083,033 19,358 802,156 273,582 14,627,112 21,730 61,949 Oct.11月 1,095,076 19,772 816,487 274,651 14,812,517 21,706 63,929 Nov.12月 1,095,320 19,799 827,010 272,960 14,805,894 21,726 57,303 Dec.
単位:千m2 /Unit:1000m
2
生産数量 受入数量 消費数量 在庫数量
(次工程投入) その他
Production Receipt Consumption 数 量 金額(千円) Others Inventory
Quantity Quantity Quantity QuantityValue
(Thousand Yen) Quantity Quantity
平成 25 年 12,009,539 191,997 8,571,091 3,385,411 171,568,577 242,310 49,011 C.Y. 2013 26 10,706,295 178,049 7,959,941 2,710,016 136,533,147 207,986 43,174 C.Y. 2014 27 10,823,945 167,241 8,129,235 2,654,972 134,359,716 203,549 44,059 C.Y. 2015 28 11,034,208 174,084 8,370,647 2,626,316 134,368,287 203,593 47,814 C.Y. 2016 29 11,215,006 179,654 8,582,524 2,603,631 131,296,951 202,240 50,788 C.Y. 2017
平成 27 年度 10,904,534 168,269 8,212,037 2,651,826 133,991,652 204,366 46,383 F.Y. 2015 28 11,079,731 179,228 8,428,239 2,621,535 135,131,194 203,047 47,921 F.Y. 2016
29 年 1~3月 2,614,218 46,034 1,992,113 616,985 31,632,008 47,939 47,921 Q1 20174~6月 2,867,984 43,592 2,208,893 647,744 32,196,095 50,801 52,211 Q27~9月 2,778,085 42,961 2,130,751 642,109 31,787,968 50,339 49,727 Q310~12月 2,954,719 47,067 2,250,767 696,793 35,680,880 53,161 50,788 Q4
29 年 1月 777,471 15,404 587,133 189,306 9,641,422 14,331 46,493 Jan. 20172月 848,489 14,630 645,759 200,116 10,285,880 15,840 47,771 Feb.3月 988,258 16,000 759,221 227,563 11,704,706 17,768 47,921 Mar.4月 975,804 15,772 746,665 224,705 11,163,372 17,787 49,835 Apr.5月 905,973 13,400 702,495 201,883 10,023,159 15,670 49,576 May 6月 986,207 14,420 759,733 221,156 11,009,564 17,344 52,211 Jun.7月 950,289 14,115 731,912 216,458 10,746,462 16,823 51,292 Jul.8月 910,062 13,937 700,359 206,236 10,174,764 16,205 52,457 Aug.9月 917,734 14,909 698,480 219,415 10,866,742 17,311 49,727 Sep.10月 977,628 15,311 738,800 231,774 11,780,666 17,826 54,497 Oct.11月 987,056 15,728 750,540 232,617 11,913,851 17,666 56,382 Nov.12月 990,035 16,028 761,427 232,402 11,986,363 17,669 50,788 Dec.
出荷数量 Shipments Quantity
販 売Sales
出荷数量 Shipments Quantity
販 売Sales
年 月
2. 両 面 Corrugated fiber board
Year andMonth
年 月
1. 合 計 2~4 Ground Total
Year andMonth
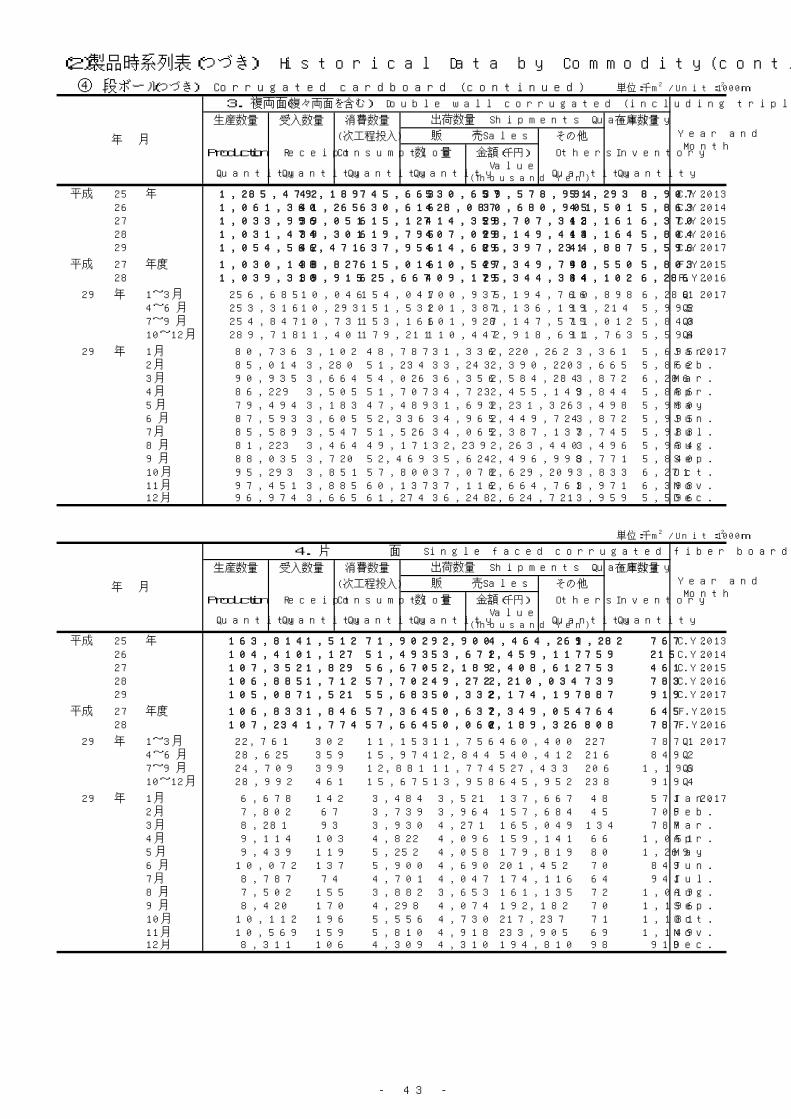
- 43 -
(2)製品時系列表(つづき) Historical Data by Commodity(continued)
④ 段ボール(つづき) Corrugated cardboard (continued) 単位:千m2 /Unit:1000m
2
生産数量 受入数量 消費数量 在庫数量
(次工程投入) その他
Production Receipt Consumption 数 量 金額(千円) Others Inventory
Quantity Quantity Quantity QuantityValue
(Thousand Yen) Quantity Quantity
平成 25 年 1,285,479 42,189 745,663 530,657 39,578,994 51,293 8,907 C.Y. 2013 26 1,061,360 41,265 630,616 428,087 30,680,901 45,501 5,863 C.Y. 2014 27 1,033,996 39,051 615,127 414,358 29,707,312 43,161 6,370 C.Y. 2015 28 1,031,474 39,301 619,795 407,098 29,149,413 44,164 5,804 C.Y. 2016 29 1,054,566 42,471 637,956 414,686 29,397,231 44,887 5,596 C.Y. 2017
平成 27 年度 1,030,148 38,827 615,016 410,547 29,349,790 43,550 5,803 F.Y. 2015 28 1,039,310 39,915 625,667 409,175 29,344,334 44,102 6,286 F.Y. 2016
29 年 1~3月 256,685 10,046 154,047 100,935 7,194,766 10,898 6,286 Q1 20174~6月 253,316 10,293 151,532 101,381 7,136,199 11,214 5,995 Q27~9月 254,847 10,731 153,166 101,928 7,147,575 11,012 5,840 Q310~12月 289,718 11,401 179,211 110,442 7,918,691 11,763 5,596 Q4
29 年 1月 80,736 3,102 48,787 31,336 2,220,262 3,361 5,695 Jan. 20172月 85,014 3,280 51,234 33,243 2,390,220 3,665 5,862 Feb.3月 90,935 3,664 54,026 36,356 2,584,284 3,872 6,286 Mar.4月 86,229 3,505 51,707 34,723 2,455,149 3,844 5,886 Apr.5月 79,494 3,183 47,489 31,693 2,231,326 3,498 5,930 May 6月 87,593 3,605 52,336 34,965 2,449,724 3,872 5,995 Jun.7月 85,589 3,547 51,526 34,065 2,387,137 3,745 5,988 Jul.8月 81,223 3,464 49,171 32,239 2,263,440 3,496 5,934 Aug.9月 88,035 3,720 52,469 35,624 2,496,998 3,771 5,840 Sep.10月 95,293 3,851 57,800 37,078 2,629,209 3,833 6,271 Oct.11月 97,451 3,885 60,137 37,116 2,664,761 3,971 6,398 Nov.12月 96,974 3,665 61,274 36,248 2,624,721 3,959 5,596 Dec.
単位:千m2 /Unit:1000m
2
生産数量 受入数量 消費数量 在庫数量
(次工程投入) その他
Production Receipt Consumption 数 量 金額(千円) Others Inventory
Quantity Quantity Quantity QuantityValue
(Thousand Yen) Quantity Quantity
平成 25 年 163,814 1,512 71,902 92,900 4,464,269 1,282 767 C.Y. 2013 26 104,410 1,127 51,493 53,671 2,459,117 759 215 C.Y. 2014 27 107,352 1,829 56,670 52,189 2,408,612 753 461 C.Y. 2015 28 106,885 1,712 57,702 49,272 2,210,034 739 783 C.Y. 2016 29 105,087 1,521 55,683 50,332 2,174,197 887 919 C.Y. 2017
平成 27 年度 106,833 1,846 57,364 50,637 2,349,054 764 645 F.Y. 2015 28 107,234 1,774 57,664 50,060 2,189,326 808 787 F.Y. 2016
29 年 1~3月 22,761 302 11,153 11,756 460,400 227 787 Q1 20174~6月 28,625 359 15,974 12,844 540,412 216 849 Q27~9月 24,709 399 12,881 11,774 527,433 206 1,196 Q310~12月 28,992 461 15,675 13,958 645,952 238 919 Q4
29 年 1月 6,678 142 3,484 3,521 137,667 48 571 Jan. 20172月 7,802 67 3,739 3,964 157,684 45 709 Feb.3月 8,281 93 3,930 4,271 165,049 134 787 Mar.4月 9,114 103 4,822 4,096 159,141 66 1,051 Apr.5月 9,439 119 5,252 4,058 179,819 80 1,269 May 6月 10,072 137 5,900 4,690 201,452 70 849 Jun.7月 8,787 74 4,701 4,047 174,116 64 941 Jul.8月 7,502 155 3,882 3,653 161,135 72 1,019 Aug.9月 8,420 170 4,298 4,074 192,182 70 1,196 Sep.10月 10,112 196 5,556 4,730 217,237 71 1,181 Oct.11月 10,569 159 5,810 4,918 233,905 69 1,149 Nov.12月 8,311 106 4,309 4,310 194,810 98 919 Dec.
Year andMonth
出荷数量 Shipments Quantity
販 売Sales
3. 複両面(複々両面を含む) Double wall corrugated (including triple wall corrugated)
Year andMonth
出荷数量 Shipments Quantity
年 月
4. 片 面 Single faced corrugated fiber board
年 月 販 売Sales
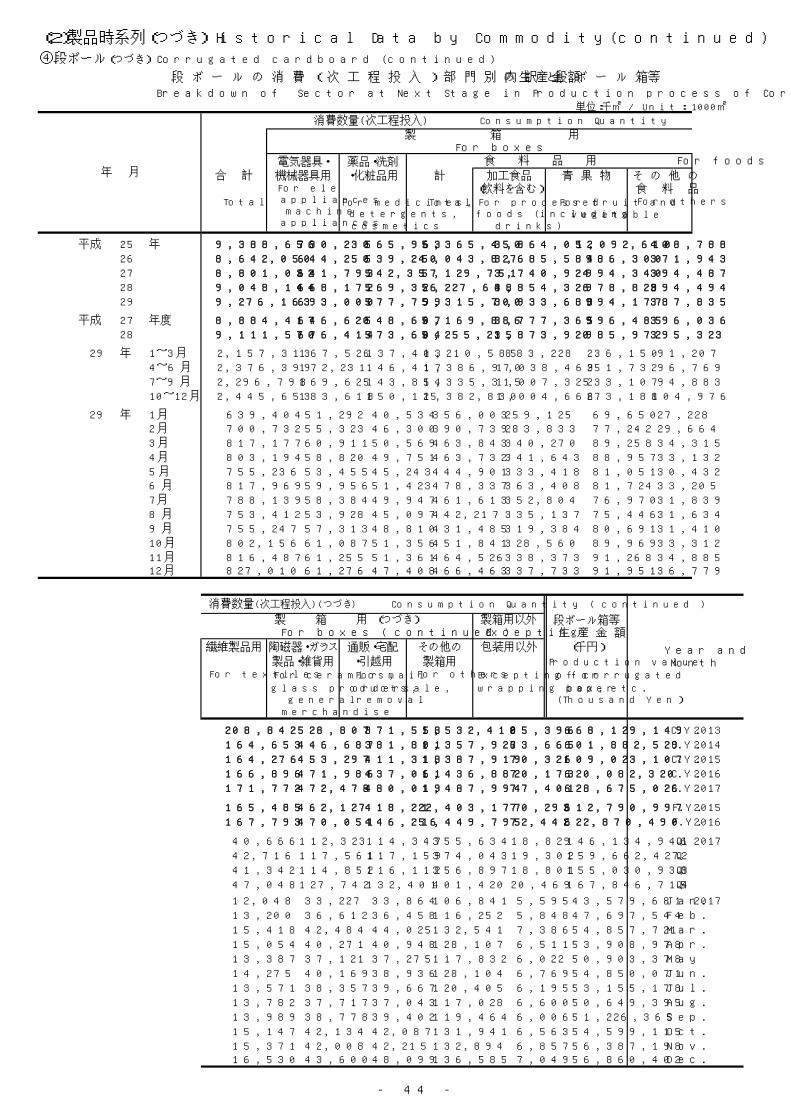
- 44 -
(2)製品時系列(つづき) Historical Data by Commodity(continued)
④段ボール(つづき) Corrugated cardboard (continued)
段 ボ ー ル の 消 費 ( 次 工 程 投 入 ) 部 門 別 内 訳 と段 ボ ー ル 箱等 の 生 産 金 額
Breakdown of Sector at Next Stage in Production process of Corrugated cardboard and value of Corrugated box 単位:千㎡ / Unit: 1000㎡
電気器具・ 薬品・洗剤 合 計 機械器具用 ・化粧品用 計 加工食品 青 果 物 そ の 他 の
(飲料を含む) 食 料 品Total For medicines, Total For processed For fruit and For others
detergents, foods (including vegetablecosmetics drinks)
平成 25 年 9,388,656 730,230 565,963 5,365,450 3,864,052 1,092,610 408,788
26 8,642,050 644,250 539,240 5,043,827 3,685,584 986,300 371,943
27 8,801,032 641,793 542,357 5,129,751 3,740,924 994,340 394,487
28 9,048,144 668,172 569,326 5,227,648 3,854,326 978,828 394,494
29 9,276,163 693,000 577,799 5,315,700 3,933,688 994,177 387,835
平成 27 年度 8,884,417 646,620 548,607 5,169,886 3,777,365 996,485 396,036
28 9,111,570 676,414 573,604 5,255,215 3,873,920 985,972 395,323
29 年 1~3月 2,157,313 167,526 137,403 1,210,585 883,228 236,150 91,207
4~6月 2,376,399 172,231 146,417 1,386,970 1,038,469 251,732 96,769
7~9月 2,296,798 169,625 143,854 1,335,315 1,007,325 233,107 94,883
10~12月 2,445,653 183,618 150,125 1,382,830 1,004,666 273,188 104,976
29 年 1月 639,404 51,292 40,534 356,003 259,125 69,650 27,2282月 700,732 55,323 46,300 390,739 283,833 77,242 29,664
3月 817,177 60,911 50,569 463,843 340,270 89,258 34,315
4月 803,194 58,820 49,751 463,732 341,643 88,957 33,132
5月 755,236 53,455 45,243 444,901 333,418 81,051 30,4326月 817,969 59,956 51,423 478,337 363,408 81,724 33,205
7月 788,139 58,384 49,947 461,613 352,804 76,970 31,839
8月 753,412 53,928 45,097 442,217 335,137 75,446 31,634
9月 755,247 57,313 48,810 431,485 319,384 80,691 31,410
10月 802,156 61,087 51,356 451,841 328,560 89,969 33,312
11月 816,487 61,255 51,361 464,526 338,373 91,268 34,88512月 827,010 61,276 47,408 466,463 337,733 91,951 36,779
段ボール箱等生 産 金 額
繊維製品用 陶磁器・ガラス 通販・宅配 その他の 包装用以外 (千円)
製品・雑貨用 ・引越用 製箱用 Production value For textiles For ceramics, For mail For others Excepting for of corrugated
glass products, ordersale, wrapping paper box, etc. general removal (Thousand Yen)
merchandise
208,842 528,807 371,558 1,532,410 85,396 668,129,149 C.Y. 2013
164,653 446,687 381,801 1,357,927 63,665 601,882,529 C.Y. 2014
164,276 453,297 411,318 1,387,919 70,321 609,023,107 C.Y. 2015
166,896 471,986 437,061 1,436,882 70,173 620,082,320 C.Y. 2016
171,772 472,478 480,019 1,487,994 77,401 628,675,026 C.Y. 2017
165,485 462,127 418,222 1,403,177 70,293 612,790,997 F.Y. 2015
167,793 470,051 446,256 1,449,795 72,442 622,870,490 F.Y. 2016
40,666 112,323 114,347 355,634 18,829 146,134,946 Q1 2017
42,716 117,561 117,159 374,043 19,302 159,662,427 Q2
41,342 114,852 116,112 356,897 18,801 155,030,938 Q3
47,048 127,742 132,401 401,420 20,469 167,846,715 Q4
12,048 33,227 33,864 106,841 5,595 43,579,681 Jan. 2017
13,200 36,612 36,458 116,252 5,848 47,697,544 Feb.
15,418 42,484 44,025 132,541 7,386 54,857,721 Mar.
15,054 40,271 40,948 128,107 6,511 53,908,978 Apr.
13,387 37,121 37,275 117,832 6,022 50,903,378 May
14,275 40,169 38,936 128,104 6,769 54,850,071 Jun.
13,571 38,357 39,667 120,405 6,195 53,155,178 Jul.
13,782 37,717 37,043 117,028 6,600 50,649,395 Aug.
13,989 38,778 39,402 119,464 6,006 51,226,365 Sep.
15,147 42,134 42,087 131,941 6,563 54,599,115 Oct.
15,371 42,008 42,215 132,894 6,857 56,387,198 Nov.16,530 43,600 48,099 136,585 7,049 56,860,402 Dec.
年 月
消費数量(次工程投入) Consumption Quantity
製 箱 用For boxes
食 料 品 用 For foods
For electricappliancesmachine
appliances
消費数量(次工程投入)(つづき) Consumption Quantity ( continued )
Year andMonth
製 箱 用 (つづき)For boxes ( continued )
製箱用以外Excepting

- 45 -
(2)製品時系列表(つづき) Historical Data by Commodity (continued)
⑤ 紙おむつ Disposable diaper 単位:千枚 / Unit:1000sheets
受入数量 在庫数量
数 量 重 量 Receipts 数 量 金 額 その他 Inventory
Quantity (t) Quantity Quantity (百万円) Others Quantity
Weight(t)
Value(Million Yen)
Quantity
平成 25 年 - - - - - - - C.Y. 201326 - - - - - - - C.Y. 201427 - - - - - - - C.Y. 201528 22,367,025 827,866 6,375,091 22,725,259 358,937 6,068,907 1,126,796 C.Y. 201629 24,611,986 905,223 6,993,762 24,777,432 386,027 6,627,866 1,327,545 C.Y. 2017
平成 27 年度 - - - - - - - F.Y. 201528 22,912,177 845,003 6,625,406 23,337,900 364,987 6,304,211 1,312,145 F.Y. 2016
29 年 1~3月 5,996,233 217,622 1,684,546 5,894,889 90,410 1,600,629 1,312,145 Q1 20174~6月 6,446,961 235,824 1,808,678 6,305,783 97,723 1,704,443 1,557,613 Q27~9月 6,069,991 225,319 1,748,124 6,206,179 97,173 1,660,275 1,509,324 Q310~12月 6,098,801 226,458 1,752,414 6,370,581 100,721 1,662,519 1,327,545 Q4
29 年 1月 1,767,732 63,864 479,344 1,559,043 23,948 453,950 1,360,895 Jan. 20172月 2,003,059 72,310 560,988 2,031,677 30,935 535,112 1,358,201 Feb.3月 2,225,442 81,448 644,214 2,304,169 35,527 611,567 1,312,145 Mar.4月 2,214,338 80,565 613,461 2,194,369 33,675 583,612 1,361,984 Apr.5月 2,033,655 74,434 575,423 2,039,382 31,186 536,858 1,394,842 May 6月 2,198,968 80,825 619,794 2,072,032 32,862 583,973 1,557,613 Jun.7月 2,061,236 76,923 607,328 1,977,011 31,010 571,713 1,677,476 Jul.8月 2,001,968 73,760 585,120 2,072,983 32,434 554,807 1,636,794 Aug.9月 2,006,787 74,636 555,676 2,156,185 33,729 533,755 1,509,324 Sep.10月 2,004,587 73,960 553,101 2,002,470 31,118 526,312 1,538,265 Oct.11月 2,113,195 78,932 609,790 2,047,193 32,142 579,656 1,634,414 Nov.12月 1,981,019 73,566 589,523 2,320,918 37,461 556,551 1,327,545 Dec.
単位:千枚 / Unit:1000sheets
受入数量 在庫数量
数 量 重 量 Receipts 数 量 金 額 その他 Inventory
Quantity (t) Quantity Quantity (百万円) Others Quantity
Weight(t)
Value(Million Yen)
Quantity
平成 25 年 - - - - - - - C.Y. 201326 - - - - - - - C.Y. 201427 - - - - - - - C.Y. 201528 7,668,530 364,491 3,224,596 7,903,498 146,348 2,938,780 498,206 C.Y. 201629 8,035,291 379,423 3,507,854 8,368,765 151,755 3,133,281 539,516 C.Y. 2017
平成 27 年度 - - - - - - - F.Y. 201528 7,774,456 369,249 3,305,103 8,014,432 147,269 2,998,413 583,495 F.Y. 2016
29 年 1~3月 1,929,236 90,465 805,688 1,925,238 34,653 724,459 583,495 Q1 20174~6月 2,006,809 95,262 884,291 2,050,466 37,870 786,138 638,042 Q27~9月 1,955,728 93,654 853,894 2,046,319 37,305 767,725 633,664 Q310~12月 2,143,518 100,042 963,981 2,346,742 41,927 854,959 539,516 Q4
29 年 1月 589,449 27,396 237,168 554,089 10,101 210,314 560,437 Jan. 20172月 647,133 30,136 263,761 647,506 11,518 239,473 584,374 Feb.3月 692,654 32,933 304,759 723,643 13,034 274,672 583,495 Mar.4月 702,225 33,102 300,023 717,709 13,033 271,561 596,491 Apr.5月 625,433 29,878 280,992 643,668 11,573 245,431 613,836 May 6月 679,151 32,282 303,276 689,089 13,264 269,146 638,042 Jun.7月 642,219 31,397 299,458 655,154 12,034 264,320 660,269 Jul.8月 656,323 30,541 278,177 713,218 13,020 248,020 633,548 Aug.9月 657,186 31,716 276,259 677,947 12,251 255,385 633,664 Sep.10月 706,619 32,789 298,894 712,700 12,769 263,864 662,649 Oct.11月 747,048 35,312 340,685 750,178 13,389 302,940 697,278 Nov.12月 689,851 31,941 324,402 883,864 15,769 288,155 539,516 Dec.
*平成28年1月より調査開始。
生 産 出荷数量 Shipment Quantity
Production 販売 Sales
年 月
1.大人用 (1)~(3) For adult
Year andMonth
Production 販売 Sales
年 月
紙おむつ 1+2 Disposable diaper
Year andMonth
生 産 出荷数量 Shipment Quantity
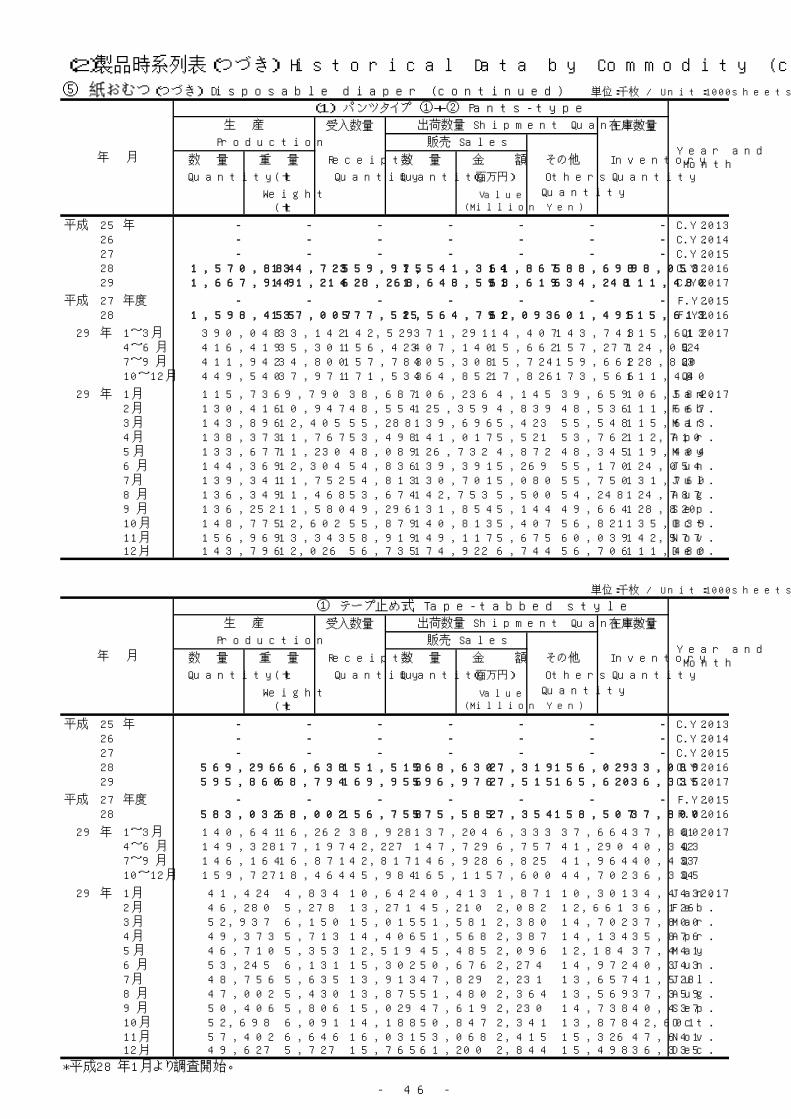
- 46 -
(2)製品時系列表(つづき) Historical Data by Commodity (continued)
⑤ 紙おむつ(つづき) Disposable diaper (continued) 単位:千枚 / Unit:1000sheets
受入数量 在庫数量
数 量 重 量 Receipts 数 量 金 額 その他 Inventory
Quantity (t) Quantity Quantity (百万円) Others Quantity
Weight(t)
Value(Million Yen)
Quantity
平成 25 年 - - - - - - - C.Y. 201326 - - - - - - - C.Y. 201427 - - - - - - - C.Y. 201528 1,570,884 134,723 559,975 1,541,314 61,867 588,698 98,053 C.Y. 201629 1,667,949 141,214 628,268 1,648,591 63,619 634,248 111,480 C.Y. 2017
平成 27 年度 - - - - - - - F.Y. 201528 1,598,455 137,007 577,525 1,564,791 62,093 601,495 115,613 F.Y. 2016
29 年 1~3月 390,048 33,142 142,529 371,291 14,407 143,743 115,613 Q1 20174~6月 416,419 35,301 156,423 407,140 15,662 157,277 124,054 Q27~9月 411,942 34,800 157,783 405,308 15,724 159,662 128,820 Q310~12月 449,540 37,971 171,533 464,852 17,826 173,566 111,480 Q4
29 年 1月 115,736 9,790 38,687 106,236 4,145 39,659 106,584 Jan. 20172月 130,416 10,947 48,554 125,359 4,839 48,536 111,667 Feb.3月 143,896 12,405 55,288 139,696 5,423 55,548 115,613 Mar.4月 138,373 11,767 53,498 141,017 5,521 53,762 112,710 Apr.5月 133,677 11,230 48,089 126,732 4,872 48,345 119,404 May 6月 144,369 12,304 54,836 139,391 5,269 55,170 124,054 Jun.7月 139,341 11,752 54,813 130,701 5,080 55,750 131,760 Jul.8月 136,349 11,468 53,674 142,753 5,500 54,248 124,787 Aug.9月 136,252 11,580 49,296 131,854 5,144 49,664 128,820 Sep.10月 148,775 12,602 55,879 140,813 5,407 56,821 135,839 Oct.11月 156,969 13,343 58,919 149,117 5,675 60,039 142,577 Nov.12月 143,796 12,026 56,735 174,922 6,744 56,706 111,480 Dec.
単位:千枚 / Unit:1000sheets
受入数量 在庫数量
数 量 重 量 Receipts 数 量 金 額 その他 Inventory
Quantity (t) Quantity Quantity (百万円) Others Quantity
Weight(t)
Value(Million Yen)
Quantity
平成 25 年 - - - - - - - C.Y. 201326 - - - - - - - C.Y. 201427 - - - - - - - C.Y. 201528 569,296 66,638 151,513 568,630 27,319 156,029 33,089 C.Y. 201629 595,860 68,794 169,956 596,976 27,515 165,620 36,335 C.Y. 2017
平成 27 年度 - - - - - - - F.Y. 201528 583,032 68,002 156,758 575,585 27,354 158,507 37,800 F.Y. 2016
29 年 1~3月 140,641 16,262 38,928 137,204 6,333 37,664 37,800 Q1 20174~6月 149,328 17,197 42,227 147,729 6,757 41,290 40,343 Q27~9月 146,164 16,871 42,817 146,928 6,825 41,964 40,437 Q310~12月 159,727 18,464 45,984 165,115 7,600 44,702 36,335 Q4
29 年 1月 41,424 4,834 10,642 40,413 1,871 10,301 34,443 Jan. 20172月 46,280 5,278 13,271 45,210 2,082 12,661 36,126 Feb.3月 52,937 6,150 15,015 51,581 2,380 14,702 37,800 Mar.4月 49,373 5,713 14,406 51,568 2,387 14,134 35,876 Apr.5月 46,710 5,353 12,519 45,485 2,096 12,184 37,441 May 6月 53,245 6,131 15,302 50,676 2,274 14,972 40,343 Jun.7月 48,756 5,635 13,913 47,829 2,231 13,657 41,528 Jul.8月 47,002 5,430 13,875 51,480 2,364 13,569 37,359 Aug.9月 50,406 5,806 15,029 47,619 2,230 14,738 40,437 Sep.10月 52,698 6,091 14,188 50,847 2,341 13,878 42,601 Oct.11月 57,402 6,646 16,031 53,068 2,415 15,326 47,641 Nov.12月 49,627 5,727 15,765 61,200 2,844 15,498 36,335 Dec.
*平成28年1月より調査開始。
生 産 出荷数量 Shipment Quantity
Production 販売 Sales
年 月
① テープ止め式 Tape-tabbed style
Year andMonth
Production 販売 Sales
年 月
(1) パンツタイプ ①+② Pants-type
Year andMonth
生 産 出荷数量 Shipment Quantity
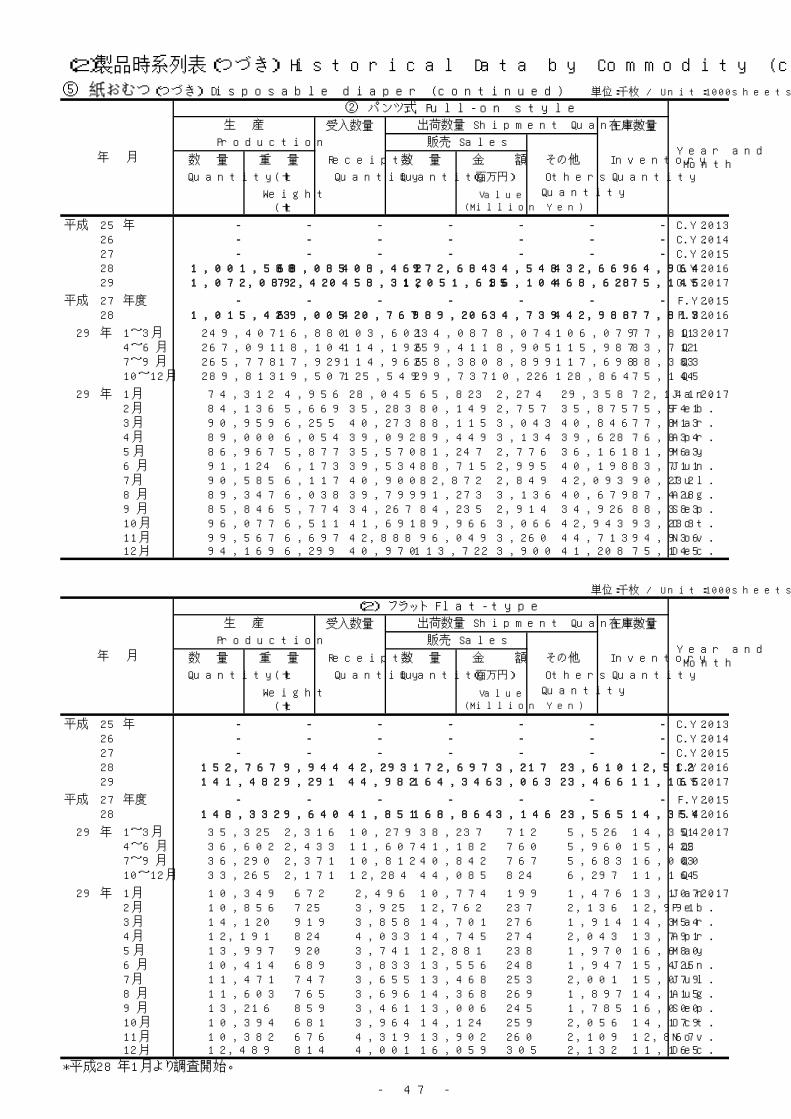
- 47 -
(2)製品時系列表(つづき) Historical Data by Commodity (continued)
⑤ 紙おむつ(つづき) Disposable diaper (continued) 単位:千枚 / Unit:1000sheets
受入数量 在庫数量
数 量 重 量 Receipts 数 量 金 額 その他 Inventory
Quantity (t) Quantity Quantity (百万円) Others Quantity
Weight(t)
Value(Million Yen)
Quantity
平成 25 年 - - - - - - - C.Y. 201326 - - - - - - - C.Y. 201427 - - - - - - - C.Y. 201528 1,001,588 68,085 408,462 972,684 34,548 432,669 64,964 C.Y. 201629 1,072,089 72,420 458,312 1,051,615 36,104 468,628 75,145 C.Y. 2017
平成 27 年度 - - - - - - - F.Y. 201528 1,015,423 69,005 420,767 989,206 34,739 442,988 77,813 F.Y. 2016
29 年 1~3月 249,407 16,880 103,601 234,087 8,074 106,079 77,813 Q1 20174~6月 267,091 18,104 114,196 259,411 8,905 115,987 83,711 Q27~9月 265,778 17,929 114,966 258,380 8,899 117,698 88,383 Q310~12月 289,813 19,507 125,549 299,737 10,226 128,864 75,145 Q4
29 年 1月 74,312 4,956 28,045 65,823 2,274 29,358 72,141 Jan. 20172月 84,136 5,669 35,283 80,149 2,757 35,875 75,541 Feb.3月 90,959 6,255 40,273 88,115 3,043 40,846 77,813 Mar.4月 89,000 6,054 39,092 89,449 3,134 39,628 76,834 Apr.5月 86,967 5,877 35,570 81,247 2,776 36,161 81,963 May 6月 91,124 6,173 39,534 88,715 2,995 40,198 83,711 Jun.7月 90,585 6,117 40,900 82,872 2,849 42,093 90,232 Jul.8月 89,347 6,038 39,799 91,273 3,136 40,679 87,428 Aug.9月 85,846 5,774 34,267 84,235 2,914 34,926 88,383 Sep.10月 96,077 6,511 41,691 89,966 3,066 42,943 93,238 Oct.11月 99,567 6,697 42,888 96,049 3,260 44,713 94,936 Nov.12月 94,169 6,299 40,970 113,722 3,900 41,208 75,145 Dec.
単位:千枚 / Unit:1000sheets
受入数量 在庫数量
数 量 重 量 Receipts 数 量 金 額 その他 Inventory
Quantity (t) Quantity Quantity (百万円) Others Quantity
Weight(t)
Value(Million Yen)
Quantity
平成 25 年 - - - - - - - C.Y. 201326 - - - - - - - C.Y. 201427 - - - - - - - C.Y. 201528 152,767 9,944 42,293 172,697 3,217 23,610 12,512 C.Y. 201629 141,482 9,291 44,982 164,346 3,063 23,466 11,165 C.Y. 2017
平成 27 年度 - - - - - - - F.Y. 201528 148,332 9,640 41,851 168,864 3,146 23,565 14,354 F.Y. 2016
29 年 1~3月 35,325 2,316 10,279 38,237 712 5,526 14,354 Q1 20174~6月 36,602 2,433 11,607 41,182 760 5,960 15,425 Q27~9月 36,290 2,371 10,812 40,842 767 5,683 16,000 Q310~12月 33,265 2,171 12,284 44,085 824 6,297 11,165 Q4
29 年 1月 10,349 672 2,496 10,774 199 1,476 13,107 Jan. 20172月 10,856 725 3,925 12,762 237 2,136 12,991 Feb.3月 14,120 919 3,858 14,701 276 1,914 14,354 Mar.4月 12,191 824 4,033 14,745 274 2,043 13,791 Apr.5月 13,997 920 3,741 12,881 238 1,970 16,680 May 6月 10,414 689 3,833 13,556 248 1,947 15,425 Jun.7月 11,471 747 3,655 13,468 253 2,001 15,079 Jul.8月 11,603 765 3,696 14,368 269 1,897 14,115 Aug.9月 13,216 859 3,461 13,006 245 1,785 16,000 Sep.10月 10,394 681 3,964 14,124 259 2,056 14,179 Oct.11月 10,382 676 4,319 13,902 260 2,109 12,867 Nov.12月 12,489 814 4,001 16,059 305 2,132 11,165 Dec.
*平成28年1月より調査開始。
年 月
(2) フラット Flat-type
生 産 出荷数量 Shipment Quantity
Production 販売 SalesYear andMonth
Production 販売 Sales
年 月
② パンツ式 Pull-on style
Year andMonth
生 産 出荷数量 Shipment Quantity
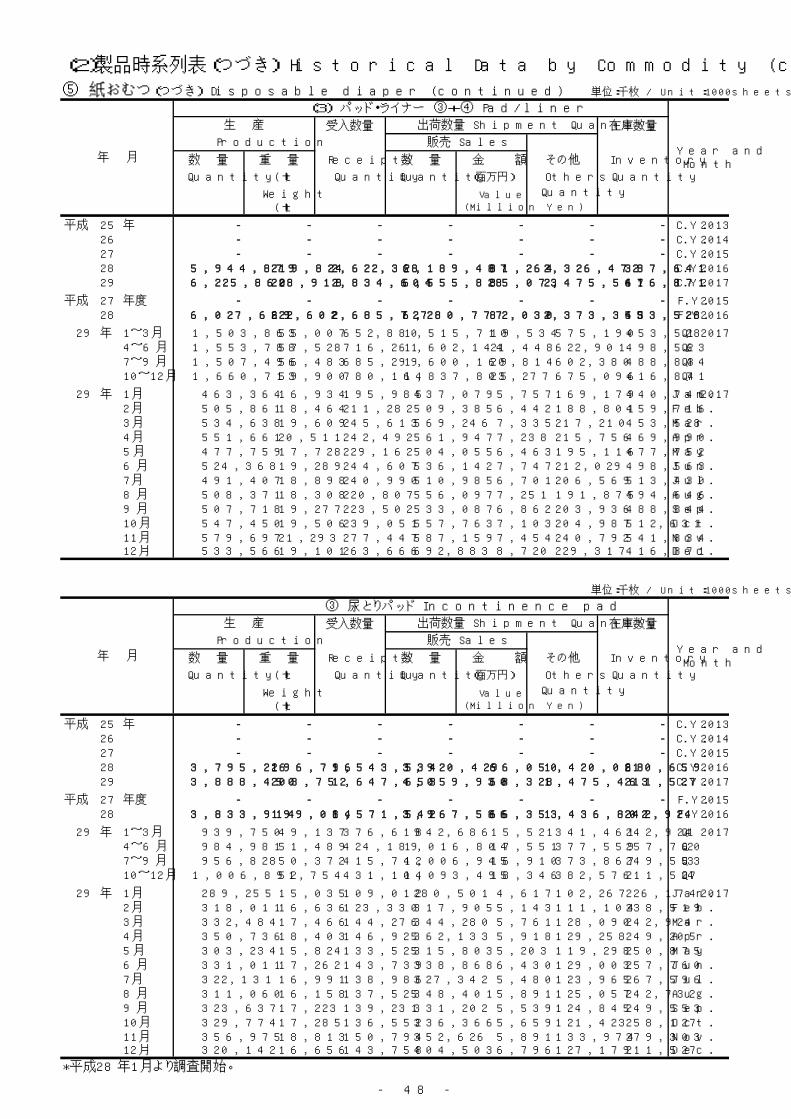
- 48 -
(2)製品時系列表(つづき) Historical Data by Commodity (continued)
⑤ 紙おむつ(つづき) Disposable diaper (continued) 単位:千枚 / Unit:1000sheets
受入数量 在庫数量
数 量 重 量 Receipts 数 量 金 額 その他 Inventory
Quantity (t) Quantity Quantity (百万円) Others Quantity
Weight(t)
Value(Million Yen)
Quantity
平成 25 年 - - - - - - - C.Y. 201326 - - - - - - - C.Y. 201427 - - - - - - - C.Y. 201528 5,944,879 219,824 2,622,328 6,189,487 81,264 2,326,472 387,641 C.Y. 201629 6,225,860 228,918 2,834,604 6,555,828 85,073 2,475,567 416,871 C.Y. 2017
平成 27 年度 - - - - - - - F.Y. 201528 6,027,669 222,602 2,685,727 6,280,777 82,030 2,373,353 453,528 F.Y. 2016
29 年 1~3月 1,503,863 55,007 652,880 1,515,710 19,534 575,190 453,528 Q1 20174~6月 1,553,788 57,528 716,261 1,602,144 21,448 622,901 498,563 Q27~9月 1,507,496 56,483 685,299 1,600,169 20,814 602,380 488,844 Q310~12月 1,660,713 59,900 780,164 1,837,805 23,277 675,096 416,871 Q4
29 年 1月 463,364 16,934 195,985 437,079 5,757 169,179 440,746 Jan. 20172月 505,861 18,464 211,282 509,385 6,442 188,801 459,716 Feb.3月 534,638 19,609 245,613 569,246 7,335 217,210 453,528 Mar.4月 551,661 20,511 242,492 561,947 7,238 215,756 469,990 Apr.5月 477,759 17,728 229,162 504,055 6,463 195,116 477,752 May 6月 524,368 19,289 244,607 536,142 7,747 212,029 498,563 Jun.7月 491,407 18,898 240,990 510,985 6,701 206,569 513,430 Jul.8月 508,371 18,308 220,807 556,097 7,251 191,875 494,646 Aug.9月 507,718 19,277 223,502 533,087 6,862 203,936 488,844 Sep.10月 547,450 19,506 239,051 557,763 7,103 204,987 512,631 Oct.11月 579,697 21,293 277,447 587,159 7,454 240,792 541,834 Nov.12月 533,566 19,101 263,666 692,883 8,720 229,317 416,871 Dec.
単位:千枚 / Unit:1000sheets
受入数量 在庫数量
数 量 重 量 Receipts 数 量 金 額 その他 Inventory
Quantity (t) Quantity Quantity (百万円) Others Quantity
Weight(t)
Value(Million Yen)
Quantity
平成 25 年 - - - - - - - C.Y. 201326 - - - - - - - C.Y. 201427 - - - - - - - C.Y. 201528 3,795,226 196,796 1,543,534 3,920,429 66,050 1,420,068 210,659 C.Y. 201629 3,888,450 203,752 1,647,653 4,059,930 68,328 1,475,463 211,527 C.Y. 2017
平成 27 年度 - - - - - - - F.Y. 201528 3,833,914 199,084 1,571,542 3,967,586 66,353 1,436,802 242,924 F.Y. 2016
29 年 1~3月 939,750 49,137 376,618 942,686 15,521 341,461 242,924 Q1 20174~6月 984,981 51,489 424,189 1,016,804 17,551 377,559 257,760 Q27~9月 956,828 50,372 415,742 1,006,945 16,910 373,867 249,553 Q310~12月 1,006,891 52,754 431,104 1,093,495 18,346 382,576 211,527 Q4
29 年 1月 289,255 15,035 109,012 280,501 4,617 102,267 226,174 Jan. 20172月 318,011 16,636 123,330 317,905 5,143 111,104 238,519 Feb.3月 332,484 17,466 144,276 344,280 5,761 128,090 242,924 Mar.4月 350,736 18,403 146,925 362,133 5,918 129,258 249,205 Apr.5月 303,234 15,824 133,525 315,803 5,203 119,298 250,875 May 6月 331,011 17,262 143,739 338,868 6,430 129,003 257,760 Jun.7月 322,131 16,991 138,986 327,342 5,480 123,965 267,596 Jul.8月 311,060 16,158 137,525 348,401 5,891 125,057 242,732 Aug.9月 323,637 17,223 139,231 331,202 5,539 124,845 249,553 Sep.10月 329,774 17,285 136,552 336,366 5,659 121,423 258,127 Oct.11月 356,975 18,813 150,794 352,626 5,891 133,974 279,303 Nov.12月 320,142 16,656 143,758 404,503 6,796 127,179 211,527 Dec.
*平成28年1月より調査開始。
Production 販売 Sales
③ 尿とりパッド Incontinence pad
Year andMonth
生 産 出荷数量 Shipment Quantity
年 月
年 月
(3) パッド・ライナー ③+④ Pad/liner
Year andMonth
生 産 出荷数量 Shipment Quantity
Production 販売 Sales
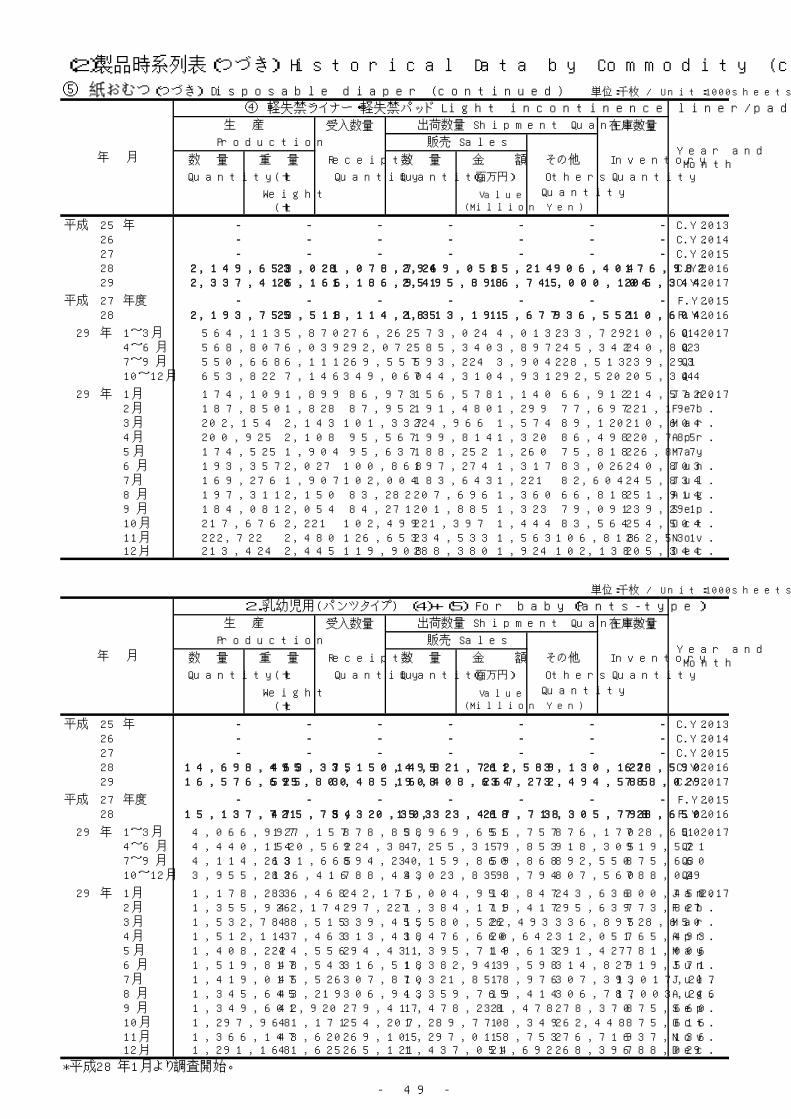
- 49 -
(2)製品時系列表(つづき) Historical Data by Commodity (continued)
⑤ 紙おむつ(つづき) Disposable diaper (continued) 単位:千枚 / Unit:1000sheets
受入数量 在庫数量
数 量 重 量 Receipts 数 量 金 額 その他 Inventory
Quantity (t) Quantity Quantity (百万円) Others Quantity
Weight(t)
Value(Million Yen)
Quantity
平成 25 年 - - - - - - - C.Y. 201326 - - - - - - - C.Y. 201427 - - - - - - - C.Y. 201528 2,149,653 23,028 1,078,794 2,269,058 15,214 906,404 176,982 C.Y. 201629 2,337,410 25,166 1,186,951 2,495,898 16,745 1,000,104 205,344 C.Y. 2017
平成 27 年度 - - - - - - - F.Y. 201528 2,193,755 23,518 1,114,185 2,313,191 15,677 936,551 210,604 F.Y. 2016
29 年 1~3月 564,113 5,870 276,262 573,024 4,013 233,729 210,604 Q1 20174~6月 568,807 6,039 292,072 585,340 3,897 245,342 240,803 Q27~9月 550,668 6,111 269,557 593,224 3,904 228,513 239,291 Q310~12月 653,822 7,146 349,060 744,310 4,931 292,520 205,344 Q4
29 年 1月 174,109 1,899 86,973 156,578 1,140 66,912 214,572 Jan. 20172月 187,850 1,828 87,952 191,480 1,299 77,697 221,197 Feb.3月 202,154 2,143 101,337 224,966 1,574 89,120 210,604 Mar.4月 200,925 2,108 95,567 199,814 1,320 86,498 220,785 Apr.5月 174,525 1,904 95,637 188,252 1,260 75,818 226,877 May 6月 193,357 2,027 100,868 197,274 1,317 83,026 240,803 Jun.7月 169,276 1,907 102,004 183,643 1,221 82,604 245,834 Jul.8月 197,311 2,150 83,282 207,696 1,360 66,818 251,914 Aug.9月 184,081 2,054 84,271 201,885 1,323 79,091 239,291 Sep.10月 217,676 2,221 102,499 221,397 1,444 83,564 254,504 Oct.11月 222,722 2,480 126,653 234,533 1,563 106,818 262,531 Nov.12月 213,424 2,445 119,908 288,380 1,924 102,138 205,344 Dec.
単位:千枚 / Unit:1000sheets
受入数量 在庫数量
数 量 重 量 Receipts 数 量 金 額 その他 Inventory
Quantity (t) Quantity Quantity (百万円) Others Quantity
Weight(t)
Value(Million Yen)
Quantity
平成 25 年 - - - - - - - C.Y. 201326 - - - - - - - C.Y. 201427 - - - - - - - C.Y. 201528 14,698,495 463,375 3,150,495 14,821,761 212,589 3,130,127 628,590 C.Y. 201629 16,576,695 525,800 3,485,908 16,408,667 234,272 3,494,585 788,029 C.Y. 2017
平成 27 年度 - - - - - - - F.Y. 201528 15,137,721 475,754 3,320,303 15,323,468 217,718 3,305,798 728,650 F.Y. 2016
29 年 1~3月 4,066,997 127,157 878,858 3,969,651 55,757 876,170 728,650 Q1 20174~6月 4,440,152 140,562 924,387 4,255,317 59,853 918,305 919,571 Q27~9月 4,114,263 131,665 894,230 4,159,860 59,868 892,550 875,660 Q310~12月 3,955,283 126,416 788,433 4,023,839 58,794 807,560 788,029 Q4
29 年 1月 1,178,283 36,468 242,176 1,004,954 13,847 243,636 800,458 Jan. 20172月 1,355,926 42,174 297,227 1,384,171 19,417 295,639 773,827 Feb.3月 1,532,788 48,515 339,455 1,580,526 22,493 336,895 728,650 Mar.4月 1,512,113 47,463 313,438 1,476,660 20,642 312,051 765,493 Apr.5月 1,408,222 44,556 294,431 1,395,714 19,613 291,427 781,006 May 6月 1,519,817 48,543 316,518 1,382,943 19,598 314,827 919,571 Jun.7月 1,419,017 45,526 307,870 1,321,857 18,976 307,393 1,017,207 Jul.8月 1,345,645 43,219 306,943 1,359,765 19,414 306,787 1,003,246 Aug.9月 1,349,601 42,920 279,417 1,478,238 21,478 278,370 875,660 Sep.10月 1,297,968 41,171 254,207 1,289,770 18,349 262,448 875,616 Oct.11月 1,366,147 43,620 269,105 1,297,015 18,753 276,716 937,136 Nov.12月 1,291,168 41,625 265,121 1,437,054 21,692 268,396 788,029 Dec.
*平成28年1月より調査開始。
Production 販売 Sales
年 月
2.乳幼児用(パンツタイプ) (4)+(5) For baby(Pants-type)
生 産 出荷数量 Shipment Quantity
Year andMonth
年 月
④ 軽失禁ライナー・軽失禁パッド Light incontinence liner/pad
Year andMonth
生 産 出荷数量 Shipment Quantity
Production 販売 Sales
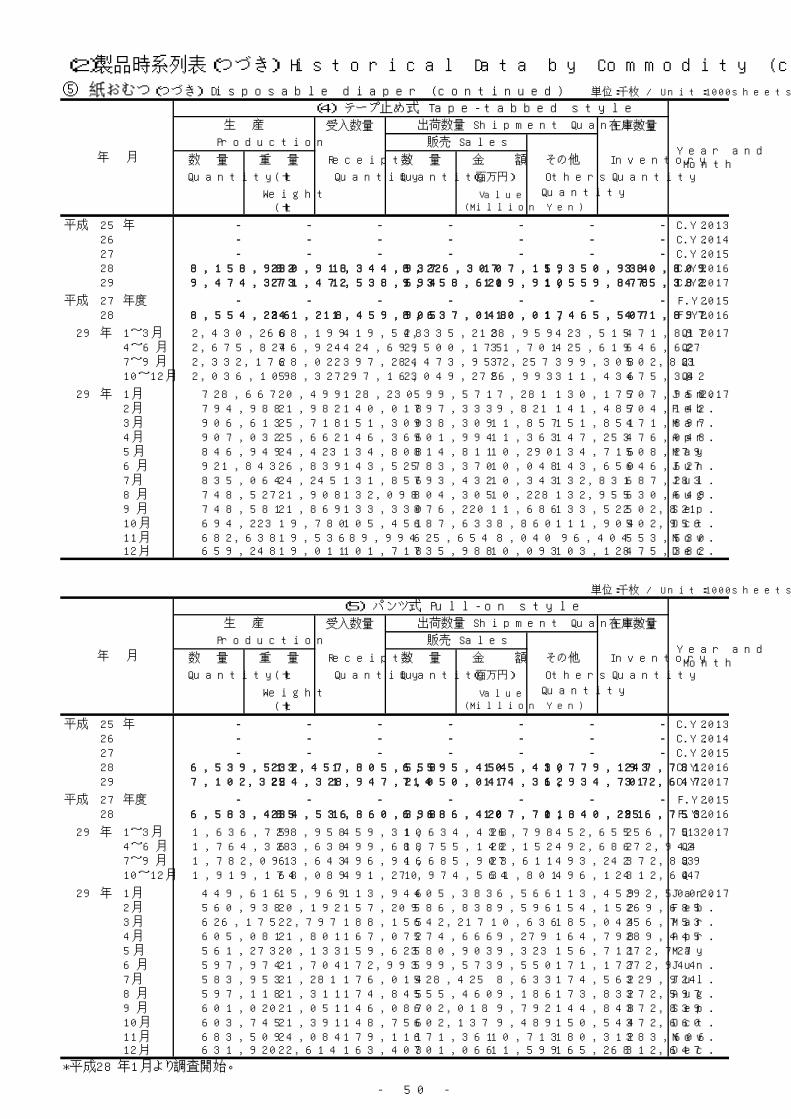
- 50 -
(2)製品時系列表(つづき) Historical Data by Commodity (continued)
⑤ 紙おむつ(つづき) Disposable diaper (continued) 単位:千枚 / Unit:1000sheets
受入数量 在庫数量
数 量 重 量 Receipts 数 量 金 額 その他 Inventory
Quantity (t) Quantity Quantity (百万円) Others Quantity
Weight(t)
Value(Million Yen)
Quantity
平成 25 年 - - - - - - - C.Y. 201326 - - - - - - - C.Y. 201427 - - - - - - - C.Y. 201528 8,158,982 230,918 1,344,937 8,226,307 107,159 1,350,934 380,809 C.Y. 201629 9,474,373 271,472 1,538,694 9,358,620 119,910 1,559,878 475,382 C.Y. 2017
平成 27 年度 - - - - - - - F.Y. 201528 8,554,236 241,218 1,459,905 8,637,048 110,017 1,465,507 471,897 F.Y. 2016
29 年 1~3月 2,430,268 68,199 419,548 2,335,213 28,959 423,515 471,897 Q1 20174~6月 2,675,824 76,924 424,699 2,500,175 31,701 425,619 646,627 Q27~9月 2,332,172 68,022 397,284 2,473,957 32,257 399,308 502,821 Q310~12月 2,036,109 58,327 297,163 2,049,275 26,993 311,436 475,382 Q4
29 年 1月 728,667 20,499 128,230 599,571 7,281 130,177 507,958 Jan. 20172月 794,988 21,982 140,018 797,333 9,821 141,487 504,142 Feb.3月 906,613 25,718 151,300 938,309 11,857 151,851 471,897 Mar.4月 907,032 25,662 146,366 901,994 11,363 147,253 476,048 Apr.5月 846,949 24,423 134,808 814,811 10,290 134,716 508,279 May 6月 921,843 26,839 143,525 783,370 10,048 143,650 646,627 Jun.7月 835,064 24,245 131,856 793,432 10,343 132,831 687,283 Jul.8月 748,527 21,908 132,098 804,305 10,228 132,955 630,649 Aug.9月 748,581 21,869 133,330 876,220 11,686 133,522 502,821 Sep.10月 694,223 19,780 105,451 687,633 8,860 111,904 502,956 Oct.11月 682,638 19,536 89,994 625,654 8,040 96,404 553,530 Nov.12月 659,248 19,011 101,718 735,988 10,093 103,128 475,382 Dec.
単位:千枚 / Unit:1000sheets
受入数量 在庫数量
数 量 重 量 Receipts 数 量 金 額 その他 Inventory
Quantity (t) Quantity Quantity (百万円) Others Quantity
Weight(t)
Value(Million Yen)
Quantity
平成 25 年 - - - - - - - C.Y. 201326 - - - - - - - C.Y. 201427 - - - - - - - C.Y. 201528 6,539,513 232,457 1,805,558 6,595,454 105,430 1,779,193 247,781 C.Y. 201629 7,102,322 254,328 1,947,214 7,050,047 114,362 1,934,707 312,647 C.Y. 2017
平成 27 年度 - - - - - - - F.Y. 201528 6,583,485 234,536 1,860,398 6,686,420 107,701 1,840,291 256,753 F.Y. 2016
29 年 1~3月 1,636,729 58,958 459,310 1,634,438 26,798 452,655 256,753 Q1 20174~6月 1,764,328 63,638 499,688 1,755,142 28,152 492,686 272,944 Q27~9月 1,782,091 63,643 496,946 1,685,903 27,611 493,242 372,839 Q310~12月 1,919,174 68,089 491,270 1,974,564 31,801 496,124 312,647 Q4
29 年 1月 449,616 15,969 113,946 405,383 6,566 113,459 292,500 Jan. 20172月 560,938 20,192 157,209 586,838 9,596 154,152 269,685 Feb.3月 626,175 22,797 188,155 642,217 10,636 185,044 256,753 Mar.4月 605,081 21,801 167,072 574,666 9,279 164,798 289,445 Apr.5月 561,273 20,133 159,623 580,903 9,323 156,711 272,727 May 6月 597,974 21,704 172,993 599,573 9,550 171,177 272,944 Jun.7月 583,953 21,281 176,014 528,425 8,633 174,562 329,924 Jul.8月 597,118 21,311 174,845 555,460 9,186 173,832 372,597 Aug.9月 601,020 21,051 146,087 602,018 9,792 144,848 372,839 Sep.10月 603,745 21,391 148,756 602,137 9,489 150,544 372,660 Oct.11月 683,509 24,084 179,111 671,361 10,713 180,312 383,606 Nov.12月 631,920 22,614 163,403 701,066 11,599 165,268 312,647 Dec.
*平成28年1月より調査開始。
(5) パンツ式 Pull-on style
Year andMonth
生 産 出荷数量 Shipment Quantity
Production 販売 Sales
年 月
年 月
(4) テープ止め式 Tape-tabbed style
Year andMonth
生 産 出荷数量 Shipment Quantity
Production 販売 Sales
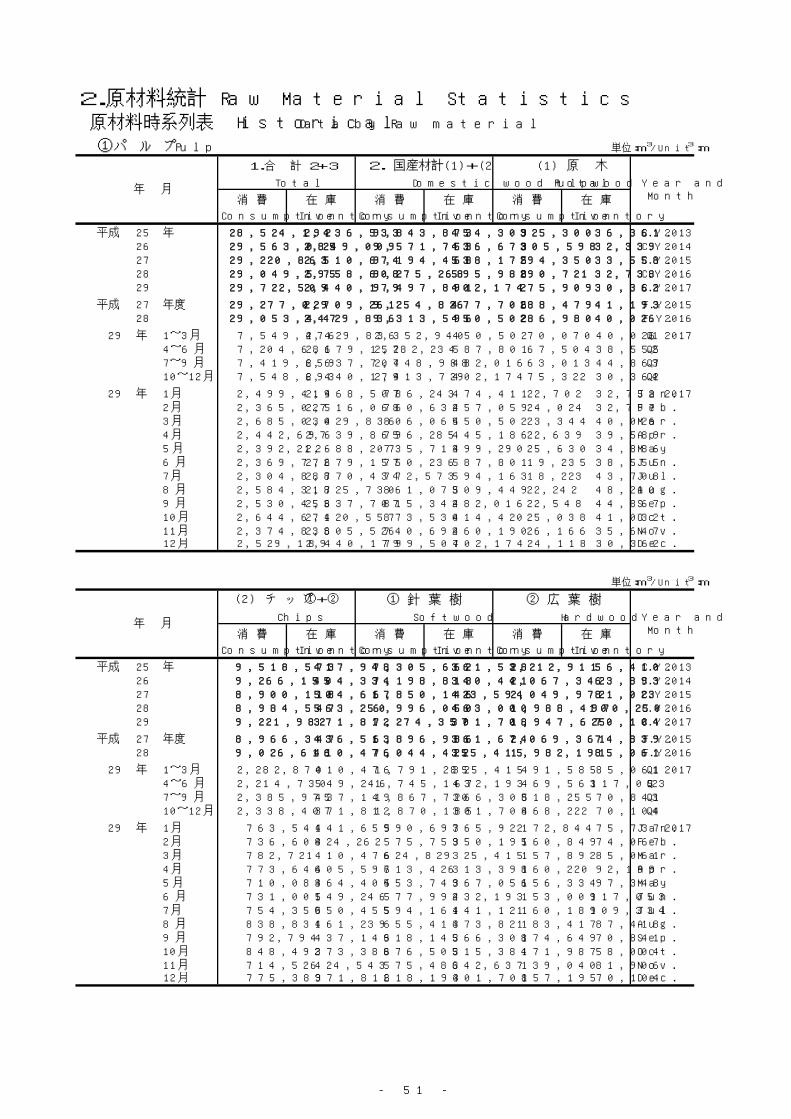
- 51 -
2.原材料統計 Raw Material Statistics 原材料時系列表 Historical Data by Raw material
①パ ル プ Pulp 単位:m3/Unit:m3
消 費 在 庫 消 費 在 庫 消 費 在 庫
Consumption Inventory Consumption Inventory Consumption Inventory
平成 25 年 28,524,192 2,436,533 9,843,873 454,309 325,300 36,361 C.Y. 201326 29,563,085 2,249,009 9,571,753 436,673 305,598 32,339 C.Y. 201427 29,220,863 2,510,674 9,194,468 538,175 294,350 33,558 C.Y. 201528 29,049,595 2,758,608 9,275,268 595,988 290,721 32,738 C.Y. 201629 29,722,509 2,440,179 9,497,891 402,174 275,909 30,362 C.Y. 2017
平成 27 年度 29,277,029 2,709,261 9,254,826 477,706 288,479 41,193 F.Y. 201528 29,053,447 2,429,836 9,313,596 450,502 286,980 40,026 F.Y. 2016
29 年 1~3月 7,549,476 2,429,836 2,352,940 450,502 70,070 40,026 Q1 20174~6月 7,204,681 2,679,157 2,282,234 587,801 67,504 38,555 Q27~9月 7,419,659 2,637,707 2,448,988 482,016 63,013 44,867 Q310~12月 7,548,693 2,440,179 2,413,729 402,174 75,322 30,362 Q4
29 年 1月 2,499,419 2,468,507 786,243 474,411 22,702 32,752 Jan. 20172月 2,365,027 2,516,068 760,632 457,059 24,024 32,797 Feb.3月 2,685,030 2,429,836 806,065 450,502 23,344 40,026 Mar.4月 2,442,697 2,639,865 796,285 445,186 22,639 39,589 Apr.5月 2,392,212 2,688,207 735,713 499,290 25,630 34,886 May 6月 2,369,772 2,679,157 750,236 587,801 19,235 38,555 Jun.7月 2,304,888 2,770,434 772,573 594,163 18,223 43,708 Jul.8月 2,584,318 2,725,730 861,073 509,449 22,242 48,210 Aug.9月 2,530,453 2,637,707 815,342 482,016 22,548 44,867 Sep.10月 2,644,671 2,420,557 873,530 414,420 25,038 41,032 Oct.11月 2,374,833 2,605,526 740,692 460,190 26,166 35,647 Nov.12月 2,529,189 2,440,179 799,507 402,174 24,118 30,362 Dec.
単位:m3/Unit:m3
消 費 在 庫 消 費 在 庫 消 費 在 庫
Consumption Inventory Consumption Inventory Consumption Inventory
平成 25 年 9,518,573 417,948 7,305,662 361,538 2,212,911 56,410 C.Y. 201326 9,266,155 404,334 7,198,813 340,441 2,067,342 63,893 C.Y. 201427 8,900,118 504,617 6,850,146 423,594 2,049,972 81,023 C.Y. 201528 8,984,547 563,250 6,996,050 463,000 1,988,497 100,250 C.Y. 201629 9,221,982 371,812 7,274,357 301,708 1,947,625 70,104 C.Y. 2017
平成 27 年度 8,966,347 436,513 6,896,986 361,674 2,069,361 74,839 F.Y. 201528 9,026,616 410,476 7,044,425 325,415 1,982,191 85,061 F.Y. 2016
29 年 1~3月 2,282,870 410,476 1,791,285 325,415 491,585 85,061 Q1 20174~6月 2,214,730 549,246 1,745,167 432,193 469,563 117,053 Q27~9月 2,385,975 437,149 1,867,720 366,308 518,255 70,841 Q310~12月 2,338,407 371,812 1,870,185 301,708 468,222 70,104 Q4
29 年 1月 763,541 441,659 590,697 365,922 172,844 75,737 Jan. 20172月 736,608 424,262 575,759 350,195 160,849 74,067 Feb.3月 782,721 410,476 624,829 325,415 157,892 85,061 Mar.4月 773,646 405,597 613,426 313,398 160,220 92,199 Apr.5月 710,083 464,404 553,749 367,056 156,334 97,348 May 6月 731,001 549,246 577,992 432,193 153,009 117,053 Jun.7月 754,350 550,455 594,161 441,121 160,189 109,334 Jul.8月 838,831 461,239 655,414 373,821 183,417 87,418 Aug.9月 792,794 437,149 618,145 366,308 174,649 70,841 Sep.10月 848,492 373,388 676,505 315,384 171,987 58,004 Oct.11月 714,526 424,543 575,486 342,637 139,040 81,906 Nov.12月 775,389 371,812 618,194 301,708 157,195 70,104 Dec.
Chips Softwood Hardwood 年 月
(2) チ ッ プ ①+② ① 針 葉 樹 ② 広 葉 樹
Year andMonth
Total Domestic wood total Pulpwood 年 月
1.合 計 2+3 2. 国産材計(1)+(2) (1) 原 木
Year andMonth
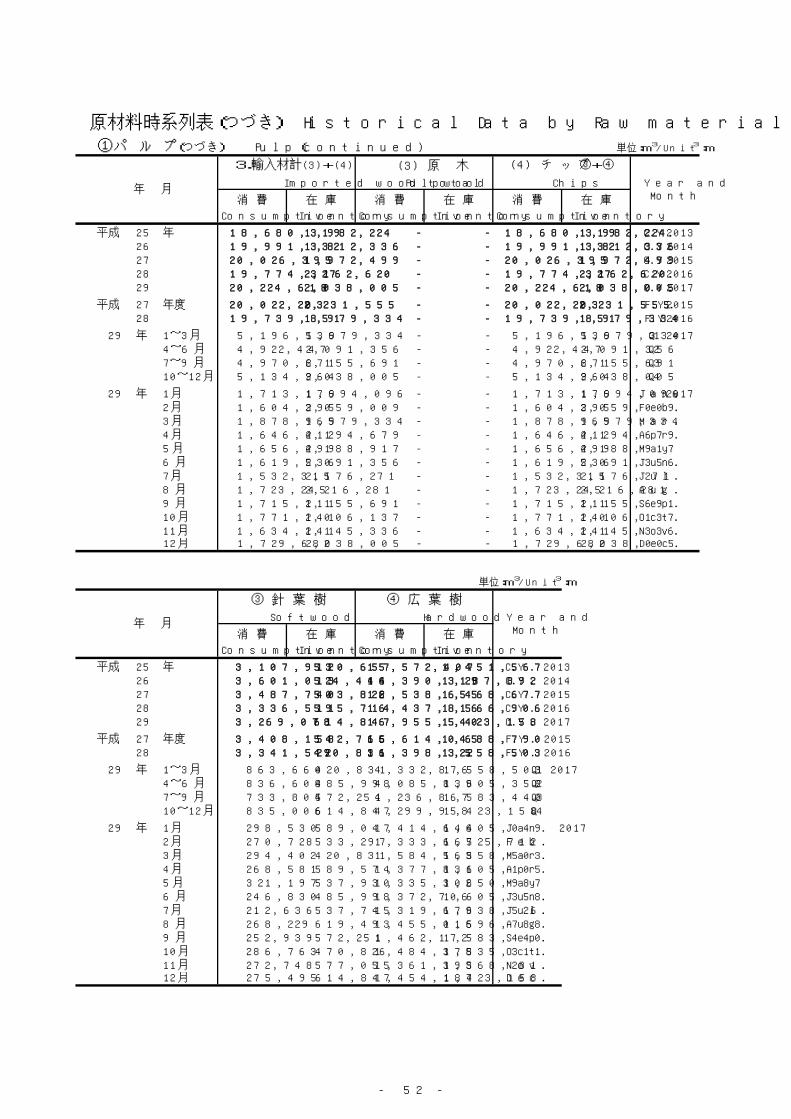
- 52 -
原材料時系列表(つづき) Historical Data by Raw material (continued)
①パ ル プ (つづき) Pulp(continued) 単位:m3/Unit:m3
消 費 在 庫 消 費 在 庫 消 費 在 庫
Consumption Inventory Consumption Inventory Consumption Inventory
平成 25 年 18,680,319 1,982,224 - - 18,680,319 1,982,224 C.Y. 201326 19,991,332 1,812,336 - - 19,991,332 1,812,336 C.Y. 201427 20,026,395 1,972,499 - - 20,026,395 1,972,499 C.Y. 201528 19,774,327 2,162,620 - - 19,774,327 2,162,620 C.Y. 201629 20,224,618 2,038,005 - - 20,224,618 2,038,005 C.Y. 2017
平成 27 年度 20,022,203 2,231,555 - - 20,022,203 2,231,555 F.Y. 201528 19,739,851 1,979,334 - - 19,739,851 1,979,334 F.Y. 2016
29 年 1~3月 5,196,536 1,979,334 - - 5,196,536 1,979,334 Q1 20174~6月 4,922,447 2,091,356 - - 4,922,447 2,091,356 Q27~9月 4,970,671 2,155,691 - - 4,970,671 2,155,691 Q310~12月 5,134,964 2,038,005 - - 5,134,964 2,038,005 Q4
29 年 1月 1,713,176 1,994,096 - - 1,713,176 1,994,096 Jan. 20172月 1,604,395 2,059,009 - - 1,604,395 2,059,009 Feb.3月 1,878,965 1,979,334 - - 1,878,965 1,979,334 Mar.4月 1,646,412 2,194,679 - - 1,646,412 2,194,679 Apr.5月 1,656,499 2,188,917 - - 1,656,499 2,188,917 May 6月 1,619,536 2,091,356 - - 1,619,536 2,091,356 Jun.7月 1,532,315 2,176,271 - - 1,532,315 2,176,271 Jul.8月 1,723,245 2,216,281 - - 1,723,245 2,216,281 Aug.9月 1,715,111 2,155,691 - - 1,715,111 2,155,691 Sep.10月 1,771,141 2,006,137 - - 1,771,141 2,006,137 Oct.11月 1,634,141 2,145,336 - - 1,634,141 2,145,336 Nov.12月 1,729,682 2,038,005 - - 1,729,682 2,038,005 Dec.
単位:m3/Unit:m3
消 費 在 庫 消 費 在 庫
Consumption Inventory Consumption Inventory
平成 25 年 3,107,912 530,657 15,572,407 1,451,567 C.Y. 201326 3,601,013 524,444 16,390,319 1,287,892 C.Y. 201427 3,487,740 503,822 16,538,655 1,468,677 C.Y. 201528 3,336,511 595,714 16,437,816 1,566,906 C.Y. 201629 3,269,078 614,847 16,955,540 1,423,158 C.Y. 2017
平成 27 年度 3,408,158 542,765 16,614,045 1,688,790 F.Y. 201528 3,341,529 420,831 16,398,322 1,558,503 F.Y. 2016
29 年 1~3月 863,660 420,831 4,332,876 1,558,503 Q1 20174~6月 836,608 485,998 4,085,839 1,605,358 Q27~9月 733,804 572,251 4,236,867 1,583,440 Q310~12月 835,006 614,847 4,299,958 1,423,158 Q4
29 年 1月 298,530 589,047 1,414,646 1,405,049 Jan. 20172月 270,728 533,297 1,333,667 1,525,712 Feb.3月 294,402 420,831 1,584,563 1,558,503 Mar.4月 268,581 589,574 1,377,831 1,605,105 Apr.5月 321,197 537,930 1,335,302 1,650,987 May 6月 246,830 485,998 1,372,706 1,605,358 Jun.7月 212,636 537,745 1,319,679 1,638,526 Jul.8月 268,229 619,493 1,455,016 1,596,788 Aug.9月 252,939 572,251 1,462,172 1,583,440 Sep.10月 286,763 470,826 1,484,378 1,535,311 Oct.11月 272,748 577,055 1,361,393 1,568,281 Nov.12月 275,495 614,847 1,454,187 1,423,158 Dec.
Year andMonth
Softwood Hardwood
③ 針 葉 樹
年 月
④ 広 葉 樹
3.輸入材計(3)+(4) (3) 原 木 (4) チ ッ プ ③+④
Year andMonth
Imported wood total Pulpwood Chips 年 月
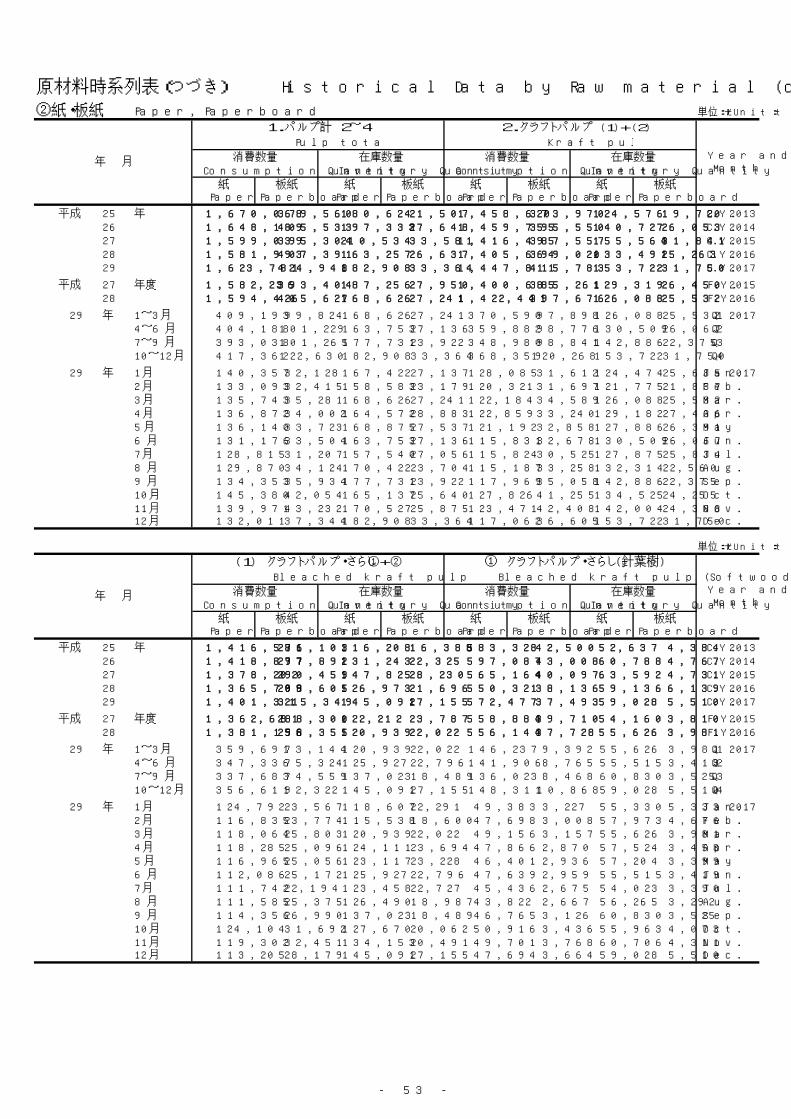
- 53 -
原材料時系列表(つづき) Historical Data by Raw material (continued)
②紙・板紙 Paper, Paperboard 単位:t/Unit:t
紙 板紙 紙 板紙 紙 板紙 紙 板紙Paper Paperboard Paper Paperboard Paper Paperboard Paper Paperboard
平成 25 年 1,670,068 379,560 180,624 21,507 1,458,620 373,970 124,576 19,720 C.Y. 201326 1,648,189 405,533 197,333 27,648 1,459,755 395,550 140,727 26,053 C.Y. 201427 1,599,039 395,304 210,534 33,581 1,416,495 387,557 155,564 31,841 C.Y. 201528 1,581,993 407,391 163,257 26,637 1,405,664 399,020 133,491 25,263 C.Y. 201629 1,623,781 424,948 182,908 33,364 1,447,811 415,783 153,722 31,750 C.Y. 2017
平成 27 年度 1,582,236 393,404 187,256 27,950 1,400,685 385,261 129,319 26,450 F.Y. 201528 1,594,426 405,627 168,626 27,241 1,422,441 397,676 126,088 25,532 F.Y. 2016
29 年 1~3月 409,193 99,824 168,626 27,241 370,590 97,898 126,088 25,532 Q1 20174~6月 404,188 101,229 163,753 27,136 359,882 98,776 130,509 26,067 Q27~9月 393,038 101,265 177,731 23,922 348,980 98,841 142,886 22,375 Q310~12月 417,362 122,630 182,908 33,364 368,359 120,268 153,722 31,750 Q4
29 年 1月 140,357 32,128 167,422 27,137 128,085 31,612 124,474 25,685 Jan. 20172月 133,093 32,415 158,583 23,179 120,321 31,697 121,775 21,837 Feb.3月 135,743 35,281 168,626 27,241 122,184 34,589 126,088 25,532 Mar.4月 136,872 34,002 164,572 28,883 122,859 33,240 129,182 27,436 Apr.5月 136,140 33,723 168,875 27,537 121,192 32,858 127,886 26,391 May 6月 131,176 33,504 163,753 27,136 115,831 32,678 130,509 26,067 Jun.7月 128,815 31,207 157,540 27,056 115,824 30,525 127,875 25,834 Jul.8月 129,870 34,124 170,422 23,704 115,187 33,258 132,314 22,560 Aug.9月 134,353 35,934 177,731 23,922 117,969 35,058 142,886 22,375 Sep.10月 145,380 42,054 165,137 25,640 127,826 41,255 134,525 24,255 Oct.11月 139,971 43,232 170,527 25,875 123,471 42,408 142,004 24,388 Nov.12月 132,011 37,344 182,908 33,364 117,062 36,605 153,722 31,750 Dec.
単位:t/Unit:t
紙 板紙 紙 板紙 紙 板紙 紙 板紙Paper Paperboard Paper Paperboard Paper Paperboard Paper Paperboard
平成 25 年 1,416,581 276,103 116,208 16,388 583,328 42,500 52,637 4,384 C.Y. 201326 1,418,877 297,892 131,243 22,325 597,087 43,008 60,788 4,767 C.Y. 201427 1,378,202 290,459 147,825 28,230 565,164 40,097 63,592 4,731 C.Y. 201528 1,365,709 298,605 126,973 21,696 550,321 38,136 59,136 6,139 C.Y. 201629 1,401,321 315,349 145,091 27,155 572,477 37,493 59,028 5,510 C.Y. 2017
平成 27 年度 1,362,681 288,300 122,212 23,787 558,884 39,710 54,160 3,810 F.Y. 201528 1,381,156 298,355 120,939 22,022 556,144 37,728 55,626 3,981 F.Y. 2016
29 年 1~3月 359,691 73,144 120,939 22,022 146,237 9,392 55,626 3,981 Q1 20174~6月 347,336 75,324 125,927 22,796 141,906 8,765 55,515 3,419 Q27~9月 337,683 74,559 137,023 18,489 136,023 8,468 60,830 3,525 Q310~12月 356,611 92,322 145,091 27,155 148,311 10,868 59,028 5,510 Q4
29 年 1月 124,792 23,567 118,607 22,291 49,383 3,227 55,330 5,333 Jan. 20172月 116,835 23,774 115,538 18,600 47,698 3,008 57,973 4,676 Feb.3月 118,064 25,803 120,939 22,022 49,156 3,157 55,626 3,981 Mar.4月 118,285 25,096 124,111 23,694 47,866 2,870 57,524 3,458 Apr.5月 116,965 25,056 123,117 23,228 46,401 2,936 57,204 3,399 May 6月 112,086 25,172 125,927 22,796 47,639 2,959 55,515 3,419 Jun.7月 111,742 22,194 123,458 22,727 45,436 2,675 54,023 3,390 Jul.8月 111,585 25,375 126,490 18,987 43,822 2,667 56,265 3,292 Aug.9月 114,356 26,990 137,023 18,489 46,765 3,126 60,830 3,525 Sep.10月 124,104 31,692 127,670 20,062 50,916 3,436 55,963 4,073 Oct.11月 119,302 32,451 134,153 20,491 49,701 3,768 60,706 4,311 Nov.12月 113,205 28,179 145,091 27,155 47,694 3,664 59,028 5,510 Dec.
Consumption Quantity Inventory Quantity Consumption Quantity Inventory Quantity在庫数量 消費数量 在庫数量
Bleached kraft pulp Bleached kraft pulp (Softwood)
消費数量年 月
(1) クラフトパルプ・さらし ①+② ① クラフトパルプ・さらし(針葉樹)
Year andMonth
Consumption Quantity Inventory Quantity Consumption Quantity Inventory Quantity消費数量 在庫数量 消費数量 在庫数量
Pulp total Kraft pulp
年 月
1.パルプ計 2~4 2.クラフトパルプ (1)+(2)
Year andMonth
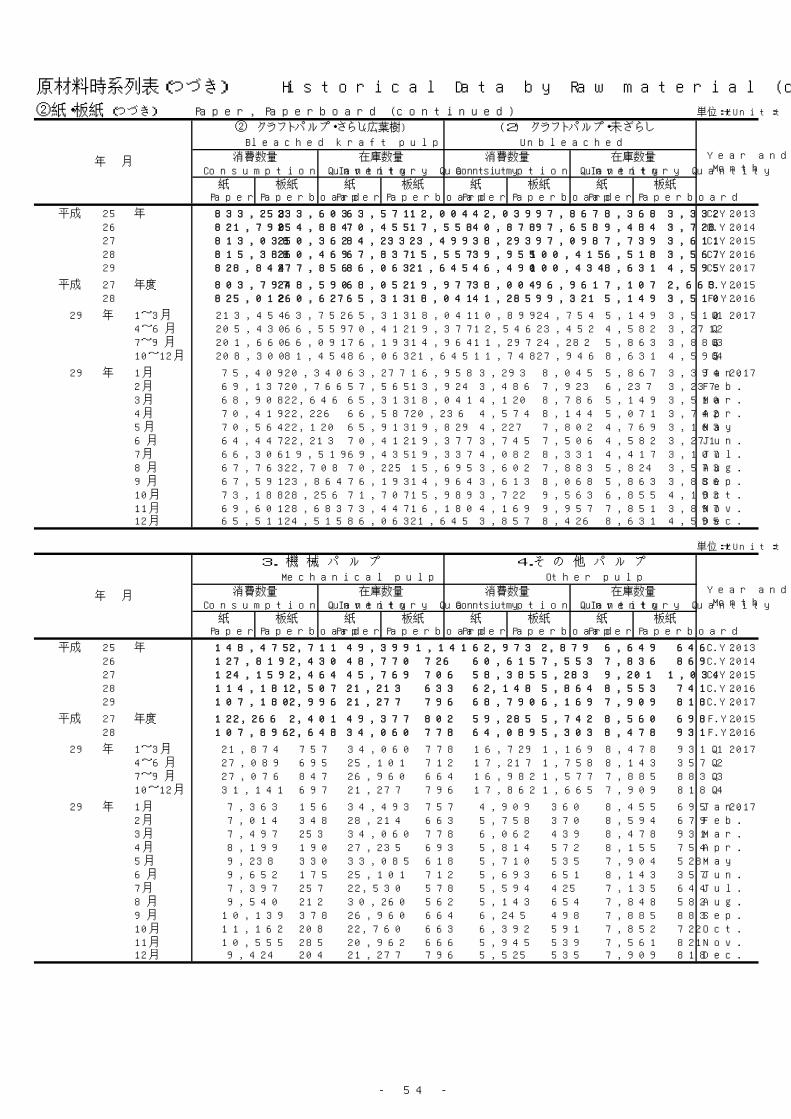
- 54 -
原材料時系列表(つづき) Historical Data by Raw material (continued)
②紙・板紙 (つづき) Paper, Paperboard (continued) 単位:t/Unit:t
紙 板紙 紙 板紙 紙 板紙 紙 板紙Paper Paperboard Paper Paperboard Paper Paperboard Paper Paperboard
平成 25 年 833,253 233,603 63,571 12,004 42,039 97,867 8,368 3,332 C.Y. 201326 821,790 254,884 70,455 17,558 40,878 97,658 9,484 3,728 C.Y. 201427 813,038 250,362 84,233 23,499 38,293 97,098 7,739 3,611 C.Y. 201528 815,388 260,469 67,837 15,557 39,955 100,415 6,518 3,567 C.Y. 201629 828,844 277,856 86,063 21,645 46,490 100,434 8,631 4,595 C.Y. 2017
平成 27 年度 803,797 248,590 68,052 19,977 38,004 96,961 7,107 2,663 F.Y. 201528 825,012 260,627 65,313 18,041 41,285 99,321 5,149 3,510 F.Y. 2016
29 年 1~3月 213,454 63,752 65,313 18,041 10,899 24,754 5,149 3,510 Q1 20174~6月 205,430 66,559 70,412 19,377 12,546 23,452 4,582 3,271 Q27~9月 201,660 66,091 76,193 14,964 11,297 24,282 5,863 3,886 Q310~12月 208,300 81,454 86,063 21,645 11,748 27,946 8,631 4,595 Q4
29 年 1月 75,409 20,340 63,277 16,958 3,293 8,045 5,867 3,394 Jan. 20172月 69,137 20,766 57,565 13,924 3,486 7,923 6,237 3,237 Feb.3月 68,908 22,646 65,313 18,041 4,120 8,786 5,149 3,510 Mar.4月 70,419 22,226 66,587 20,236 4,574 8,144 5,071 3,742 Apr.5月 70,564 22,120 65,913 19,829 4,227 7,802 4,769 3,163 May 6月 64,447 22,213 70,412 19,377 3,745 7,506 4,582 3,271 Jun.7月 66,306 19,519 69,435 19,337 4,082 8,331 4,417 3,107 Jul.8月 67,763 22,708 70,225 15,695 3,602 7,883 5,824 3,573 Aug.9月 67,591 23,864 76,193 14,964 3,613 8,068 5,863 3,886 Sep.10月 73,188 28,256 71,707 15,989 3,722 9,563 6,855 4,193 Oct.11月 69,601 28,683 73,447 16,180 4,169 9,957 7,851 3,897 Nov.12月 65,511 24,515 86,063 21,645 3,857 8,426 8,631 4,595 Dec.
単位:t/Unit:t
紙 板紙 紙 板紙 紙 板紙 紙 板紙Paper Paperboard Paper Paperboard Paper Paperboard Paper Paperboard
平成 25 年 148,475 2,711 49,399 1,141 62,973 2,879 6,649 646 C.Y. 201326 127,819 2,430 48,770 726 60,615 7,553 7,836 869 C.Y. 201427 124,159 2,464 45,769 706 58,385 5,283 9,201 1,034 C.Y. 201528 114,181 2,507 21,213 633 62,148 5,864 8,553 741 C.Y. 201629 107,180 2,996 21,277 796 68,790 6,169 7,909 818 C.Y. 2017
平成 27 年度 122,266 2,401 49,377 802 59,285 5,742 8,560 698 F.Y. 201528 107,896 2,648 34,060 778 64,089 5,303 8,478 931 F.Y. 2016
29 年 1~3月 21,874 757 34,060 778 16,729 1,169 8,478 931 Q1 20174~6月 27,089 695 25,101 712 17,217 1,758 8,143 357 Q27~9月 27,076 847 26,960 664 16,982 1,577 7,885 883 Q310~12月 31,141 697 21,277 796 17,862 1,665 7,909 818 Q4
29 年 1月 7,363 156 34,493 757 4,909 360 8,455 695 Jan. 20172月 7,014 348 28,214 663 5,758 370 8,594 679 Feb.3月 7,497 253 34,060 778 6,062 439 8,478 931 Mar.4月 8,199 190 27,235 693 5,814 572 8,155 754 Apr.5月 9,238 330 33,085 618 5,710 535 7,904 528 May 6月 9,652 175 25,101 712 5,693 651 8,143 357 Jun.7月 7,397 257 22,530 578 5,594 425 7,135 644 Jul.8月 9,540 212 30,260 562 5,143 654 7,848 582 Aug.9月 10,139 378 26,960 664 6,245 498 7,885 883 Sep.10月 11,162 208 22,760 663 6,392 591 7,852 722 Oct.11月 10,555 285 20,962 666 5,945 539 7,561 821 Nov.12月 9,424 204 21,277 796 5,525 535 7,909 818 Dec.
Consumption Quantity Inventory Quantity Consumption Quantity Inventory Quantity在庫数量消費数量 在庫数量 消費数量
Mechanical pulp Other pulp
年 月
3. 機 械 パ ル プ 4.そ の 他 パ ル プ
Year andMonth
(2) クラフトパルプ・未ざらし
Year andMonthConsumption Quantity Inventory Quantity
消費数量 在庫数量 消費数量 在庫数量
Bleached kraft pulp (Hardwood) Unbleached kraft pulp
Consumption Quantity年 月
② クラフトパルプ・さらし(広葉樹)
Inventory Quantity
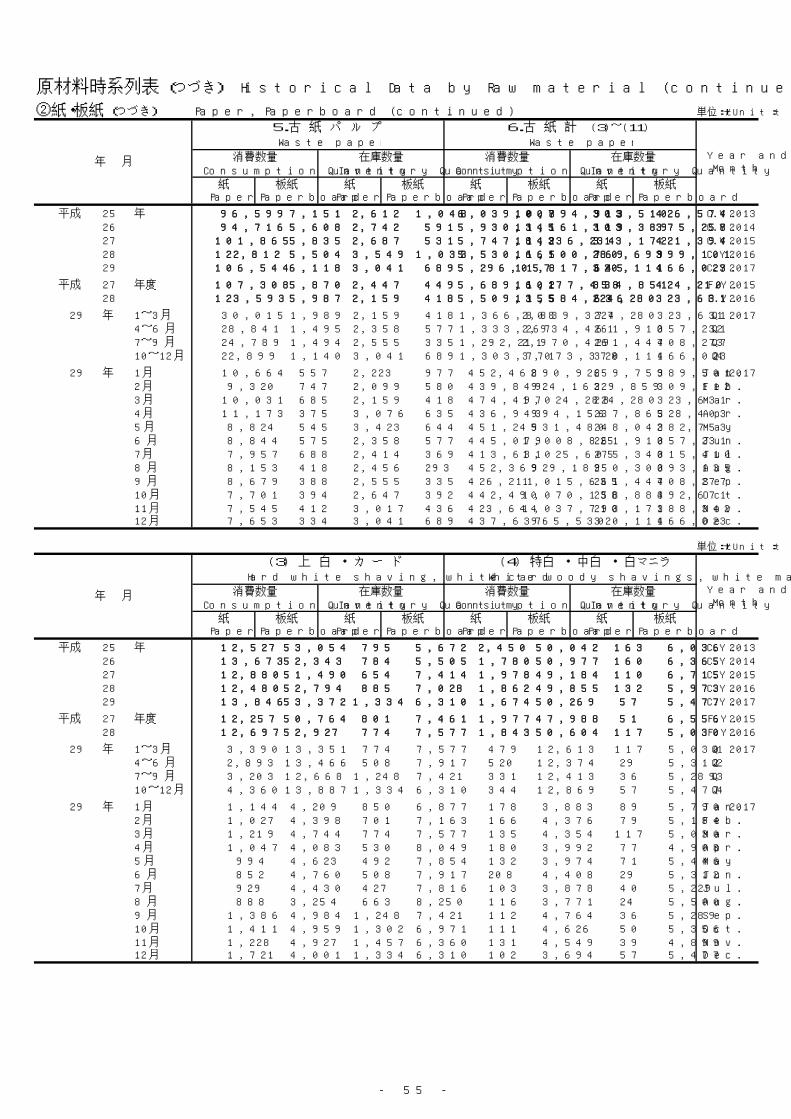
- 55 -
原材料時系列表 (つづき) Historical Data by Raw material (continued)
②紙・板紙 (つづき) Paper, Paperboard (continued) 単位:t/Unit:t
紙 板紙 紙 板紙 紙 板紙 紙 板紙Paper Paperboard Paper Paperboard Paper Paperboard Paper Paperboard
平成 25 年 96,599 7,151 2,612 1,048 6,039,007 10,894,913 303,510 426,574 C.Y. 201326 94,716 5,608 2,742 591 5,930,345 11,161,119 303,389 375,258 C.Y. 201427 101,865 5,835 2,687 531 5,747,843 11,236,234 313,172 421,394 C.Y. 201528 122,812 5,504 3,549 1,033 5,530,661 11,500,769 280,699 399,101 C.Y. 201629 106,544 6,118 3,041 689 5,296,057 11,817,645 320,111 466,023 C.Y. 2017
平成 27 年度 107,308 5,870 2,447 449 5,689,601 11,277,458 334,851 424,210 F.Y. 201528 123,593 5,987 2,159 418 5,509,355 11,584,636 224,280 323,631 F.Y. 2016
29 年 1~3月 30,015 1,989 2,159 418 1,366,808 2,839,377 224,280 323,631 Q1 20174~6月 28,841 1,495 2,358 577 1,333,267 2,934,461 261,910 357,231 Q27~9月 24,789 1,494 2,555 335 1,292,211 2,970,429 261,447 408,277 Q310~12月 22,899 1,140 3,041 689 1,303,771 3,073,378 320,111 466,023 Q4
29 年 1月 10,664 557 2,223 977 452,462 890,926 259,759 389,501 Jan. 20172月 9,320 747 2,099 580 439,849 924,163 229,859 309,112 Feb.3月 10,031 685 2,159 418 474,497 1,024,288 224,280 323,631 Mar.4月 11,173 375 3,076 635 436,943 994,156 237,865 328,403 Apr.5月 8,824 545 3,423 644 451,245 931,480 248,042 382,753 May 6月 8,844 575 2,358 577 445,079 1,008,825 261,910 357,231 Jun.7月 7,957 688 2,414 369 413,631 1,025,605 275,340 315,410 Jul.8月 8,153 418 2,456 293 452,369 929,189 250,300 393,135 Aug.9月 8,679 388 2,555 335 426,211 1,015,635 261,447 408,277 Sep.10月 7,701 394 2,647 392 442,490 1,070,138 258,884 392,671 Oct.11月 7,545 412 3,017 436 423,644 1,037,710 293,171 388,342 Nov.12月 7,653 334 3,041 689 437,637 965,530 320,111 466,023 Dec.
単位:t/Unit:t
紙 板紙 紙 板紙 紙 板紙 紙 板紙Paper Paperboard Paper Paperboard Paper Paperboard Paper Paperboard
平成 25 年 12,527 53,054 795 5,672 2,450 50,042 163 6,036 C.Y. 201326 13,673 52,343 784 5,505 1,780 50,977 160 6,365 C.Y. 201427 12,880 51,490 654 7,414 1,978 49,184 110 6,715 C.Y. 201528 12,480 52,794 885 7,028 1,862 49,855 132 5,973 C.Y. 201629 13,846 53,372 1,334 6,310 1,674 50,269 57 5,477 C.Y. 2017
平成 27 年度 12,257 50,764 801 7,461 1,977 47,988 51 6,556 F.Y. 201528 12,697 52,927 774 7,577 1,843 50,604 117 5,030 F.Y. 2016
29 年 1~3月 3,390 13,351 774 7,577 479 12,613 117 5,030 Q1 20174~6月 2,893 13,466 508 7,917 520 12,374 29 5,312 Q27~9月 3,203 12,668 1,248 7,421 331 12,413 36 5,289 Q310~12月 4,360 13,887 1,334 6,310 344 12,869 57 5,477 Q4
29 年 1月 1,144 4,209 850 6,877 178 3,883 89 5,790 Jan. 20172月 1,027 4,398 701 7,163 166 4,376 79 5,184 Feb.3月 1,219 4,744 774 7,577 135 4,354 117 5,030 Mar.4月 1,047 4,083 530 8,049 180 3,992 77 4,908 Apr.5月 994 4,623 492 7,854 132 3,974 71 5,446 May 6月 852 4,760 508 7,917 208 4,408 29 5,312 Jun.7月 929 4,430 427 7,816 103 3,878 40 5,229 Jul.8月 888 3,254 663 8,250 116 3,771 24 5,500 Aug.9月 1,386 4,984 1,248 7,421 112 4,764 36 5,289 Sep.10月 1,411 4,959 1,302 6,971 111 4,626 50 5,356 Oct.11月 1,228 4,927 1,457 6,360 131 4,549 39 4,899 Nov.12月 1,721 4,001 1,334 6,310 102 3,694 57 5,477 Dec.
White woody shavings, white manila
Inventory Quantity在庫数量 消費数量 在庫数量
Consumption Quantity Inventory Quantity Consumption Quantity年 月
Hard white shaving, white card
(3) 上 白 ・ カ ー ド (4) 特白 ・ 中白 ・ 白マニラ
消費数量 Year andMonth
年 月
5.古 紙 パ ル プ 6.古 紙 計 (3)~(11)
Year andMonthConsumption Quantity
消費数量
Waste paper pulp Waste paper total
在庫数量 消費数量 在庫数量Inventory Quantity Consumption Quantity Inventory Quantity
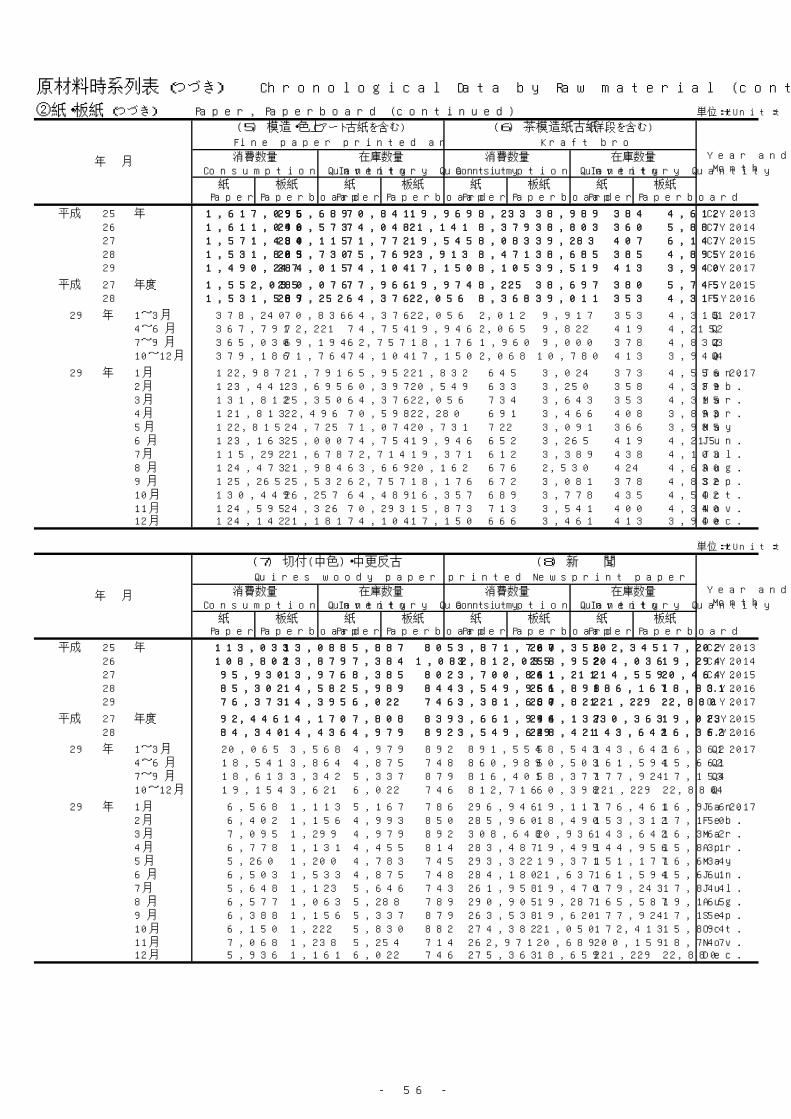
- 56 -
原材料時系列表 (つづき) Chronological Data by Raw material (continued)
②紙・板紙 (つづき) Paper, Paperboard (continued) 単位:t/Unit:t
紙 板紙 紙 板紙 紙 板紙 紙 板紙Paper Paperboard Paper Paperboard Paper Paperboard Paper Paperboard
平成 25 年 1,617,095 296,689 70,841 19,969 8,233 38,989 384 4,612 C.Y. 201326 1,611,046 290,573 74,048 21,141 8,379 38,803 360 5,887 C.Y. 201427 1,571,434 280,115 71,772 19,545 8,083 39,283 407 6,147 C.Y. 201528 1,531,809 285,730 75,769 23,913 8,471 38,685 385 4,895 C.Y. 201629 1,490,247 284,015 74,104 17,150 8,105 39,519 413 3,940 C.Y. 2017
平成 27 年度 1,552,035 280,076 77,966 19,974 8,225 38,697 380 5,745 F.Y. 201528 1,531,589 287,252 64,376 22,056 8,368 39,011 353 4,315 F.Y. 2016
29 年 1~3月 378,240 70,836 64,376 22,056 2,012 9,917 353 4,315 Q1 20174~6月 367,791 72,221 74,754 19,946 2,065 9,822 419 4,215 Q27~9月 365,030 69,194 62,757 18,176 1,960 9,000 378 4,832 Q310~12月 379,186 71,764 74,104 17,150 2,068 10,780 413 3,940 Q4
29 年 1月 122,987 21,791 65,952 21,832 645 3,024 373 4,556 Jan. 20172月 123,441 23,695 60,397 20,549 633 3,250 358 4,339 Feb.3月 131,812 25,350 64,376 22,056 734 3,643 353 4,315 Mar.4月 121,813 22,496 70,598 22,280 691 3,466 408 3,893 Apr.5月 122,815 24,725 71,074 20,731 722 3,091 366 3,985 May 6月 123,163 25,000 74,754 19,946 652 3,265 419 4,215 Jun.7月 115,292 21,678 72,714 19,371 612 3,389 438 4,103 Jul.8月 124,473 21,984 63,669 20,162 676 2,530 424 4,630 Aug.9月 125,265 25,532 62,757 18,176 672 3,081 378 4,832 Sep.10月 130,449 26,257 64,489 16,357 689 3,778 435 4,542 Oct.11月 124,595 24,326 70,293 15,873 713 3,541 400 4,340 Nov.12月 124,142 21,181 74,104 17,150 666 3,461 413 3,940 Dec.
単位:t/Unit:t
紙 板紙 紙 板紙 紙 板紙 紙 板紙Paper Paperboard Paper Paperboard Paper Paperboard Paper Paperboard
平成 25 年 113,033 13,088 5,887 805 3,871,707 260,356 202,345 17,202 C.Y. 201326 108,802 13,879 7,384 1,082 3,812,035 258,952 204,036 19,294 C.Y. 201427 95,930 13,976 8,385 802 3,700,861 241,211 214,559 20,464 C.Y. 201528 85,302 14,582 5,989 844 3,549,966 251,898 186,167 18,831 C.Y. 201629 76,373 14,395 6,022 746 3,381,660 237,821 221,229 22,880 C.Y. 2017
平成 27 年度 92,446 14,170 7,808 839 3,661,996 244,137 230,363 19,023 F.Y. 201528 84,340 14,436 4,979 892 3,549,629 248,421 143,642 16,362 F.Y. 2016
29 年 1~3月 20,065 3,568 4,979 892 891,554 58,543 143,642 16,362 Q1 20174~6月 18,541 3,864 4,875 748 860,989 60,503 161,594 15,661 Q27~9月 18,613 3,342 5,337 879 816,401 58,377 177,924 17,154 Q310~12月 19,154 3,621 6,022 746 812,716 60,398 221,229 22,880 Q4
29 年 1月 6,568 1,113 5,167 786 296,946 19,117 176,461 16,966 Jan. 20172月 6,402 1,156 4,993 850 285,960 18,490 153,312 17,150 Feb.3月 7,095 1,299 4,979 892 308,648 20,936 143,642 16,362 Mar.4月 6,778 1,131 4,455 814 283,487 19,495 144,956 15,831 Apr.5月 5,260 1,200 4,783 745 293,322 19,371 151,177 16,634 May 6月 6,503 1,533 4,875 748 284,180 21,637 161,594 15,661 Jun.7月 5,648 1,123 5,646 743 261,958 19,470 179,243 17,844 Jul.8月 6,577 1,063 5,288 789 290,905 19,287 165,587 19,165 Aug.9月 6,388 1,156 5,337 879 263,538 19,620 177,924 17,154 Sep.10月 6,150 1,222 5,830 882 274,382 21,050 172,413 15,894 Oct.11月 7,068 1,238 5,254 714 262,971 20,689 200,159 18,747 Nov.12月 5,936 1,161 6,022 746 275,363 18,659 221,229 22,880 Dec.
Year andMonth
Quires woody paper printed
消費数量 在庫数量Consumption Quantity Inventory Quantity Consumption Quantity Inventory Quantity
Newsprint paper
消費数量 在庫数量
Consumption Quantity Inventory Quantity
年 月
(7) 切付(中色)・中更反古 (8) 新 聞
Consumption Quantity年 月
(5) 模造・色上(アート古紙を含む)
Inventory Quantity
Fine paper printed and coated paper Kraft browns
(6) 茶模造紙古紙(洋段を含む)
Year andMonth
消費数量 在庫数量 消費数量 在庫数量
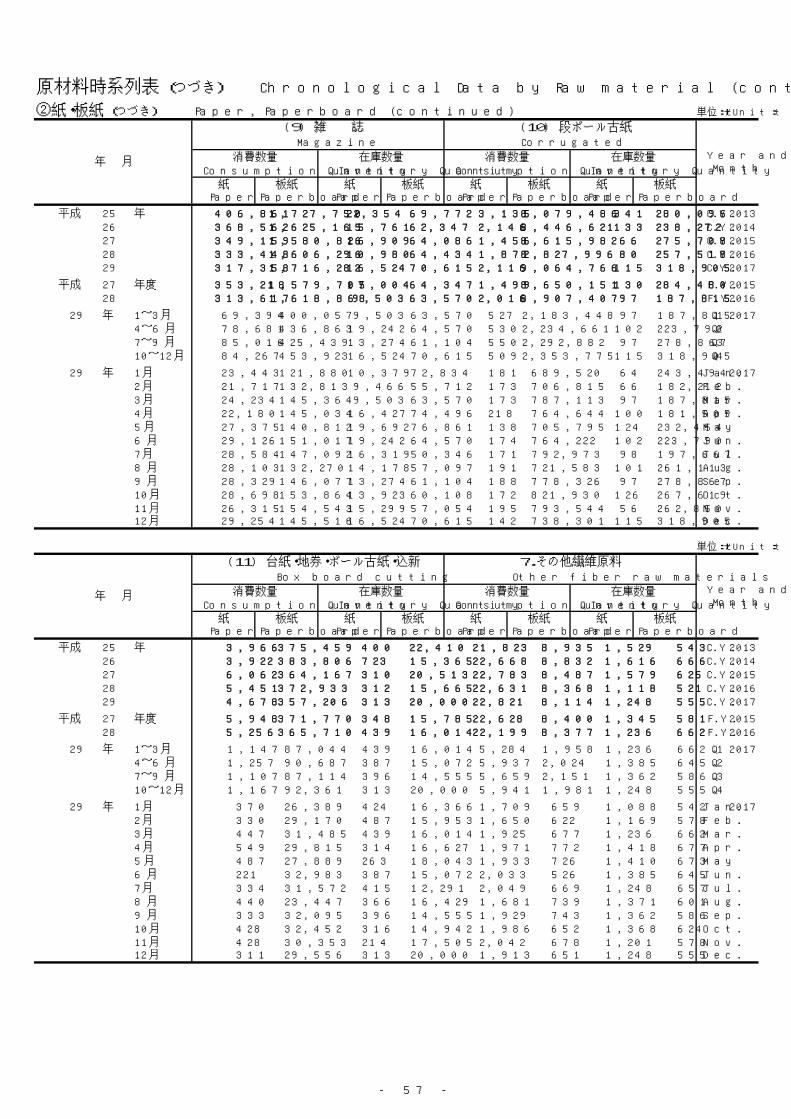
- 57 -
原材料時系列表 (つづき) Chronological Data by Raw material (continued)
②紙・板紙 (つづき) Paper, Paperboard (continued) 単位:t/Unit:t
紙 板紙 紙 板紙 紙 板紙 紙 板紙Paper Paperboard Paper Paperboard Paper Paperboard Paper Paperboard
平成 25 年 406,861 1,727,750 22,354 69,772 3,135 8,079,486 341 280,096 C.Y. 201326 368,562 1,625,165 15,761 62,347 2,146 8,446,621 133 238,272 C.Y. 201427 349,159 1,580,826 16,909 64,086 1,456 8,615,982 66 275,708 C.Y. 201528 333,448 1,606,296 10,980 64,434 1,872 8,827,996 80 257,518 C.Y. 201629 317,358 1,716,282 16,524 70,615 2,116 9,064,766 115 318,905 C.Y. 2017
平成 27 年度 353,218 1,579,705 17,004 64,347 1,499 8,650,151 130 284,480 F.Y. 201528 313,617 1,618,868 9,503 63,570 2,016 8,907,407 97 187,815 F.Y. 2016
29 年 1~3月 69,394 400,057 9,503 63,570 527 2,183,448 97 187,815 Q1 20174~6月 78,681 436,863 19,242 64,570 530 2,234,661 102 223,790 Q27~9月 85,016 425,439 13,274 61,104 550 2,292,882 97 278,867 Q310~12月 84,267 453,923 16,524 70,615 509 2,353,775 115 318,905 Q4
29 年 1月 23,443 121,880 10,379 72,834 181 689,520 64 243,494 Jan. 20172月 21,717 132,813 9,466 55,712 173 706,815 66 182,212 Feb.3月 24,234 145,364 9,503 63,570 173 787,113 97 187,815 Mar.4月 22,180 145,034 16,427 74,496 218 764,644 100 181,505 Apr.5月 27,375 140,812 19,692 76,861 138 705,795 124 232,454 May 6月 29,126 151,017 19,242 64,570 174 764,222 102 223,790 Jun.7月 28,584 147,092 16,319 50,346 171 792,973 98 197,667 Jul.8月 28,103 132,270 14,178 57,097 191 721,583 101 261,113 Aug.9月 28,329 146,077 13,274 61,104 188 778,326 97 278,867 Sep.10月 28,698 153,864 13,923 60,108 172 821,930 126 267,619 Oct.11月 26,315 154,543 15,299 57,054 195 793,544 56 262,850 Nov.12月 29,254 145,516 16,524 70,615 142 738,301 115 318,905 Dec.
単位:t/Unit:t
紙 板紙 紙 板紙 紙 板紙 紙 板紙Paper Paperboard Paper Paperboard Paper Paperboard Paper Paperboard
平成 25 年 3,966 375,459 400 22,410 21,823 8,935 1,529 543 C.Y. 201326 3,922 383,806 723 15,365 22,668 8,832 1,616 666 C.Y. 201427 6,062 364,167 310 20,513 22,783 8,487 1,579 625 C.Y. 201528 5,451 372,933 312 15,665 22,631 8,368 1,118 521 C.Y. 201629 4,678 357,206 313 20,000 22,821 8,114 1,248 555 C.Y. 2017
平成 27 年度 5,948 371,770 348 15,785 22,628 8,400 1,345 581 F.Y. 201528 5,256 365,710 439 16,014 22,199 8,377 1,236 662 F.Y. 2016
29 年 1~3月 1,147 87,044 439 16,014 5,284 1,958 1,236 662 Q1 20174~6月 1,257 90,687 387 15,072 5,937 2,024 1,385 645 Q27~9月 1,107 87,114 396 14,555 5,659 2,151 1,362 586 Q310~12月 1,167 92,361 313 20,000 5,941 1,981 1,248 555 Q4
29 年 1月 370 26,389 424 16,366 1,709 659 1,088 542 Jan. 20172月 330 29,170 487 15,953 1,650 622 1,169 578 Feb.3月 447 31,485 439 16,014 1,925 677 1,236 662 Mar.4月 549 29,815 314 16,627 1,971 772 1,418 677 Apr.5月 487 27,889 263 18,043 1,933 726 1,410 673 May 6月 221 32,983 387 15,072 2,033 526 1,385 645 Jun.7月 334 31,572 415 12,291 2,049 669 1,248 657 Jul.8月 440 23,447 366 16,429 1,681 739 1,371 601 Aug.9月 333 32,095 396 14,555 1,929 743 1,362 586 Sep.10月 428 32,452 316 14,942 1,986 652 1,368 624 Oct.11月 428 30,353 214 17,505 2,042 678 1,201 578 Nov.12月 311 29,556 313 20,000 1,913 651 1,248 555 Dec.
Consumption Quantity在庫数量消費数量
Inventory Quantity
Year andMonth
Box board cutting Other fiber raw materials
年 月
(11) 台紙・地券・ボール古紙・込新 7.その他繊維原料
消費数量 在庫数量Inventory Quantity Consumption Quantity
Inventory QuantityConsumption Quantity Inventory Quantity Consumption Quantity在庫数量 消費数量 在庫数量
Corrugated container
(10) 段ボール古紙
Year andMonth
年 月
(9) 雑 誌Magazine
消費数量
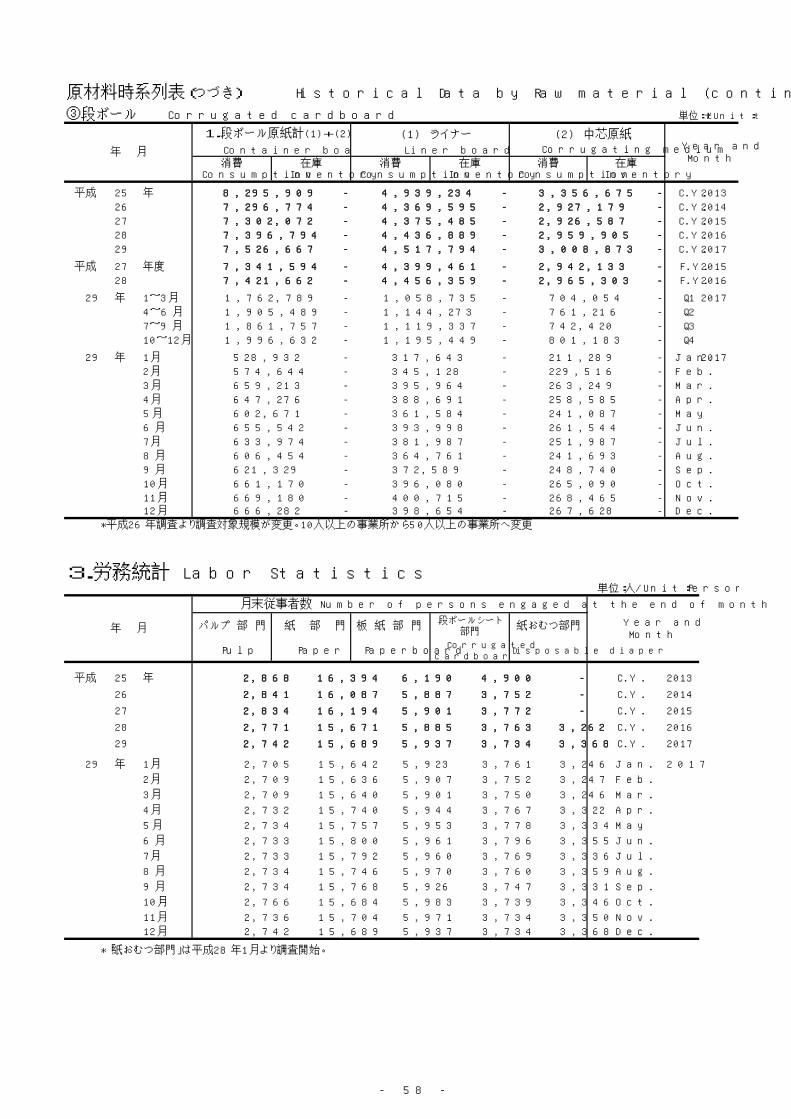
- 58 -
原材料時系列表(つづき) Historical Data by Raw material (continued)
③段ボール Corrugated cardboard 単位:t/Unit:t
消費 在庫 消費 在庫 消費 在庫Consumption Inventory Consumption Inventory Consumption Inventory
平成 25 年 8,295,909 - 4,939,234 - 3,356,675 - C.Y. 2013
26 7,296,774 - 4,369,595 - 2,927,179 - C.Y. 2014
27 7,302,072 - 4,375,485 - 2,926,587 - C.Y. 2015
28 7,396,794 - 4,436,889 - 2,959,905 - C.Y. 2016
29 7,526,667 - 4,517,794 - 3,008,873 - C.Y. 2017
平成 27 年度 7,341,594 - 4,399,461 - 2,942,133 - F.Y. 2015
28 7,421,662 - 4,456,359 - 2,965,303 - F.Y. 2016
29 年 1~3月 1,762,789 - 1,058,735 - 704,054 - Q1 2017
4~6月 1,905,489 - 1,144,273 - 761,216 - Q2
7~9月 1,861,757 - 1,119,337 - 742,420 - Q3
10~12月 1,996,632 - 1,195,449 - 801,183 - Q4
29 年 1月 528,932 - 317,643 - 211,289 - Jan. 2017
2月 574,644 - 345,128 - 229,516 - Feb.
3月 659,213 - 395,964 - 263,249 - Mar.
4月 647,276 - 388,691 - 258,585 - Apr.
5月 602,671 - 361,584 - 241,087 - May
6月 655,542 - 393,998 - 261,544 - Jun.
7月 633,974 - 381,987 - 251,987 - Jul.
8月 606,454 - 364,761 - 241,693 - Aug.
9月 621,329 - 372,589 - 248,740 - Sep.
10月 661,170 - 396,080 - 265,090 - Oct.
11月 669,180 - 400,715 - 268,465 - Nov.12月 666,282 - 398,654 - 267,628 - Dec.
3.労務統計 Labor Statistics単位:人/Unit:Person
パルプ 部 門 紙 部 門 板 紙 部 門 段ボールシート
部門紙おむつ部門
Pulp Paper PaperboardCorrugated
cardboard sheetsDisposable diaper
平成 25 年 2,868 16,394 6,190 4,900 - C.Y. 2013
26 2,841 16,087 5,887 3,752 - C.Y. 2014
27 2,834 16,194 5,901 3,772 - C.Y. 2015
28 2,771 15,671 5,885 3,763 3,262 C.Y. 2016
29 2,742 15,689 5,937 3,734 3,368 C.Y. 2017
29 年 1月 2,705 15,642 5,923 3,761 3,246 Jan. 2017
2月 2,709 15,636 5,907 3,752 3,247 Feb.
3月 2,709 15,640 5,901 3,750 3,246 Mar.
4月 2,732 15,740 5,944 3,767 3,322 Apr.
5月 2,734 15,757 5,953 3,778 3,334 May
6月 2,733 15,800 5,961 3,796 3,355 Jun.
7月 2,733 15,792 5,960 3,769 3,336 Jul.
8月 2,734 15,746 5,970 3,760 3,359 Aug.
9月 2,734 15,768 5,926 3,747 3,331 Sep.
10月 2,766 15,684 5,983 3,739 3,346 Oct.
11月 2,736 15,704 5,971 3,734 3,350 Nov.
12月 2,742 15,689 5,937 3,734 3,368 Dec.
*「紙おむつ部門」は平成28年1月より調査開始。
*平成26年調査より調査対象規模が変更。10人以上の事業所から50人以上の事業所へ変更
年 月
月末従事者数 Number of persons engaged at the end of month
Year andMonth
年 月
1.段ボール原紙計(1)+(2) (1) ライナー (2) 中芯原紙Year andMonth
Container board total Liner board Corrugating medium

- 59 -
4.生産能力統計 Production Capacity Statistics(1)パルプ Pulp 単位:t/Unit:t
1.パルプ計 (1)~(4)
Pulp total
基(台)数 生産能力 稼働率(%) 基(台)数 生産能力 基(台)数 生産能力
Number Number Number
平成 25 年 240 1,046,822 69.5 36 697,522 12 18,848 C.Y. 2013
26 236 1,043,517 71.9 35 693,569 12 18,848 C.Y. 2014
27 236 1,046,198 69.7 35 696,367 12 18,848 C.Y. 2015
28 235 1,046,554 68.7 34 692,680 12 18,848 C.Y. 2016
29 232 1,041,758 69.9 34 695,753 12 18,848 C.Y. 2017
平成 27 年度 236 1,044,740 69.9 35 694,909 12 18,848 F.Y. 2015
28 233 1,042,054 68.4 34 692,680 12 18,848 F.Y. 2016
平成 29年 1~3月 233 1,042,054 71.0 34 692,680 12 18,848 Q1 2017
4~6月 232 1,043,058 68.1 34 697,053 12 18,848 Q2
7~9月 232 1,043,058 69.3 34 697,053 12 18,848 Q3
10~12月 232 1,041,758 71.1 34 695,753 12 18,848 Q4
平成 29年 1月 233 1,042,054 69.9 34 692,680 12 18,848 Jan. 2017
2月 233 1,042,054 66.8 34 692,680 12 18,848 Feb.
3月 233 1,042,054 76.3 34 692,680 12 18,848 Mar.
4月 232 1,043,058 69.8 34 697,053 12 18,848 Apr.
5月 232 1,043,058 67.8 34 697,053 12 18,848 May
6月 232 1,043,058 66.8 34 697,053 12 18,848 Jun.
7月 232 1,043,058 64.4 34 697,053 12 18,848 Jul.
8月 232 1,043,058 72.3 34 697,053 12 18,848 Aug.
9月 232 1,043,058 71.2 34 697,053 12 18,848 Sep.
10月 232 1,041,758 74.3 34 695,753 12 18,848 Oct.
11月 232 1,041,758 67.2 34 695,753 12 18,848 Nov.
12月 232 1,041,758 71.7 34 695,753 12 18,848 Dec.
単位:t/Unit:t
基(台)数 生産能力 基(台)数 生産能力 基(台)数 生産能力 基(台)数
Number Number Number Number
平成 25 年 7 115,428 15 16,916 5 6,680 165 C.Y. 2013
26 7 121,846 15 16,916 5 6,680 162 C.Y. 2014
27 7 121,846 15 16,916 5 6,680 162 C.Y. 2015
28 7 125,787 15 16,916 5 6,680 162 C.Y. 2016
29 6 120,887 15 16,916 3 2,180 162 C.Y. 2017
平成 27 年度 7 121,846 15 16,916 5 6,680 162 F.Y. 2015
28 7 125,787 15 16,916 3 2,180 162 F.Y. 2016
平成 29年 1~3月 7 125,787 15 16,916 3 2,180 162 Q1 2017
4~6月 6 120,887 15 16,916 3 2,180 162 Q2
7~9月 6 120,887 15 16,916 3 2,180 162 Q3
10~12月 6 120,887 15 16,916 3 2,180 162 Q4
平成 29年 1月 7 125,787 15 16,916 3 2,180 162 Jan. 2017
2月 7 125,787 15 16,916 3 2,180 162 Feb.
3月 7 125,787 15 16,916 3 2,180 162 Mar.
4月 6 120,887 15 16,916 3 2,180 162 Apr.
5月 6 120,887 15 16,916 3 2,180 162 May
6月 6 120,887 15 16,916 3 2,180 162 Jun.
7月 6 120,887 15 16,916 3 2,180 162 Jul.
8月 6 120,887 15 16,916 3 2,180 162 Aug.
9月 6 120,887 15 16,916 3 2,180 162 Sep.
10月 6 120,887 15 16,916 3 2,180 162 Oct.
11月 6 120,887 15 16,916 3 2,180 162 Nov.
12月 6 120,887 15 16,916 3 2,180 162 Dec.
187,174
187,174
187,174
187,174
187,174
187,174
187,174
187,174
187,174
187,174
187,174
187,174
185,643
185,643
185,643
185,541
185,643
187,174
185,541
185,643
185,643
Production capacity
Production capacity
Production capacity
Production capacity
191,428
185,658
バッチ式 Other pulp Refiner and grinder
Continuous type Batch type
生産能力
Production capacity
Production capacity
注:稼働率は、生産数量/生産能力で算出。年、年度及び四半期の稼働率は、期間ごとの平均値。
年 月
(2) クラフトパルプ・未ざらし
Year andMonth
Unbleached kraft pulp (3) その他パルプ (4)リファイナー・砕木機
連続式
年 月
(1) クラフトパルプ・さらし
Year andMonth
Bleached kraft pulp
連続式 バッチ式
Continuous type Batch type
Production capacity
Operatingratio
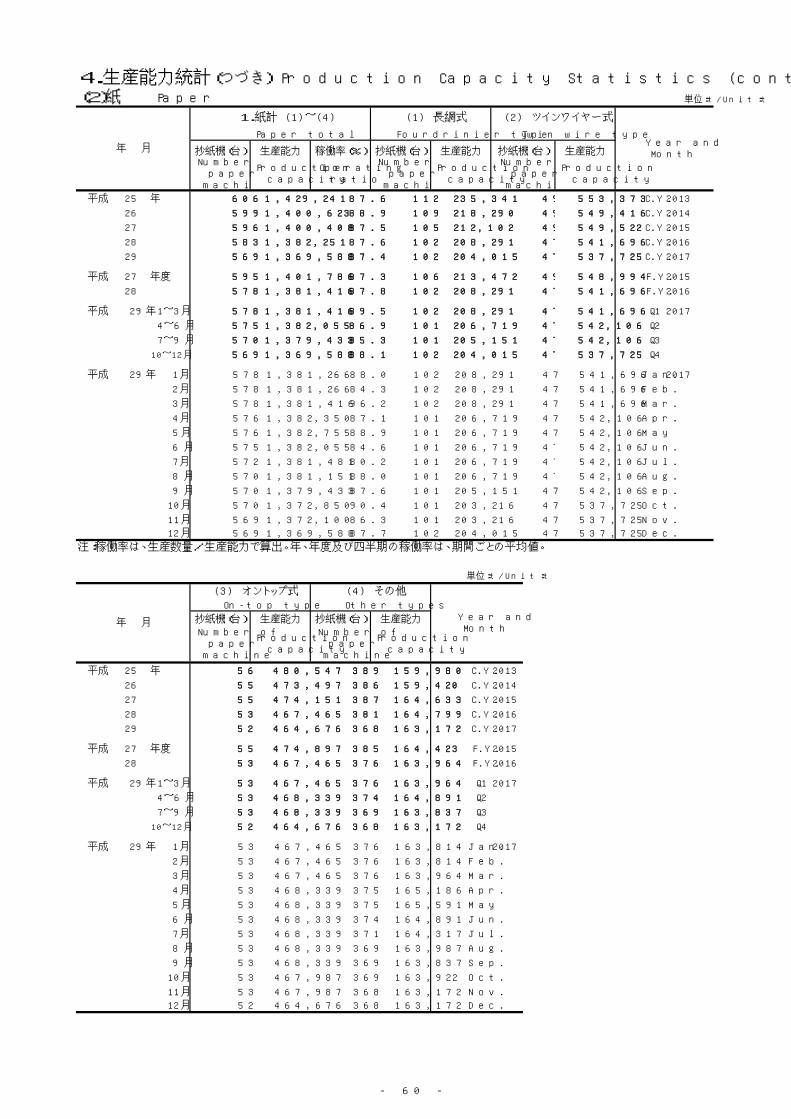
- 60 -
4.生産能力統計(つづき) Production Capacity Statistics (continued)(2)紙 Paper 単位:t/Unit:t
1.紙計 (1)~(4)
Paper total
抄紙機(台) 生産能力 稼働率(%) 抄紙機(台) 生産能力 生産能力
平成 25 年 606 1,429,241 87.6 112 235,341 553,373 C.Y. 2013
26 599 1,400,623 88.9 109 218,290 549,416 C.Y. 2014
27 596 1,400,408 87.5 105 212,102 549,522 C.Y. 2015
28 583 1,382,251 87.6 102 208,291 541,696 C.Y. 2016
29 569 1,369,588 87.4 102 204,015 537,725 C.Y. 2017
平成 27 年度 595 1,401,786 87.3 106 213,472 548,994 F.Y. 2015
28 578 1,381,416 87.8 102 208,291 541,696 F.Y. 2016
平成 29年 1~3月 578 1,381,416 89.5 102 208,291 541,696 Q1 2017
4~6月 575 1,382,055 86.9 101 206,719 542,106 Q2
7~9月 570 1,379,433 85.3 101 205,151 542,106 Q3
10~12月 569 1,369,588 88.1 102 204,015 537,725 Q4
平成 29年 1月 578 1,381,266 88.0 102 208,291 541,696 Jan. 2017
2月 578 1,381,266 84.3 102 208,291 541,696 Feb.
3月 578 1,381,416 96.2 102 208,291 541,696 Mar.
4月 576 1,382,350 87.1 101 206,719 542,106 Apr.
5月 576 1,382,755 88.9 101 206,719 542,106 May
6月 575 1,382,055 84.6 101 206,719 542,106 Jun.
7月 572 1,381,481 80.2 101 206,719 542,106 Jul.
8月 570 1,381,151 88.0 101 206,719 542,106 Aug.
9月 570 1,379,433 87.6 101 205,151 542,106 Sep.
10月 570 1,372,850 90.4 101 203,216 537,725 Oct.
11月 569 1,372,100 86.3 101 203,216 537,725 Nov.
12月 569 1,369,588 87.7 102 204,015 537,725 Dec.
単位:t/Unit:t
抄紙機(台) 生産能力 抄紙機(台) 生産能力
平成 25 年 56 480,547 389 159,980 C.Y. 2013
26 55 473,497 386 159,420 C.Y. 2014
27 55 474,151 387 164,633 C.Y. 2015
28 53 467,465 381 164,799 C.Y. 2016
29 52 464,676 368 163,172 C.Y. 2017
平成 27 年度 55 474,897 385 164,423 F.Y. 2015
28 53 467,465 376 163,964 F.Y. 2016
平成 29年 1~3月 53 467,465 376 163,964 Q1 2017
4~6月 53 468,339 374 164,891 Q2
7~9月 53 468,339 369 163,837 Q3
10~12月 52 464,676 368 163,172 Q4
平成 29年 1月 53 467,465 376 163,814 Jan. 2017
2月 53 467,465 376 163,814 Feb.
3月 53 467,465 376 163,964 Mar.
4月 53 468,339 375 165,186 Apr.
5月 53 468,339 375 165,591 May
6月 53 468,339 374 164,891 Jun.
7月 53 468,339 371 164,317 Jul.
8月 53 468,339 369 163,987 Aug.
9月 53 468,339 369 163,837 Sep.
10月 53 467,987 369 163,922 Oct.
11月 53 467,987 368 163,172 Nov.
12月 52 464,676 368 163,172 Dec.
On-top type Other types
Number ofpaper
machine
Production capacity
Number ofpaper
machine
Production capacity
注:稼働率は、生産数量/生産能力で算出。年、年度及び四半期の稼働率は、期間ごとの平均値。
年 月
(3) オントップ式 (4) その他
Year andMonth
47
47
47
47
47
47
47
47
47
47
47
47
47
47
47
49
47
47
49
47
47
49
49
Production capacity
Fourdrinier type Twin wire type
抄紙機(台)Year andMonth
Number ofpaper
machine
Production capacity
Operatingratio
Number ofpaper
machine
Number ofpaper
machine
Production capacity
年 月
(1) 長網式 (2) ツインワイヤー式
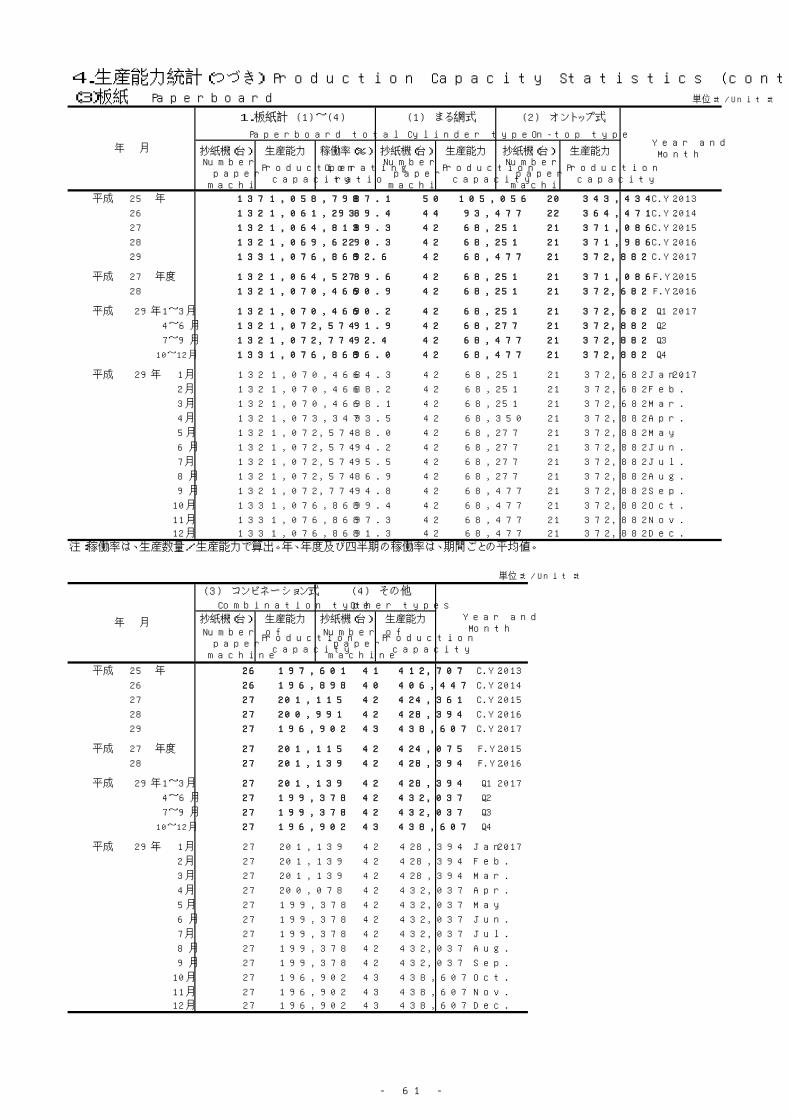
- 61 -
4.生産能力統計(つづき) Production Capacity Statistics (continued)(3)板紙 Paperboard 単位:t/Unit:t
1.板紙計 (1)~(4)
Paperboard total
抄紙機(台) 生産能力 稼働率(%) 抄紙機(台) 生産能力 生産能力
平成 25 年 137 1,058,798 87.1 50 105,056 343,434 C.Y. 2013
26 132 1,061,293 89.4 44 93,477 364,471 C.Y. 2014
27 132 1,064,813 89.3 42 68,251 371,086 C.Y. 2015
28 132 1,069,622 90.3 42 68,251 371,986 C.Y. 2016
29 133 1,076,868 92.6 42 68,477 372,882 C.Y. 2017
平成 27 年度 132 1,064,527 89.6 42 68,251 371,086 F.Y. 2015
28 132 1,070,466 90.9 42 68,251 372,682 F.Y. 2016
平成 29年 1~3月 132 1,070,466 90.2 42 68,251 372,682 Q1 2017
4~6月 132 1,072,574 91.9 42 68,277 372,882 Q2
7~9月 132 1,072,774 92.4 42 68,477 372,882 Q3
10~12月 133 1,076,868 96.0 42 68,477 372,882 Q4
平成 29年 1月 132 1,070,466 84.3 42 68,251 372,682 Jan. 2017
2月 132 1,070,466 88.2 42 68,251 372,682 Feb.
3月 132 1,070,466 98.1 42 68,251 372,682 Mar.
4月 132 1,073,347 93.5 42 68,350 372,882 Apr.
5月 132 1,072,574 88.0 42 68,277 372,882 May
6月 132 1,072,574 94.2 42 68,277 372,882 Jun.
7月 132 1,072,574 95.5 42 68,277 372,882 Jul.
8月 132 1,072,574 86.9 42 68,277 372,882 Aug.
9月 132 1,072,774 94.8 42 68,477 372,882 Sep.
10月 133 1,076,868 99.4 42 68,477 372,882 Oct.
11月 133 1,076,868 97.3 42 68,477 372,882 Nov.
12月 133 1,076,868 91.3 42 68,477 372,882 Dec.
単位:t/Unit:t
抄紙機(台) 生産能力 抄紙機(台) 生産能力
平成 25 年 26 197,601 41 412,707 C.Y. 2013
26 26 196,898 40 406,447 C.Y. 2014
27 27 201,115 42 424,361 C.Y. 2015
28 27 200,991 42 428,394 C.Y. 2016
29 27 196,902 43 438,607 C.Y. 2017
平成 27 年度 27 201,115 42 424,075 F.Y. 2015
28 27 201,139 42 428,394 F.Y. 2016
平成 29年 1~3月 27 201,139 42 428,394 Q1 2017
4~6月 27 199,378 42 432,037 Q2
7~9月 27 199,378 42 432,037 Q3
10~12月 27 196,902 43 438,607 Q4
平成 29年 1月 27 201,139 42 428,394 Jan. 2017
2月 27 201,139 42 428,394 Feb.
3月 27 201,139 42 428,394 Mar.
4月 27 200,078 42 432,037 Apr.
5月 27 199,378 42 432,037 May
6月 27 199,378 42 432,037 Jun.
7月 27 199,378 42 432,037 Jul.
8月 27 199,378 42 432,037 Aug.
9月 27 199,378 42 432,037 Sep.
10月 27 196,902 43 438,607 Oct.
11月 27 196,902 43 438,607 Nov.
12月 27 196,902 43 438,607 Dec.
Combination type Other types
注:稼働率は、生産数量/生産能力で算出。年、年度及び四半期の稼働率は、期間ごとの平均値。
年 月
(3) コンビネーション式
Number ofpaper
machine
Production capacity
(4) その他
Year andMonth
21
21
21
Number ofpaper
machine
Production capacity
21
21
21
21
21
21
21
21
21
21
21
21
21
21
21
21
21
21
20
22
Number ofpaper
machine
Production capacity
Operatingratio
(2) オントップ式
Year andMonth
Cylinder type On-top type
抄紙機(台)Number of
papermachine
Production capacity
Number ofpaper
machine
Production capacity
年 月
(1) まる網式
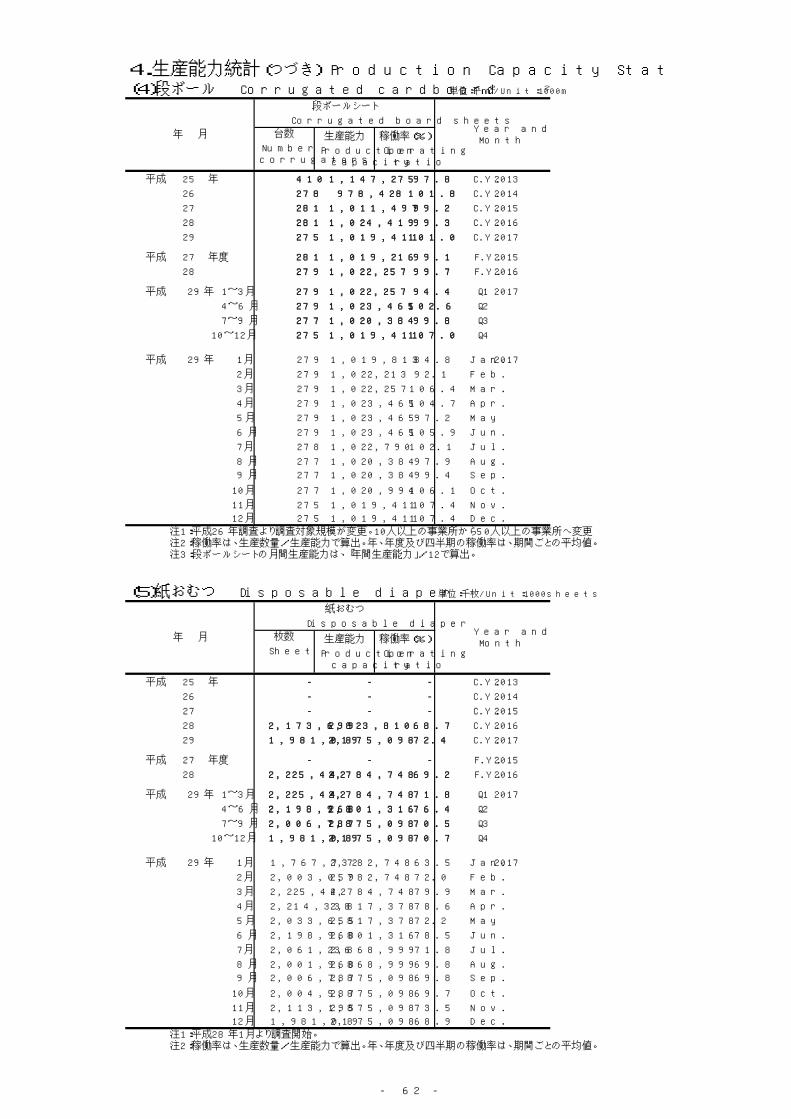
- 62 -
4.生産能力統計(つづき) Production Capacity Statistics(continued)(4)段ボール Corrugated cardboard 単位:千m2/Unit:1000m2
段ボールシート
Corrugated board sheets
台数 生産能力 稼働率(%)
平成 25 年 410 1,147,275 97.8 C.Y. 2013
26 278 978,428 101.8 C.Y. 2014
27 281 1,011,497 99.2 C.Y. 2015
28 281 1,024,419 99.3 C.Y. 2016
29 275 1,019,411 101.0 C.Y. 2017
平成 27 年度 281 1,019,216 99.1 F.Y. 2015
28 279 1,022,257 99.7 F.Y. 2016
平成 29年 1~3月 279 1,022,257 94.4 Q1 2017
4~6月 279 1,023,465 102.6 Q2
7~9月 277 1,020,384 99.8 Q3
10~12月 275 1,019,411 107.0 Q4
平成 29年 1月 279 1,019,813 84.8 Jan. 2017
2月 279 1,022,213 92.1 Feb.
3月 279 1,022,257 106.4 Mar.
4月 279 1,023,465 104.7 Apr.
5月 279 1,023,465 97.2 May
6月 279 1,023,465 105.9 Jun.
7月 278 1,022,790 102.1 Jul.
8月 277 1,020,384 97.9 Aug.
9月 277 1,020,384 99.4 Sep.
10月 277 1,020,994 106.1 Oct.
11月 275 1,019,411 107.4 Nov.
12月 275 1,019,411 107.4 Dec.
(5)紙おむつ Disposable diaper 単位:千枚/Unit:1000sheets
紙おむつ
Disposable diaper
枚数 生産能力 稼働率(%)
平成 25 年 - - - C.Y. 2013
26 - - - C.Y. 2014
27 - - - C.Y. 2015
28 2,173,699 2,823,810 68.7 C.Y. 2016
29 1,981,019 2,875,098 72.4 C.Y. 2017
平成 27 年度 - - - F.Y. 2015
28 2,225,442 2,784,748 69.2 F.Y. 2016
平成 29年 1~3月 2,225,442 2,784,748 71.8 Q1 2017
4~6月 2,198,968 2,801,316 76.4 Q2
7~9月 2,006,787 2,875,098 70.5 Q3
10~12月 1,981,019 2,875,098 70.7 Q4
平成 29年 1月 1,767,732 2,782,748 63.5 Jan. 2017
2月 2,003,059 2,782,748 72.0 Feb.
3月 2,225,442 2,784,748 79.9 Mar.
4月 2,214,338 2,817,378 78.6 Apr.
5月 2,033,655 2,817,378 72.2 May
6月 2,198,968 2,801,316 78.5 Jun.
7月 2,061,236 2,868,999 71.8 Jul.
8月 2,001,968 2,868,999 69.8 Aug.
9月 2,006,787 2,875,098 69.8 Sep.
10月 2,004,587 2,875,098 69.7 Oct.
11月 2,113,195 2,875,098 73.5 Nov.
12月 1,981,019 2,875,098 68.9 Dec.
年 月Year andMonth
Sheets Production capacity
Operatingratio
注1:平成28年1月より調査開始。注2:稼働率は、生産数量/生産能力で算出。年、年度及び四半期の稼働率は、期間ごとの平均値。
年 月Year andMonth
Number ofcorrugators
Production capacity
Operatingratio
注1:平成26年調査より調査対象規模が変更。10人以上の事業所から50人以上の事業所へ変更注2:稼働率は、生産数量/生産能力で算出。年、年度及び四半期の稼働率は、期間ごとの平均値。注3:段ボールシートの月間生産能力は、「年間生産能力」/12で算出。

- 63 -
Ⅱ 印刷統計 Printing Statistics
1. 生産・出荷・在庫統計 (平成29年) (2017)
Production, Producer's Shipments and Producer's Inventory of Finished Goods
(1)製品年計表 Annual Commodities
① 製品別内訳 Item by the product 単位:百万円 / Unit : Million Yen
合 計 377,558 Total
出 版 印 刷 65,623 Publishing printing
商 業 印 刷 142,613 Commercial printing
証 券 印 刷 5,502 Security printing
事 務 用 印 刷 54,605 Printing for the office work
包 装 印 刷 74,374 Package printing
建 装 材 印 刷 17,167 Decorative materials printing
そ の 他 の 印 刷 17,674 Other printing
単位:百万円 / Unit : Million Yen
合 計 377,558 Total
とっ版印刷(活版印刷) 25,273 Relief printing(Typographic printing)
平版印刷(オフセット印刷) 253,983 Planography printing (Offset printing)
おう版印刷(グラビア印刷) 67,719 Intaglio printing (Gravure printing)
孔版印刷(スクリーン印刷) 2,461 Permeographic printing (Screen printing)
フ レ キ ソ 印 刷 2,982 Flexographic printing
その他の印刷方式 25,140 Other printing form
区 分生 産 金 額
Production ValueClassification
②印刷方式別内訳 Item by the printing form
区 分生 産 金 額
Production ValueClassification
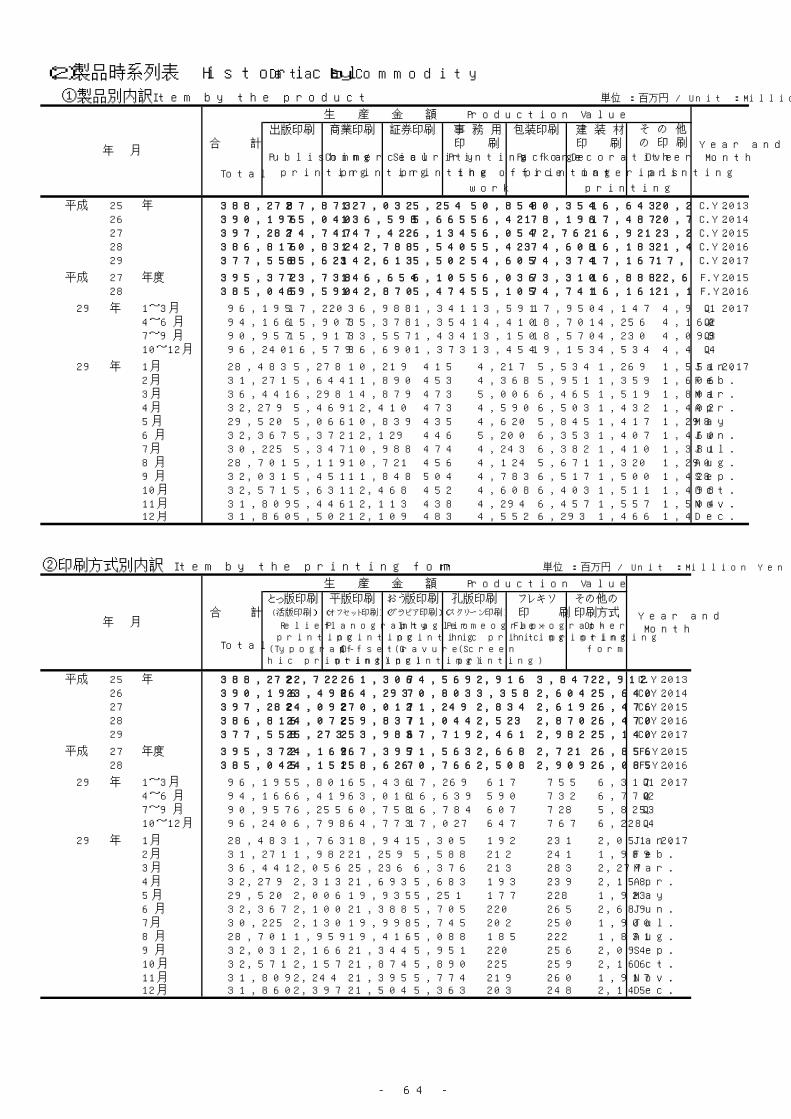
- 64 -
(2)製品時系列表 Historical Data by Commodity
①製品別内訳 Item by the product
生 産 金 額 Production Value
出版印刷 商業印刷 証券印刷 事 務 用 包装印刷 建 装 材合 計 印 刷 印 刷
Publishing Commercial Security Printing for Package Decorative
Total printing printing printing the office printing materials
work printing
平成 25 年 388,272 87,873 127,032 5,254 50,854 80,354 16,643 C.Y. 2013 26 390,196 75,040 136,598 5,665 56,421 78,196 17,487 C.Y. 2014 27 397,282 74,747 147,422 6,134 56,054 72,762 16,921 C.Y. 2015 28 386,816 70,832 142,788 5,540 55,423 74,608 16,183 C.Y. 2016 29 377,558 65,623 142,613 5,502 54,605 74,374 17,167 C.Y. 2017
平成 27 年度 395,372 73,738 146,654 6,105 56,036 73,310 16,888 F.Y. 2015 28 385,045 69,590 142,870 5,474 55,105 74,741 16,161 F.Y. 2016
29 年 1~3月 96,195 17,220 36,988 1,341 13,591 17,950 4,147 Q1 20174~6月 94,166 15,907 35,378 1,354 14,410 18,701 4,256 Q27~9月 90,957 15,917 33,557 1,434 13,150 18,570 4,230 Q310~12月 96,240 16,579 36,690 1,373 13,454 19,153 4,534 Q4
29 年 1月 28,483 5,278 10,219 415 4,217 5,534 1,269 Jan. 20172月 31,271 5,644 11,890 453 4,368 5,951 1,359 Feb.3月 36,441 6,298 14,879 473 5,006 6,465 1,519 Mar.4月 32,279 5,469 12,410 473 4,590 6,503 1,432 Apr.5月 29,520 5,066 10,839 435 4,620 5,845 1,417 May 6月 32,367 5,372 12,129 446 5,200 6,353 1,407 Jun.7月 30,225 5,347 10,988 474 4,243 6,382 1,410 Jul.8月 28,701 5,119 10,721 456 4,124 5,671 1,320 Aug.9月 32,031 5,451 11,848 504 4,783 6,517 1,500 Sep.10月 32,571 5,631 12,468 452 4,608 6,403 1,511 Oct.11月 31,809 5,446 12,113 438 4,294 6,457 1,557 Nov.12月 31,860 5,502 12,109 483 4,552 6,293 1,466 Dec.
生 産 金 額 Production Value
とっ版印刷 平版印刷 おう版印刷 孔版印刷 フレキソ その他の合 計 (活版印刷) (オフセット印刷) (グラビア印刷) (スクリーン印刷) 印 刷 印刷方式
Total
平成 25 年 388,272 22,722 261,306 74,569 2,916 3,847 22,912 C.Y. 2013 26 390,196 23,498 264,293 70,803 3,358 2,604 25,640 C.Y. 2014 27 397,282 24,092 270,012 71,249 2,834 2,619 26,476 C.Y. 2015 28 386,816 24,072 259,837 71,044 2,523 2,870 26,470 C.Y. 2016 29 377,558 25,273 253,983 67,719 2,461 2,982 25,140 C.Y. 2017
平成 27 年度 395,372 24,169 267,395 71,563 2,668 2,721 26,856 F.Y. 2015 28 385,045 24,151 258,626 70,766 2,508 2,909 26,085 F.Y. 2016
29 年 1~3月 96,195 5,801 65,436 17,269 617 755 6,317 Q1 20174~6月 94,166 6,419 63,016 16,639 590 732 6,770 Q27~9月 90,957 6,255 60,758 16,784 607 728 5,825 Q310~12月 96,240 6,798 64,773 17,027 647 767 6,228 Q4
29 年 1月 28,483 1,763 18,941 5,305 192 231 2,051 Jan. 20172月 31,271 1,982 21,259 5,588 212 241 1,989 Feb.3月 36,441 2,056 25,236 6,376 213 283 2,277 Mar.4月 32,279 2,313 21,693 5,683 193 239 2,158 Apr.5月 29,520 2,006 19,935 5,251 177 228 1,923 May 6月 32,367 2,100 21,388 5,705 220 265 2,689 Jun.7月 30,225 2,130 19,998 5,745 202 250 1,900 Jul.8月 28,701 1,959 19,416 5,088 185 222 1,831 Aug.9月 32,031 2,166 21,344 5,951 220 256 2,094 Sep.10月 32,571 2,157 21,874 5,890 225 259 2,166 Oct.11月 31,809 2,244 21,395 5,774 219 260 1,917 Nov.12月 31,860 2,397 21,504 5,363 203 248 2,145 Dec.
単位 : 百万円 / Unit : Million Yen
年 月Year andMonth
そ の 他の 印 刷Other
printing
20,26220,78923,24221,43917,674
22,64121,101
4,9584,1604,0994,457
1,5511,6061,8011,4021,2981,4601,3811,2901,4281,4981,5041,455
②印刷方式別内訳 Item by the printing form 単位 : 百万円 / Unit : Million Yen
年 月Year andMonthRelief
printing(Typograp-hic printing)
Planographyprinting(Offsetprinting)
Intaglioprinting(Gravureprinting)
Permeograp-hic printing
(Screenprinting)
Flexograp-hic printing
Otherprintingform
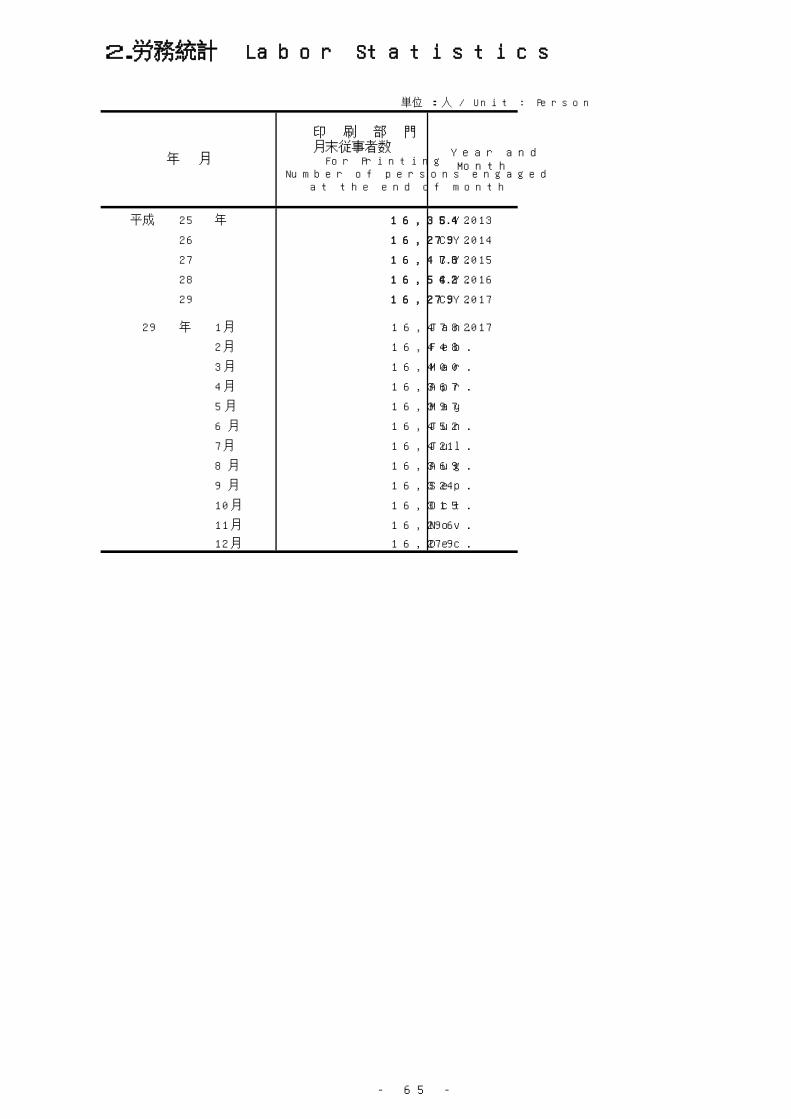
- 65 -
2.労務統計 Labor Statistics
平成 25 年 16,354 C.Y. 2013
26 16,279 C.Y. 2014
27 16,478 C.Y. 2015
28 16,542 C.Y. 2016
29 16,279 C.Y. 2017
29 年 1月 16,478 Jan. 2017
2月 16,448 Feb.
3月 16,400 Mar.
4月 16,367 Apr.
5月 16,397 May
6月 16,452 Jun.
7月 16,421 Jul.
8月 16,369 Aug.
9月 16,324 Sep.
10月 16,315 Oct.
11月 16,296 Nov.
12月 16,279 Dec.
単位 : 人 / Unit : Person
年 月
印 刷 部 門月末従事者数 For Printing
Number of persons engaged at the end of month
Year andMonth

- 66 -
Ⅲ プラスチック製品統計 Plastic Products Statistics
1.生産・出荷・在庫統計
(1)製品年計表 Annual Commodities
生 産 数 量 受 入 数 量 消 費 数 量 出 荷 数 量
販 売
Production Receipt Consumption 数 量
Quantity Quantity Quantity Quantity
1 プラスチック製品 計 5,808,801 812,804 244,068 6,002,910
2 2,506,402 393,049 167,015 2,562,511
3 2,286,546 389,584 145,392 2,366,825
4 1,677,431 122,646 29,638 1,661,759
5 農 業 用 90,541 4,927 75 94,087
6 包 装 用 1,192,429 82,764 16,603 1,194,459
7 ラ ミ ネ ー ト 137,685 15,822 1,590 147,283
8 その他の軟質製品 256,776 19,133 11,370 225,930
9 硬質製品 609,115 266,938 115,754 705,066
10 シ ー ト 219,856 3,465 21,623 195,686
11 板 114,362 5,618 1,745 109,981
12 平 板 96,791 4,886 1,737 93,246
13 波 板 17,571 732 8 16,735
14 合成皮革 56,006 602 - 55,955
15 パ イ プ 398,821 12,871 474 357,346
16 継 手 45,458 1,311 129 40,621
17 機械器具部品(照明用品を含む) 672,089 143,587 51,291 748,207
18 輸送機械用部品 505,463 112,154 34,191 568,530
19 電気通信用部品 115,038 19,820 15,494 115,727
20 51,588 11,613 1,606 63,950
21 日用品・雑貨 301,609 32,561 1,453 311,467
22 容 器 830,754 99,637 84 857,665
23 中空成形容器 502,846 94,517 84 525,699
24 その他の容器 327,908 5,120 - 331,966
25 建 材 283,809 9,908 1,164 289,442
26 雨どい及び同付属品 29,191 2,693 - 31,637
27 床 材 料 142,462 5,180 - 146,277
28 その他の建材 112,156 2,035 1,164 111,528
29 発泡製品 249,400 57,723 16,791 274,179
30 板物 81,292 2,655 3,021 74,083
31 型物 38,568 3,009 576 40,745
32 その他の発泡製品 129,540 52,059 13,194 159,351
33 強化製品 77,117 1,383 - 76,904
34 そ の 他 272,974 54,554 3,922 318,632
35 異形押出製品(建材を除く) 26,415 5,356 41 30,770
36 ホ ー ス 39,367 92 398 38,923
37 ディスクレコード 7,736 1,463 122 9,070
38 その他製品 199,456 47,643 3,361 239,869
39 〔特掲〕浴槽(個) 1,303,774 12,095 - 1,321,267
40 〔特掲〕浄化槽(個) 116,353 3,925 - 120,919
注 : 異形押出製品のうち、建材、機械器具部品、日用品・雑貨はそれぞれの品目に含む。notes : "material for building", " for machine tools and parts" ,"for daily necessaries and miscellaneous goods", in "Deformed
フィルム・シート
フィルム
軟質製品
その他の部品
Production, Producer's Shipments and Producer's Inventory of Finished Goods
番
区 分
号
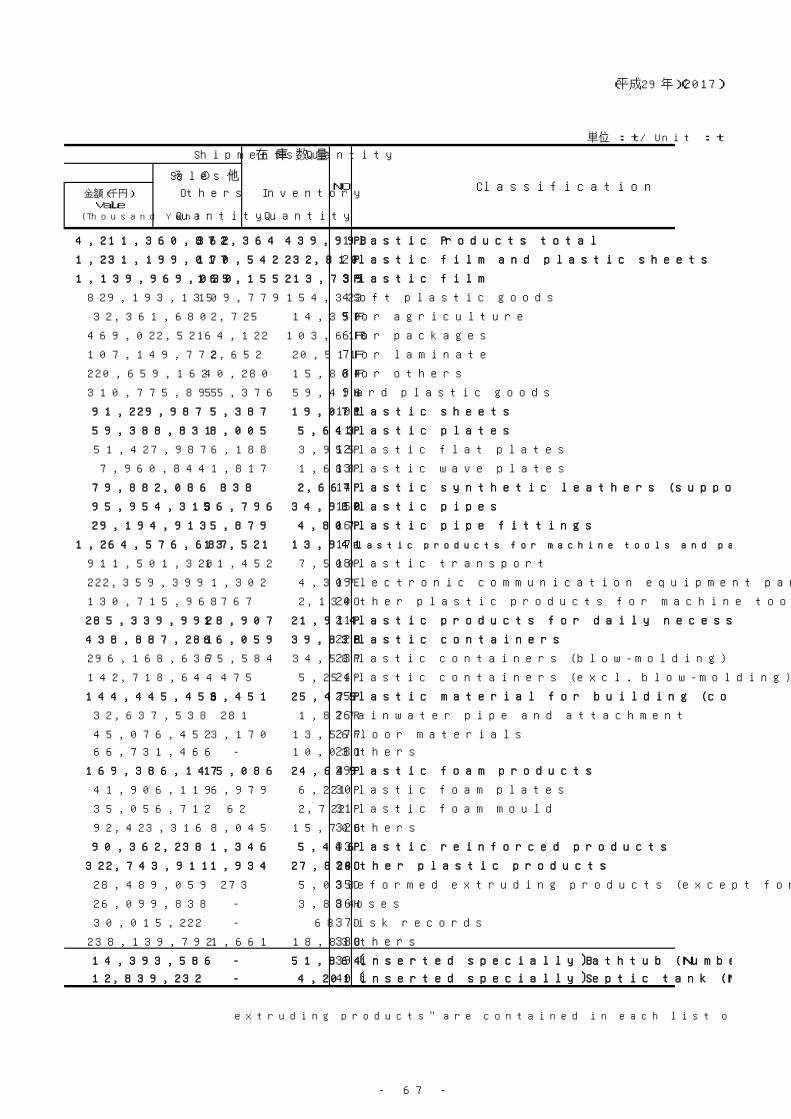
- 67 -
(平成29年) (2017)
単位 : t / Unit : t
Shipments Quantity 在 庫 数 量
Sales そ の 他
Others Inventory
Quantity Quantity
4,211,360,872 362,364 439,998 1 Plastic Products total
1,231,199,017 170,542 232,810 2 Plastic film and plastic sheets
1,139,969,030 165,155 213,739 3 Plastic film
829,193,135 109,779 154,323 4 Soft plastic goods
32,361,680 2,725 14,390 5 For agriculture
469,022,521 64,122 103,618 6 For packages
107,149,772 2,652 20,511 7 For laminate
220,659,162 40,280 15,804 8 For others
310,775,895 55,376 59,416 9 Hard plastic goods
91,229,987 5,387 19,071 10 Plastic sheets
59,388,831 8,005 5,643 11 Plastic plates
51,427,987 6,188 3,955 12 Plastic flat plates
7,960,844 1,817 1,688 13 Plastic wave plates
79,882,086 838 2,667 14 Plastic synthetic leathers (supported sheets)
95,954,313 56,796 34,980 15 Plastic pipes
29,194,913 5,879 4,807 16 Plastic pipe fittings
1,264,576,687 13,521 13,941 17 Plastic products for machine tools and parts (including lighting equipment)
911,501,320 11,452 7,500 18 Plastic transport
222,359,399 1,302 4,307 19 Electronic communication equipment parts
130,715,968 767 2,134 20 Other plastic products for machine tools and parts
285,339,992 18,907 21,914 21 Plastic products for daily necessaries and miscellaneous goods
438,887,281 66,059 39,838 22 Plastic containers
296,168,637 65,584 34,587 23 Plastic containers (blow-molding)
142,718,644 475 5,251 24 Plastic containers (excl. blow-molding)
144,445,456 3,451 25,475 25 Plastic material for building (construction)
32,637,538 281 1,877 26 Rainwater pipe and attachment
45,076,452 3,170 13,567 27 Floor materials
66,731,466 - 10,031 28 Others
169,386,147 15,086 24,649 29 Plastic foam products
41,906,119 6,979 6,221 30 Plastic foam plates
35,056,712 62 2,722 31 Plastic foam mould
92,423,316 8,045 15,706 32 Others
90,362,238 1,346 5,446 33 Plastic reinforced products
322,743,911 1,934 27,828 34 Other plastic products
28,489,059 273 5,038 35 Deformed extruding products (except for building)
26,099,838 - 3,884 36 Hoses
30,015,222 - 68 37 Disk records
238,139,792 1,661 18,838 38 Others
14,393,586 - 51,864 39 〔inserted specially〕Bathtub (Number)
12,839,232 - 4,201 40 〔inserted specially〕Septic tank (Number)
extruding products" are contained in each list of commodities classification.
NO Classification金額(千円)
Value (Thousand Yen)
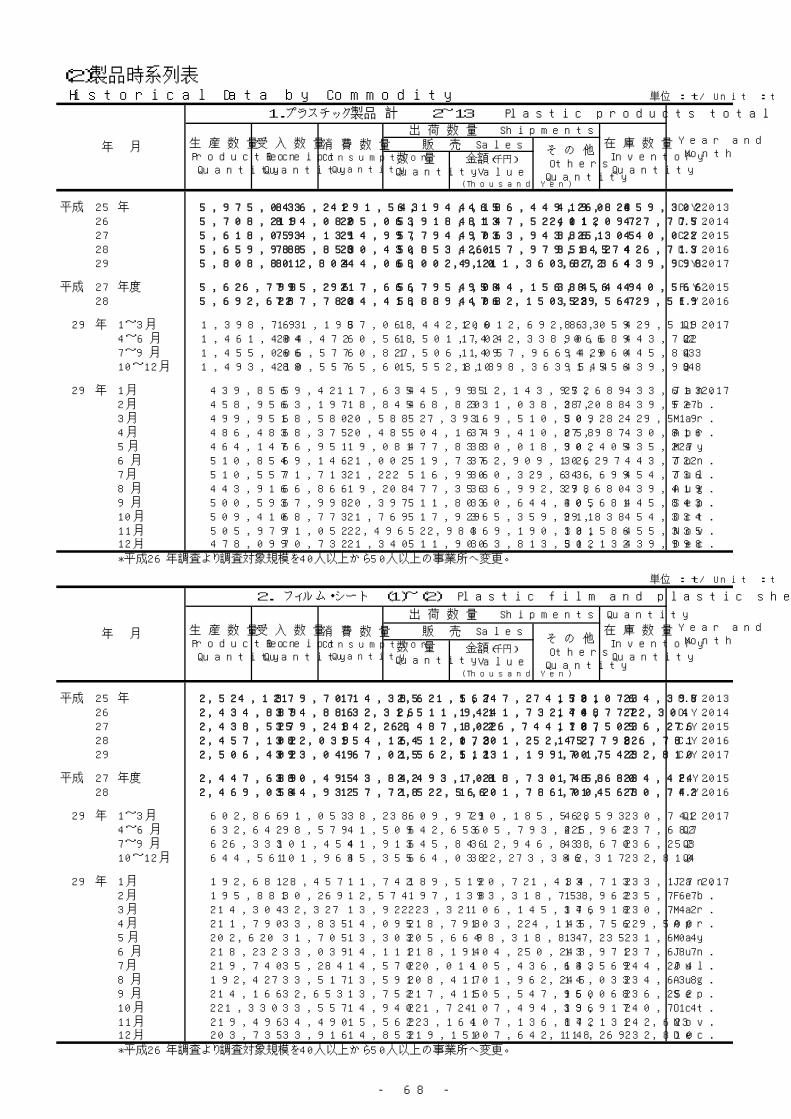
- 68 -
(2)製品時系列表 Historical Data by Commodity 単位 : t / Unit : t
平成 25 年 5,975,043 836,242 191,543 6,194,465 4,186,449,260 419,828 459,302 C.Y. 201326 5,708,219 814,082 205,063 5,918,813 4,147,522,112 401,097 427,775 C.Y. 201427 5,618,053 794,139 214,997 5,794,973 4,063,943,251 386,305 440,022 C.Y. 201528 5,659,988 785,858 230,430 5,853,261 4,057,979,145 358,274 426,713 C.Y. 201629 5,808,801 812,804 244,068 6,002,910 4,211,360,872 362,364 439,998 C.Y. 2017
平成 27 年度 5,626,798 795,296 217,666 5,795,958 4,044,156,856 384,449 440,566 F.Y. 201528 5,692,622 787,780 234,418 5,889,476 4,082,150,229 353,567 429,519 F.Y. 2016
29 年 1~3月 1,398,763 191,198 57,068 1,442,206 1,012,692,833 86,059 429,519 Q1 20174~6月 1,461,484 204,472 60,568 1,501,742 1,042,338,066 90,689 443,722 Q27~9月 1,455,066 206,577 60,827 1,506,149 1,057,966,429 94,060 445,843 Q310~12月 1,493,488 210,557 65,605 1,552,813 1,098,363,544 91,556 439,998 Q4
29 年 1月 439,856 59,421 17,635 445,995 312,143,952 27,689 433,613 Jan. 20172月 458,956 63,197 18,845 468,820 331,038,372 28,088 439,527 Feb.3月 499,951 68,580 20,588 527,391 369,510,509 30,282 429,519 Mar.4月 486,483 68,375 20,485 504,167 349,410,058 27,987 430,816 Apr.5月 464,147 66,951 19,081 477,838 330,018,902 30,405 435,227 May 6月 510,854 69,146 21,002 519,737 362,909,106 32,297 443,722 Jun.7月 510,557 71,713 21,222 516,990 360,329,646 33,699 454,736 Jul.8月 443,916 66,866 19,208 477,356 336,992,378 29,680 439,419 Aug.9月 500,593 67,998 20,397 511,803 360,644,405 30,681 445,843 Sep.10月 509,410 68,773 21,769 517,929 365,359,911 29,838 454,334 Oct.11月 505,979 71,052 22,496 522,984 369,190,131 30,586 455,335 Nov.12月 478,099 70,732 21,340 511,900 363,813,502 31,132 439,998 Dec.
*平成26年調査より調査対象規模を40人以上から50人以上の事業所へ変更。
単位 : t / Unit : t
平成 25 年 2,524,121 379,707 114,385 2,621,567 1,247,274,531 170,076 234,398 C.Y. 201326 2,434,889 374,886 132,316 2,511,941 1,241,732,408 174,777 222,304 C.Y. 201427 2,438,525 379,248 142,268 2,487,802 1,226,744,107 178,505 236,276 C.Y. 201528 2,457,102 382,039 154,164 2,512,073 1,201,252,457 172,798 226,781 C.Y. 201629 2,506,402 393,049 167,015 2,562,511 1,231,199,017 170,542 232,810 C.Y. 2017
平成 27 年度 2,447,689 380,495 143,842 2,493,708 1,218,730,458 178,680 234,424 F.Y. 201528 2,469,054 384,932 157,718 2,522,566 1,201,786,004 171,567 230,742 F.Y. 2016
29 年 1~3月 602,866 91,053 38,238 609,971 290,185,568 42,593 230,742 Q1 20174~6月 632,642 98,579 41,509 642,656 305,793,225 41,962 237,687 Q27~9月 626,333 101,454 41,913 645,846 312,946,838 43,670 236,252 Q310~12月 644,561 101,963 45,355 664,038 322,273,386 42,317 232,810 Q4
29 年 1月 192,681 28,457 11,742 189,512 90,721,434 13,713 233,127 Jan. 20172月 195,881 30,269 12,574 197,138 93,318,758 13,962 235,767 Feb.3月 214,304 32,327 13,922 223,321 106,145,376 14,918 230,742 Mar.4月 211,790 33,835 14,095 218,798 103,224,145 13,756 229,500 Apr.5月 202,620 31,705 13,303 205,664 98,318,837 14,235 231,604 May 6月 218,232 33,039 14,111 218,194 104,250,243 13,971 237,687 Jun.7月 219,740 35,284 14,570 220,014 105,436,633 14,569 244,204 Jul.8月 192,427 33,517 13,591 208,417 101,962,245 14,033 234,638 Aug.9月 214,166 32,653 13,752 217,415 105,547,960 15,068 236,252 Sep.10月 221,330 33,557 14,940 221,724 107,494,396 13,917 240,714 Oct.11月 219,496 34,490 15,562 223,164 107,136,872 14,131 242,623 Nov.12月 203,735 33,916 14,853 219,150 107,642,118 14,269 232,810 Dec.
*平成26年調査より調査対象規模を40人以上から50人以上の事業所へ変更。
数 量Quantity
金額(千円)
Value(Thousand Yen)
販 売 Salesそ の 他Others
Quantity
在 庫 数 量InventoryQuantity
年 月
2. フィルム・シート (1)~(2) Plastic film and plastic sheets
Year andMonth
生 産 数 量ProductionQuantity
受 入 数 量ReceiptQuantity
消 費 数 量Consumption
Quantity
出 荷 数 量 Shipments Quantity
数 量Quantity
金額(千円)
Value(Thousand Yen)
在 庫 数 量InventoryQuantity
販 売 Sales そ の 他Others
Quantity
生 産 数 量ProductionQuantity
受 入 数 量ReceiptQuantity
消 費 数 量Consumption
Quantity
出 荷 数 量 Shipments Quantity
年 月
1.プラスチック製品 計 2~13 Plastic products total
Year andMonth
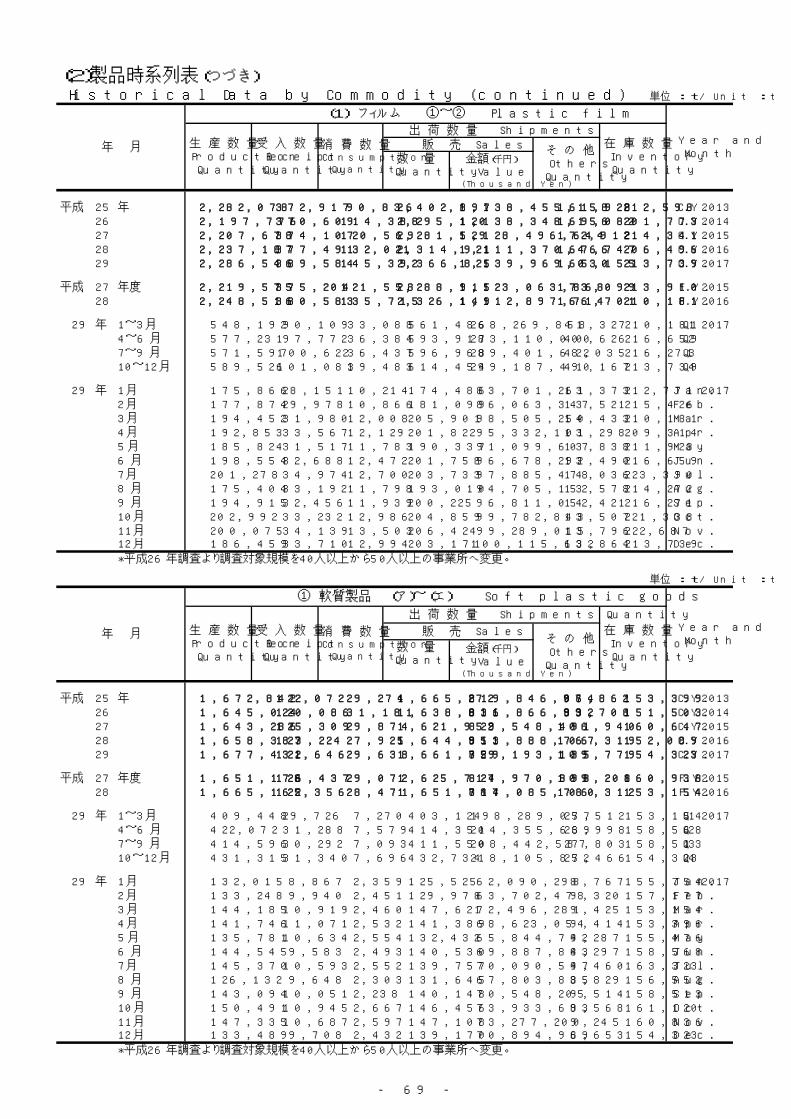
- 69 -
(2)製品時系列表(つづき) Historical Data by Commodity (continued) 単位 : t / Unit : t
平成 25 年 2,282,078 372,917 90,836 2,402,897 1,138,455,158 161,928 212,598 C.Y. 201326 2,197,776 370,609 114,388 2,295,120 1,138,348,156 169,082 201,773 C.Y. 201427 2,207,678 374,107 120,569 2,281,529 1,128,496,644 172,912 214,341 C.Y. 201528 2,237,187 377,491 132,021 2,314,921 1,111,370,466 167,747 206,496 C.Y. 201629 2,286,546 389,584 145,392 2,366,825 1,139,969,030 165,155 213,739 C.Y. 2017
平成 27 年度 2,219,575 375,204 121,558 2,288,915 1,123,063,868 173,099 213,910 F.Y. 201528 2,248,516 380,583 135,715 2,326,149 1,112,897,714 166,701 210,181 F.Y. 2016
29 年 1~3月 548,192 90,109 33,088 561,486 268,269,858 41,327 210,181 Q1 20174~6月 577,231 97,772 36,384 593,917 283,110,000 40,626 216,659 Q27~9月 571,597 100,622 36,437 596,968 289,401,682 42,035 216,271 Q310~12月 589,526 101,081 39,483 614,454 299,187,490 41,167 213,739 Q4
29 年 1月 175,866 28,151 10,214 174,486 83,701,261 13,373 212,771 Jan. 20172月 177,874 29,978 10,866 181,099 86,063,347 13,521 215,426 Feb.3月 194,452 31,980 12,008 205,901 98,505,250 14,433 210,181 Mar.4月 192,853 33,567 12,129 201,822 95,332,101 13,298 209,314 Apr.5月 185,824 31,517 11,783 190,337 91,099,607 13,838 211,923 May 6月 198,554 32,688 12,472 201,758 96,678,292 13,490 216,659 Jun.7月 201,278 34,974 12,700 203,733 97,885,478 14,036 223,390 Jul.8月 175,404 33,192 11,798 193,010 94,705,152 13,578 214,272 Aug.9月 194,915 32,456 11,939 200,225 96,811,052 14,421 216,271 Sep.10月 202,992 33,232 12,986 204,859 99,782,843 13,507 221,338 Oct.11月 200,075 34,139 13,503 206,424 99,289,015 13,796 222,687 Nov.12月 186,459 33,710 12,994 203,171 100,115,632 13,864 213,739 Dec.
*平成26年調査より調査対象規模を40人以上から50人以上の事業所へ変更。
単位 : t / Unit : t
平成 25 年 1,672,842 122,072 29,274 1,665,272 819,846,064 97,862 153,399 C.Y. 201326 1,645,024 120,086 31,181 1,638,811 836,866,832 99,708 151,503 C.Y. 201427 1,643,286 125,309 29,874 1,621,952 829,548,491 106,940 160,647 C.Y. 201528 1,658,387 123,224 27,925 1,644,951 813,888,767 106,319 152,089 C.Y. 201629 1,677,431 122,646 29,638 1,661,759 829,193,135 109,779 154,323 C.Y. 2017
平成 27 年度 1,651,178 126,437 29,072 1,625,717 824,970,898 109,208 160,938 F.Y. 201528 1,665,165 122,356 28,471 1,651,787 814,085,780 106,312 153,154 F.Y. 2016
29 年 1~3月 409,448 29,726 7,270 403,124 198,289,057 27,512 153,154 Q1 20174~6月 422,072 31,288 7,579 414,351 204,355,639 26,998 158,568 Q27~9月 414,596 30,292 7,093 411,550 208,442,587 27,803 158,513 Q310~12月 431,315 31,340 7,696 432,734 218,105,852 27,466 154,323 Q4
29 年 1月 132,015 8,867 2,359 125,525 62,090,298 8,767 155,754 Jan. 20172月 133,248 9,940 2,451 129,978 63,702,478 9,320 157,177 Feb.3月 144,185 10,919 2,460 147,621 72,496,281 9,425 153,154 Mar.4月 141,746 11,071 2,532 141,389 68,623,054 9,414 153,396 Apr.5月 135,781 10,634 2,554 132,432 65,844,742 9,287 155,476 May 6月 144,545 9,583 2,493 140,530 69,887,843 8,297 158,568 Jun.7月 145,370 10,593 2,552 139,757 70,090,547 9,460 163,323 Jul.8月 126,132 9,648 2,303 131,645 67,803,835 8,829 156,552 Aug.9月 143,094 10,051 2,238 140,148 70,548,205 9,514 158,513 Sep.10月 150,491 10,945 2,667 146,456 73,933,683 9,568 161,120 Oct.11月 147,335 10,687 2,597 147,108 73,277,200 9,245 160,836 Nov.12月 133,489 9,708 2,432 139,170 70,894,969 8,653 154,323 Dec.
*平成26年調査より調査対象規模を40人以上から50人以上の事業所へ変更。
数 量Quantity
金額(千円)
Value(Thousand Yen)
生 産 数 量ProductionQuantity
受 入 数 量ReceiptQuantity
消 費 数 量Consumption
Quantity
販 売 Salesそ の 他Others
Quantity
出 荷 数 量 Shipments Quantity
在 庫 数 量InventoryQuantity
年 月
① 軟質製品 (ア)~(エ) Soft plastic goods
Year andMonth
数 量Quantity
金額(千円)
Value(Thousand Yen)
生 産 数 量ProductionQuantity
受 入 数 量ReceiptQuantity
消 費 数 量Consumption
Quantity
販 売 Sales そ の 他Others
Quantity
出 荷 数 量 Shipments Quantity在 庫 数 量InventoryQuantity
年 月
(1) フィルム ①~② Plastic film
Year andMonth
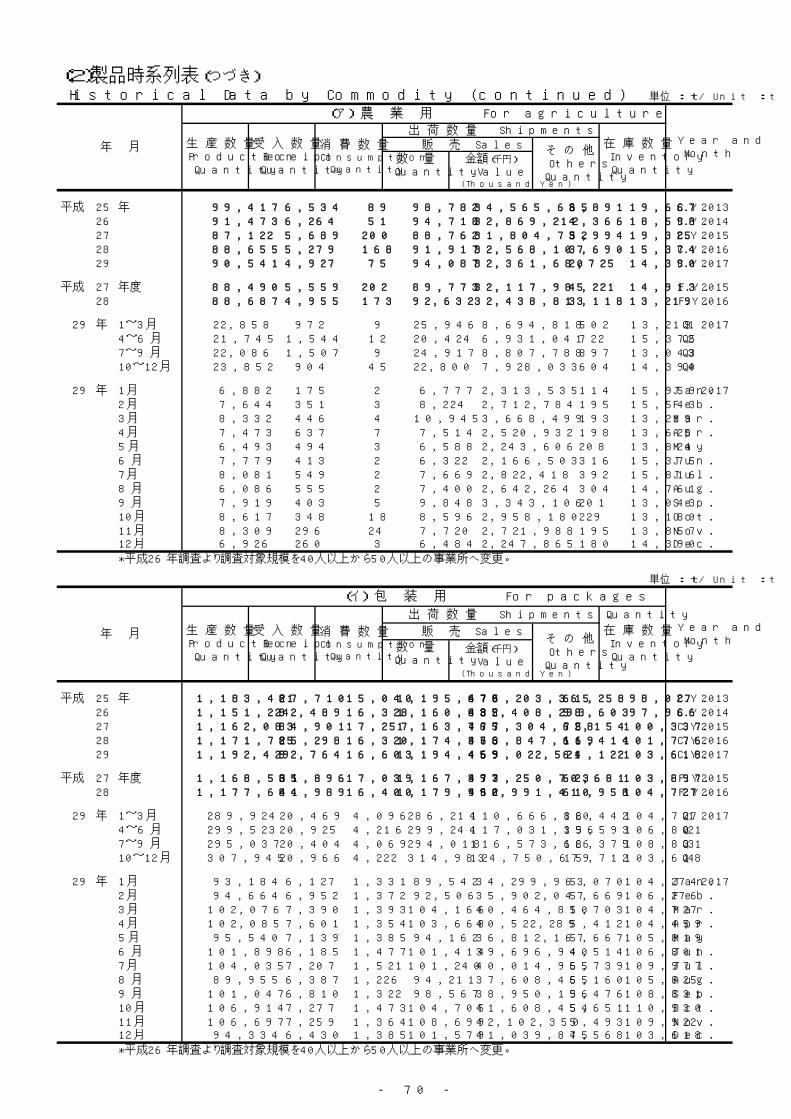
- 70 -
(2)製品時系列表(つづき) Historical Data by Commodity (continued) 単位 : t / Unit : t
平成 25 年 99,417 6,534 89 98,782 34,565,665 3,891 19,667 C.Y. 201326 91,473 6,264 51 94,718 32,869,212 4,366 18,598 C.Y. 201427 87,122 5,689 200 88,762 31,804,752 3,994 19,325 C.Y. 201528 88,655 5,279 168 91,917 32,568,107 3,690 15,374 C.Y. 201629 90,541 4,927 75 94,087 32,361,680 2,725 14,390 C.Y. 2017
平成 27 年度 88,490 5,559 202 89,773 32,117,985 4,221 14,913 F.Y. 201528 88,687 4,955 173 92,632 32,438,813 3,118 13,219 F.Y. 2016
29 年 1~3月 22,858 972 9 25,946 8,694,818 502 13,219 Q1 20174~6月 21,745 1,544 12 20,424 6,931,041 722 15,375 Q27~9月 22,086 1,507 9 24,917 8,807,788 897 13,043 Q310~12月 23,852 904 45 22,800 7,928,033 604 14,390 Q4
29 年 1月 6,882 175 2 6,777 2,313,535 114 15,959 Jan. 20172月 7,644 351 3 8,224 2,712,784 195 15,543 Feb.3月 8,332 446 4 10,945 3,668,499 193 13,219 Mar.4月 7,473 637 7 7,514 2,520,932 198 13,625 Apr.5月 6,493 494 3 6,588 2,243,606 208 13,824 May 6月 7,779 413 2 6,322 2,166,503 316 15,375 Jun.7月 8,081 549 2 7,669 2,822,418 392 15,816 Jul.8月 6,086 555 2 7,400 2,642,264 304 14,761 Aug.9月 7,919 403 5 9,848 3,343,106 201 13,043 Sep.10月 8,617 348 18 8,596 2,958,180 229 13,180 Oct.11月 8,309 296 24 7,720 2,721,988 195 13,857 Nov.12月 6,926 260 3 6,484 2,247,865 180 14,390 Dec.
*平成26年調査より調査対象規模を40人以上から50人以上の事業所へ変更。
単位 : t / Unit : t
平成 25 年 1,183,421 87,710 15,040 1,195,670 475,203,365 61,258 98,027 C.Y. 201326 1,151,224 82,489 16,328 1,160,835 482,408,293 58,603 97,966 C.Y. 201427 1,162,083 84,901 17,257 1,163,765 477,304,758 62,154 100,337 C.Y. 201528 1,171,725 85,298 16,320 1,174,376 463,847,169 61,414 101,776 C.Y. 201629 1,192,429 82,764 16,603 1,194,459 469,022,521 64,122 103,618 C.Y. 2017
平成 27 年度 1,168,531 85,896 17,039 1,167,397 473,250,703 62,681 103,897 F.Y. 201528 1,177,641 84,989 16,400 1,179,990 462,991,410 61,958 104,727 F.Y. 2016
29 年 1~3月 289,924 20,469 4,096 286,214 110,666,820 16,442 104,727 Q1 20174~6月 299,523 20,925 4,216 299,244 117,031,396 15,593 106,801 Q27~9月 295,037 20,404 4,069 294,018 116,573,626 16,375 108,831 Q310~12月 307,945 20,966 4,222 314,983 124,750,679 15,712 103,618 Q4
29 年 1月 93,184 6,127 1,331 89,542 34,299,963 5,070 104,274 Jan. 20172月 94,664 6,952 1,372 92,506 35,902,047 5,669 106,276 Feb.3月 102,076 7,390 1,393 104,166 40,464,810 5,703 104,727 Mar.4月 102,085 7,601 1,354 103,668 40,522,289 5,412 104,459 Apr.5月 95,540 7,139 1,385 94,162 36,812,167 5,667 105,819 May 6月 101,898 6,185 1,477 101,414 39,696,940 4,514 106,801 Jun.7月 104,035 7,207 1,521 101,240 40,014,965 5,739 109,977 Jul.8月 89,955 6,387 1,226 94,211 37,608,465 5,160 105,825 Aug.9月 101,047 6,810 1,322 98,567 38,950,196 5,476 108,831 Sep.10月 106,914 7,277 1,473 104,705 41,608,454 5,651 110,930 Oct.11月 106,697 7,259 1,364 108,699 42,102,350 5,493 109,922 Nov.12月 94,334 6,430 1,385 101,579 41,039,875 4,568 103,618 Dec.
*平成26年調査より調査対象規模を40人以上から50人以上の事業所へ変更。
数 量Quantity
金額(千円)
Value(Thousand Yen)
販 売 Salesそ の 他Others
Quantity
在 庫 数 量InventoryQuantity
年 月
(イ) 包 装 用 For packages
Year andMonth
生 産 数 量ProductionQuantity
受 入 数 量ReceiptQuantity
消 費 数 量Consumption
Quantity
出 荷 数 量 Shipments Quantity
数 量Quantity
金額(千円)
Value(Thousand Yen)
そ の 他Others
Quantity
販 売 Sales 在 庫 数 量InventoryQuantity
生 産 数 量ProductionQuantity
受 入 数 量ReceiptQuantity
年 月
(ア) 農 業 用 For agriculture
Year andMonth
消 費 数 量Consumption
Quantity
出 荷 数 量 Shipments Quantity

- 71 -
(2)製品時系列表(つづき) Historical Data by Commodity (continued) 単位 : t / Unit : t
平成 25 年 140,290 15,362 3,039 149,310 107,358,032 2,668 17,265 C.Y. 201326 130,089 13,362 2,456 137,615 105,594,695 2,858 17,209 C.Y. 201427 131,556 13,554 2,204 138,543 105,251,113 2,846 18,307 C.Y. 201528 141,616 12,903 1,305 149,360 108,745,147 2,585 19,127 C.Y. 201629 137,685 15,822 1,590 147,283 107,149,772 2,652 20,511 C.Y. 2017
平成 27 年度 134,385 13,478 1,847 141,603 106,840,646 2,722 18,930 F.Y. 201528 141,004 13,489 1,435 148,741 107,652,694 2,656 19,684 F.Y. 2016
29 年 1~3月 33,960 3,816 368 35,843 26,004,871 688 19,684 Q1 20174~6月 34,676 4,041 349 37,366 26,545,823 645 19,899 Q27~9月 34,312 3,867 465 36,372 26,753,187 679 20,463 Q310~12月 34,737 4,098 408 37,702 27,845,891 640 20,511 Q4
29 年 1月 10,245 1,070 123 10,714 7,802,926 184 19,234 Jan. 20172月 11,343 1,341 108 11,882 8,550,563 195 19,652 Feb.3月 12,372 1,405 137 13,247 9,651,382 309 19,684 Mar.4月 11,533 1,362 141 12,836 9,108,640 222 19,398 Apr.5月 10,489 1,219 101 11,497 8,038,514 192 19,263 May 6月 12,654 1,460 107 13,033 9,398,669 231 19,899 Jun.7月 12,439 1,328 149 12,435 8,908,153 251 20,819 Jul.8月 9,725 1,115 132 11,258 8,535,907 213 20,009 Aug.9月 12,148 1,424 184 12,679 9,309,127 215 20,463 Sep.10月 12,109 1,430 151 12,862 9,410,470 228 20,779 Oct.11月 12,073 1,324 132 12,752 9,487,895 222 21,034 Nov.12月 10,555 1,344 125 12,088 8,947,526 190 20,511 Dec.
*平成26年調査より調査対象規模を40人以上から50人以上の事業所へ変更。
単位 : t / Unit : t
平成 25 年 249,714 12,466 11,106 221,510 202,719,002 30,045 18,440 C.Y. 201326 272,238 17,971 12,346 245,643 215,994,632 33,881 17,730 C.Y. 201427 262,525 21,165 10,213 230,882 215,187,868 37,946 22,678 C.Y. 201528 256,391 19,744 10,132 229,298 208,728,344 38,630 15,812 C.Y. 201629 256,776 19,133 11,370 225,930 220,659,162 40,280 15,804 C.Y. 2017
平成 27 年度 259,772 21,504 9,984 226,944 212,761,564 39,584 23,198 F.Y. 201528 257,833 18,923 10,463 230,424 211,002,863 38,580 15,524 F.Y. 2016
29 年 1~3月 62,706 4,469 2,797 55,121 52,922,548 9,880 15,524 Q1 20174~6月 66,128 4,778 3,002 57,317 53,847,379 10,038 16,493 Q27~9月 63,161 4,514 2,550 56,243 56,307,986 9,852 16,176 Q310~12月 64,781 5,372 3,021 57,249 57,581,249 10,510 15,804 Q4
29 年 1月 21,704 1,495 903 18,492 17,673,874 3,399 16,287 Jan. 20172月 19,597 1,296 968 17,366 16,537,084 3,261 15,706 Feb.3月 21,405 1,678 926 19,263 18,711,590 3,220 15,524 Mar.4月 20,655 1,471 1,030 17,371 16,471,193 3,582 15,914 Apr.5月 23,259 1,782 1,065 20,185 18,750,455 3,220 16,570 May 6月 22,214 1,525 907 19,761 18,625,731 3,236 16,493 Jun.7月 20,815 1,509 880 18,413 18,345,011 3,078 16,711 Jul.8月 20,366 1,591 943 18,776 19,017,199 3,152 15,957 Aug.9月 21,980 1,414 727 19,054 18,945,776 3,622 16,176 Sep.10月 22,851 1,890 1,025 20,293 19,956,579 3,460 16,231 Oct.11月 20,256 1,808 1,077 17,937 18,964,967 3,335 16,023 Nov.12月 21,674 1,674 919 19,019 18,659,703 3,715 15,804 Dec.
*平成26年調査より調査対象規模を40人以上から50人以上の事業所へ変更。
在 庫 数 量InventoryQuantity
販 売 Salesそ の 他Others
Quantity
数 量Quantity
生 産 数 量ProductionQuantity
受 入 数 量ReceiptQuantity
消 費 数 量Consumption
Quantity
出 荷 数 量 Shipments Quantity
金額(千円)
Value(Thousand Yen)
年 月
(エ) そ の 他 の 軟 質 製 品 For others
Year andMonth
在 庫 数 量InventoryQuantity
販 売 Sales そ の 他Others
Quantity
数 量Quantity
出 荷 数 量 Shipments Quantity
金額(千円)
Value(Thousand Yen)
生 産 数 量ProductionQuantity
受 入 数 量ReceiptQuantity
消 費 数 量Consumption
Quantity
年 月
(ウ) ラミネート For laminate
Year andMonth
- 72 -
(2)製品時系列表(つづき) Historical Data by Commodity (continued) 単位 : t / Unit : t
平成 25 年 609,236 250,845 61,562 737,625 318,609,094 64,066 59,199 C.Y. 201326 552,752 250,523 83,207 656,309 301,481,324 69,374 50,270 C.Y. 201427 564,392 248,798 90,695 659,577 298,948,153 65,972 53,694 C.Y. 201528 578,800 254,267 104,096 669,970 297,481,699 61,428 54,407 C.Y. 201629 609,115 266,938 115,754 705,066 310,775,895 55,376 59,416 C.Y. 2017
平成 27 年度 568,397 248,767 92,486 663,198 298,092,970 63,891 52,972 F.Y. 201528 583,351 258,227 107,244 674,362 298,811,934 60,389 57,027 F.Y. 2016
29 年 1~3月 138,744 60,383 25,818 158,362 69,980,801 13,815 57,027 Q1 20174~6月 155,159 66,484 28,805 179,566 78,754,361 13,628 58,091 Q27~9月 157,001 70,330 29,344 185,418 80,959,095 14,232 57,758 Q310~12月 158,211 69,741 31,787 181,720 81,081,638 13,701 59,416 Q4
29 年 1月 43,851 19,284 7,855 48,961 21,610,963 4,606 57,017 Jan. 20172月 44,626 20,038 8,415 51,121 22,360,869 4,201 58,249 Feb.3月 50,267 21,061 9,548 58,280 26,008,969 5,008 57,027 Mar.4月 51,107 22,496 9,597 60,433 26,709,047 3,884 55,918 Apr.5月 50,043 20,883 9,229 57,905 25,254,865 4,551 56,447 May 6月 54,009 23,105 9,979 61,228 26,790,449 5,193 58,091 Jun.7月 55,908 24,381 10,148 63,976 27,794,931 4,576 60,067 Jul.8月 49,272 23,544 9,495 61,365 26,901,317 4,749 57,720 Aug.9月 51,821 22,405 9,701 60,077 26,262,847 4,907 57,758 Sep.10月 52,501 22,287 10,319 58,403 25,849,160 3,939 60,218 Oct.11月 52,740 23,452 10,906 59,316 26,011,815 4,551 61,851 Nov.12月 52,970 24,002 10,562 64,001 29,220,663 5,211 59,416 Dec.
*平成26年調査より調査対象規模を40人以上から50人以上の事業所へ変更。
単位 : t / Unit : t
平成 25 年 242,043 6,790 23,549 218,670 108,819,373 8,148 21,800 C.Y. 201326 237,113 4,277 17,928 216,821 103,384,252 5,695 20,531 C.Y. 201427 230,847 5,141 21,699 206,273 98,247,463 5,593 21,935 C.Y. 201528 219,915 4,548 22,143 197,152 89,881,991 5,051 20,285 C.Y. 201629 219,856 3,465 21,623 195,686 91,229,987 5,387 19,071 C.Y. 2017
平成 27 年度 228,114 5,291 22,284 204,793 95,666,590 5,581 20,514 F.Y. 201528 220,538 4,349 22,003 196,417 88,888,290 4,866 20,561 F.Y. 2016
29 年 1~3月 54,674 944 5,150 48,485 21,915,710 1,266 20,561 Q1 20174~6月 55,411 807 5,125 48,739 22,683,225 1,336 21,028 Q27~9月 54,736 832 5,476 48,878 23,545,156 1,635 19,981 Q310~12月 55,035 882 5,872 49,584 23,085,896 1,150 19,071 Q4
29 年 1月 16,815 306 1,528 15,026 7,020,173 340 20,356 Jan. 20172月 18,007 291 1,708 16,039 7,255,411 441 20,341 Feb.3月 19,852 347 1,914 17,420 7,640,126 485 20,561 Mar.4月 18,937 268 1,966 16,976 7,892,044 458 20,186 Apr.5月 16,796 188 1,520 15,327 7,219,230 397 19,681 May 6月 19,678 351 1,639 16,436 7,571,951 481 21,028 Jun.7月 18,462 310 1,870 16,281 7,551,155 533 20,814 Jul.8月 17,023 325 1,793 15,407 7,257,093 455 20,366 Aug.9月 19,251 197 1,813 17,190 8,736,908 647 19,981 Sep.10月 18,338 325 1,954 16,865 7,711,553 410 19,376 Oct.11月 19,421 351 2,059 16,740 7,847,857 335 19,936 Nov.12月 17,276 206 1,859 15,979 7,526,486 405 19,071 Dec.
*平成26年調査より調査対象規模を40人以上から50人以上の事業所へ変更。
数 量Quantity
金額(千円)
Value(Thousand Yen)
在 庫 数 量InventoryQuantity
販 売 Salesそ の 他Others
Quantity
年 月
(2) シート Plastic sheets
Year andMonth
生 産 数 量ProductionQuantity
受 入 数 量ReceiptQuantity
消 費 数 量Consumption
Quantity
出 荷 数 量 Shipments Quantity
在 庫 数 量InventoryQuantity
そ の 他Others
Quantity
数 量Quantity
金額(千円)
Value(Thousand Yen)
販 売 Sales生 産 数 量ProductionQuantity
受 入 数 量ReceiptQuantity
年 月
② 硬質製品 Hard plastic goods
Year andMonth
消 費 数 量Consumption
Quantity
出 荷 数 量 Shipments Quantity

- 73 -
(2)製品時系列表(つづき) Historical Data by Commodity (continued) 単位 : t / Unit : t
平成 25 年 124,575 7,812 3,836 119,178 59,693,700 8,450 12,437 C.Y. 201326 107,571 5,718 1,875 104,148 53,357,716 8,369 7,025 C.Y. 201427 111,702 5,403 1,397 106,845 56,535,419 8,250 6,499 C.Y. 201528 113,163 5,433 1,901 106,373 55,792,854 8,775 6,681 C.Y. 201629 114,362 5,618 1,745 109,981 59,388,831 8,005 5,643 C.Y. 2017
平成 27 年度 112,092 5,431 1,530 106,288 55,877,848 8,262 6,486 F.Y. 201528 115,391 5,431 1,855 108,673 57,059,528 9,089 6,233 F.Y. 2016
29 年 1~3月 28,284 1,371 562 27,094 14,363,696 2,040 6,233 Q1 20174~6月 28,464 1,320 322 26,888 14,595,424 2,322 5,904 Q27~9月 28,552 1,428 402 27,449 14,857,547 1,944 6,054 Q310~12月 29,062 1,499 459 28,550 15,572,164 1,699 5,643 Q4
29 年 1月 8,830 504 215 8,234 4,445,199 707 6,752 Jan. 20172月 9,328 426 204 8,727 4,693,136 612 6,794 Feb.3月 10,126 441 143 10,133 5,225,361 721 6,233 Mar.4月 9,509 416 113 8,928 4,840,207 747 5,921 Apr.5月 8,831 405 73 8,467 4,687,686 762 5,774 May 6月 10,124 499 136 9,493 5,067,531 813 5,904 Jun.7月 9,675 472 121 9,261 4,942,289 698 5,928 Jul.8月 8,903 451 78 8,587 4,703,976 619 5,992 Aug.9月 9,974 505 203 9,601 5,211,282 627 6,054 Sep.10月 9,766 530 194 9,574 5,192,132 557 5,927 Oct.11月 9,685 428 108 9,613 5,292,236 568 5,616 Nov.12月 9,611 541 157 9,363 5,087,796 574 5,643 Dec.
*平成26年調査より調査対象規模を40人以上から50人以上の事業所へ変更。
単位 : t / Unit : t
平成 25 年 105,418 4,785 3,836 99,781 52,923,279 6,334 10,047 C.Y. 201326 88,720 4,971 1,874 86,184 46,499,339 6,567 4,647 C.Y. 201427 93,794 4,677 1,384 89,926 48,539,645 6,349 4,488 C.Y. 201528 95,341 4,866 1,889 90,316 48,470,884 6,777 4,512 C.Y. 201629 96,791 4,886 1,737 93,246 51,427,987 6,188 3,955 C.Y. 2017
平成 27 年度 93,901 4,734 1,518 89,400 48,020,272 6,377 4,454 F.Y. 201528 97,779 4,830 1,844 92,571 49,670,799 7,098 4,256 F.Y. 2016
29 年 1~3月 24,728 1,249 560 23,560 12,706,703 1,748 4,256 Q1 20174~6月 23,715 1,171 318 22,703 12,642,824 1,750 3,830 Q27~9月 23,983 1,216 400 23,186 12,839,257 1,389 4,061 Q310~12月 24,365 1,250 459 23,797 13,239,203 1,301 3,955 Q4
29 年 1月 7,685 461 213 7,261 3,998,299 601 4,490 Jan. 20172月 8,267 390 204 7,702 4,207,670 537 4,549 Feb.3月 8,776 398 143 8,597 4,500,734 610 4,256 Mar.4月 8,029 376 112 7,602 4,228,829 595 3,917 Apr.5月 7,333 361 73 7,139 4,055,805 577 3,753 May 6月 8,353 434 133 7,962 4,358,190 578 3,830 Jun.7月 8,130 400 121 7,950 4,324,528 482 3,778 Jul.8月 7,472 363 77 7,306 4,101,748 449 3,789 Aug.9月 8,381 453 202 7,930 4,412,981 458 4,061 Sep.10月 8,245 469 194 8,086 4,455,245 430 3,981 Oct.11月 8,088 360 108 7,802 4,376,453 454 4,002 Nov.12月 8,032 421 157 7,909 4,407,505 417 3,955 Dec.
*平成26年調査より調査対象規模を40人以上から50人以上の事業所へ変更。
数 量Quantity
金額(千円)
Value(Thousand Yen)
生 産 数 量ProductionQuantity
受 入 数 量ReceiptQuantity
消 費 数 量Consumption
Quantity
出 荷 数 量 Shipments Quantity
在 庫 数 量InventoryQuantity
販 売 Salesそ の 他Others
Quantity
年 月
(3) 平 板 Plastic flat plates
Year andMonth
生 産 数 量ProductionQuantity
受 入 数 量ReceiptQuantity
数 量Quantity
金額(千円)
Value(Thousand Yen)
消 費 数 量Consumption
Quantity
出 荷 数 量 Shipments Quantity在 庫 数 量InventoryQuantity
販 売 Sales そ の 他Others
Quantity
年 月
3. 板 (3)~(4) Plastic plates
Year andMonth
- 74 -
(2)製品時系列表(つづき) Historical Data by Commodity (continued) 単位 : t / Unit : t
平成 25 年 19,157 3,027 - 19,397 6,770,421 2,116 2,390 C.Y. 201326 18,851 747 1 17,964 6,858,377 1,802 2,378 C.Y. 201427 17,908 726 13 16,919 7,995,774 1,901 2,011 C.Y. 201528 17,822 567 12 16,057 7,321,970 1,998 2,169 C.Y. 201629 17,571 732 8 16,735 7,960,844 1,817 1,688 C.Y. 2017
平成 27 年度 18,191 697 12 16,888 7,857,576 1,885 2,032 F.Y. 201528 17,612 601 11 16,102 7,388,729 1,991 1,977 F.Y. 2016
29 年 1~3月 3,556 122 2 3,534 1,656,993 292 1,977 Q1 20174~6月 4,749 149 4 4,185 1,952,600 572 2,074 Q27~9月 4,569 212 2 4,263 2,018,290 555 1,993 Q310~12月 4,697 249 - 4,753 2,332,961 398 1,688 Q4
29 年 1月 1,145 43 2 973 446,900 106 2,262 Jan. 20172月 1,061 36 - 1,025 485,466 75 2,245 Feb.3月 1,350 43 - 1,536 724,627 111 1,977 Mar.4月 1,480 40 1 1,326 611,378 152 2,004 Apr.5月 1,498 44 - 1,328 631,881 185 2,021 May 6月 1,771 65 3 1,531 709,341 235 2,074 Jun.7月 1,545 72 - 1,311 617,761 216 2,150 Jul.8月 1,431 88 1 1,281 602,228 170 2,203 Aug.9月 1,593 52 1 1,671 798,301 169 1,993 Sep.10月 1,521 61 - 1,488 736,887 127 1,946 Oct.11月 1,597 68 - 1,811 915,783 114 1,614 Nov.12月 1,579 120 - 1,454 680,291 157 1,688 Dec.
*平成26年調査より調査対象規模を40人以上から50人以上の事業所へ変更。
単位 : t / Unit : t
平成 25 年 50,146 618 - 50,052 68,975,472 745 2,269 C.Y. 201326 53,058 584 - 52,665 74,196,693 747 2,516 C.Y. 201427 54,062 715 - 54,033 79,299,939 783 2,529 C.Y. 201528 56,952 685 - 56,507 80,415,147 807 2,784 C.Y. 201629 56,006 602 - 55,955 79,882,086 838 2,667 C.Y. 2017
平成 27 年度 54,218 716 - 54,072 79,699,295 731 2,754 F.Y. 201528 56,575 677 - 56,292 79,613,624 841 2,812 F.Y. 2016
29 年 1~3月 13,883 168 - 13,819 19,537,519 216 2,812 Q1 20174~6月 13,654 143 - 13,756 19,424,231 209 2,662 Q27~9月 13,317 144 - 13,295 19,267,059 184 2,664 Q310~12月 15,152 147 - 15,085 21,653,277 229 2,667 Q4
29 年 1月 4,177 49 - 4,280 6,149,919 71 2,668 Jan. 20172月 4,894 55 - 4,739 6,559,625 78 2,802 Feb.3月 4,812 64 - 4,800 6,827,975 67 2,812 Mar.4月 4,576 50 - 4,666 6,611,131 51 2,723 Apr.5月 4,152 44 - 4,269 5,930,798 68 2,597 May 6月 4,926 49 - 4,821 6,882,302 90 2,662 Jun.7月 4,548 38 - 4,494 6,406,323 68 2,688 Jul.8月 4,250 44 - 4,196 6,012,593 51 2,741 Aug.9月 4,519 62 - 4,605 6,848,143 65 2,664 Sep.10月 5,050 42 - 5,049 7,016,705 71 2,650 Oct.11月 5,220 56 - 5,161 7,439,321 82 2,674 Nov.12月 4,882 49 - 4,875 7,197,251 76 2,667 Dec.
*平成26年調査より調査対象規模を40人以上から50人以上の事業所へ変更。
在 庫 数 量InventoryQuantity
販 売 Salesそ の 他Others
Quantity
数 量Quantity
金額(千円)
Value(Thousand Yen)
消 費 数 量Consumption
Quantity
出 荷 数 量 Shipments Quantity
年 月
4.合成皮革 Plastic synthetic leathers (supported sheets)
Year andMonth
生 産 数 量ProductionQuantity
受 入 数 量ReceiptQuantity
在 庫 数 量InventoryQuantity
販 売 Sales数 量Quantity
金額(千円)
Value(Thousand Yen)
そ の 他Others
Quantity
消 費 数 量Consumption
Quantity
出 荷 数 量 Shipments Quantity受 入 数 量
ReceiptQuantity
年 月
(4) 波 板 Plastic wave plates
Year andMonth
生 産 数 量ProductionQuantity
- 75 -
(2)製品時系列表(つづき) Historical Data by Commodity (continued) 単位 : t / Unit : t
平成 25 年 480,706 19,041 412 425,957 110,399,381 74,211 44,376 C.Y. 201326 432,057 17,241 575 384,180 105,317,190 66,355 39,217 C.Y. 201427 397,497 14,274 442 351,222 96,973,565 61,679 37,565 C.Y. 201528 387,232 12,610 434 344,761 92,348,112 56,915 36,536 C.Y. 201629 398,821 12,871 474 357,346 95,954,313 56,796 34,980 C.Y. 2017
平成 27 年度 392,016 12,378 451 344,073 93,822,553 61,122 36,217 F.Y. 201528 384,544 13,332 437 346,565 92,761,785 55,514 32,652 F.Y. 2016
29 年 1~3月 95,199 3,565 126 89,754 24,018,736 13,130 32,652 Q1 20174~6月 93,735 2,793 119 82,534 21,657,121 12,695 34,228 Q27~9月 101,892 3,200 116 88,338 24,043,354 15,214 35,998 Q310~12月 107,995 3,313 113 96,720 26,235,102 15,757 34,980 Q4
29 年 1月 32,212 1,298 54 29,916 7,992,417 4,838 35,431 Jan. 20172月 31,800 1,182 36 28,628 7,757,637 4,451 35,344 Feb.3月 31,187 1,085 36 31,210 8,268,682 3,841 32,652 Mar.4月 29,574 767 39 25,198 6,713,813 3,670 34,207 Apr.5月 29,218 1,037 41 26,801 7,021,131 4,222 33,570 May 6月 34,943 989 39 30,535 7,922,177 4,803 34,228 Jun.7月 35,506 1,135 38 29,020 7,978,384 5,933 36,028 Jul.8月 28,513 1,026 38 26,764 7,379,732 3,965 34,970 Aug.9月 37,873 1,039 40 32,554 8,685,238 5,316 35,998 Sep.10月 36,435 1,093 39 31,505 8,393,308 5,201 36,957 Oct.11月 36,709 1,260 36 33,221 9,181,672 5,592 36,184 Nov.12月 34,851 960 38 31,994 8,660,122 4,964 34,980 Dec.
*平成26年調査より調査対象規模を40人以上から50人以上の事業所へ変更。
単位 : t / Unit : t
平成 25 年 60,783 4,277 299 57,757 44,984,171 6,892 5,647 C.Y. 201326 56,839 3,804 253 54,053 37,714,764 6,100 5,485 C.Y. 201427 43,360 1,497 157 39,739 27,045,527 5,151 4,910 C.Y. 201528 44,136 1,347 131 39,866 27,318,760 5,517 4,830 C.Y. 201629 45,458 1,311 129 40,621 29,194,913 5,879 4,807 C.Y. 2017
平成 27 年度 43,420 1,431 131 39,732 26,984,869 5,126 5,063 F.Y. 201528 44,190 1,372 138 39,777 27,597,152 5,640 4,952 F.Y. 2016
29 年 1~3月 11,232 355 35 9,889 7,174,173 1,483 4,952 Q1 20174~6月 10,590 301 31 9,940 6,873,403 1,178 4,654 Q27~9月 11,299 317 30 10,025 7,235,005 1,489 4,693 Q310~12月 12,337 338 33 10,767 7,912,332 1,729 4,807 Q4
29 年 1月 3,647 102 9 3,011 2,123,161 551 4,978 Jan. 20172月 3,820 131 10 3,319 2,433,072 436 5,149 Feb.3月 3,765 122 16 3,559 2,617,940 496 4,952 Mar.4月 3,553 123 12 3,280 2,311,670 361 4,959 Apr.5月 3,192 92 9 3,017 2,076,298 372 4,832 May 6月 3,845 86 10 3,643 2,485,435 445 4,654 Jun.7月 3,974 100 10 3,355 2,353,316 515 4,837 Jul.8月 3,215 99 11 3,031 2,247,751 427 4,671 Aug.9月 4,110 118 9 3,639 2,633,938 547 4,693 Sep.10月 4,302 102 11 3,481 2,551,383 665 4,937 Oct.11月 3,994 111 11 3,578 2,654,181 549 4,898 Nov.12月 4,041 125 11 3,708 2,706,768 515 4,807 Dec.
*平成26年調査より調査対象規模を40人以上から50人以上の事業所へ変更。
数 量Quantity
金額(千円)
Value(Thousand Yen)
生 産 数 量ProductionQuantity
受 入 数 量ReceiptQuantity
消 費 数 量Consumption
Quantity
販 売 Sales
出 荷 数 量 Shipments Quantity
在 庫 数 量InventoryQuantity
年 月
6. 継 手 Plastic pipe fittings
Year andMonthそ の 他
OthersQuantity
数 量Quantity
金額(千円)
Value(Thousand Yen)
生 産 数 量ProductionQuantity
受 入 数 量ReceiptQuantity
消 費 数 量Consumption
Quantity
出 荷 数 量 Shipments Quantity在 庫 数 量InventoryQuantity
年 月
5. パ イ プ Plastic pipes
Year andMonth
販 売 Sales そ の 他Others
Quantity

- 76 -
(2)製品時系列表(つづき) Historical Data by Commodity (continued) 単位 : t / Unit : t
平成 25 年 678,648 149,480 49,387 764,618 1,234,966,368 16,223 13,796 C.Y. 201326 644,768 143,815 47,810 727,730 1,225,754,612 15,627 12,261 C.Y. 201427 629,166 139,366 46,665 706,566 1,192,875,936 14,767 13,013 C.Y. 201528 645,925 132,206 49,094 715,360 1,188,467,490 12,875 12,722 C.Y. 201629 672,089 143,587 51,291 748,207 1,264,576,687 13,521 13,941 C.Y. 2017
平成 27 年度 630,546 136,826 47,431 705,332 1,179,181,317 14,197 12,266 F.Y. 201528 654,055 134,968 50,077 724,644 1,204,032,715 12,729 12,732 F.Y. 2016
29 年 1~3月 169,176 35,674 12,846 188,537 313,523,098 3,227 12,732 Q1 20174~6月 164,297 34,667 12,860 181,949 307,794,639 3,360 12,979 Q27~9月 165,278 35,277 12,632 183,753 313,457,968 3,353 13,333 Q310~12月 173,338 37,969 12,953 193,968 329,800,982 3,581 13,941 Q4
29 年 1月 52,226 10,945 3,924 58,108 97,511,644 1,012 12,832 Jan. 20172月 56,485 11,976 4,307 63,085 104,361,112 1,006 12,667 Feb.3月 60,465 12,753 4,615 67,344 111,650,342 1,209 12,732 Mar.4月 56,192 11,974 4,224 62,456 104,463,538 1,120 12,734 Apr.5月 50,050 10,523 3,937 55,425 93,580,757 1,025 12,674 May 6月 58,055 12,170 4,699 64,068 109,750,344 1,215 12,979 Jun.7月 57,705 12,122 4,476 63,704 107,794,589 1,174 13,360 Jul.8月 49,845 10,968 3,763 55,929 96,081,684 1,038 13,286 Aug.9月 57,728 12,187 4,393 64,120 109,581,695 1,141 13,333 Sep.10月 58,672 12,645 4,418 65,297 111,391,826 1,200 13,667 Oct.11月 58,812 12,886 4,412 65,802 110,901,753 1,210 13,647 Nov.12月 55,854 12,438 4,123 62,869 107,507,403 1,171 13,941 Dec.
*平成26年調査より調査対象規模を40人以上から50人以上の事業所へ変更。
単位 : t / Unit : t
平成 25 年 485,251 110,483 32,675 549,898 867,593,545 12,178 7,288 C.Y. 201326 476,051 108,977 30,851 541,806 879,366,464 11,955 6,451 C.Y. 201427 462,999 106,355 29,725 525,569 852,165,150 11,004 7,125 C.Y. 201528 483,702 102,590 32,054 539,484 851,317,888 10,805 7,224 C.Y. 201629 505,463 112,154 34,191 568,530 911,501,320 11,452 7,500 C.Y. 2017
平成 27 年度 465,581 104,724 30,175 526,227 842,234,869 10,804 7,050 F.Y. 201528 489,156 104,342 32,756 545,668 860,506,841 10,824 7,116 F.Y. 2016
29 年 1~3月 127,111 27,628 8,648 142,624 225,575,791 2,776 7,116 Q1 20174~6月 121,999 26,742 8,373 136,589 219,397,228 2,834 7,200 Q27~9月 124,131 27,635 8,261 139,569 225,664,698 2,816 7,481 Q310~12月 132,222 30,149 8,909 149,748 240,863,603 3,026 7,500 Q4
29 年 1月 39,001 8,362 2,644 43,701 70,052,110 855 7,101 Jan. 20172月 42,539 9,211 2,862 47,806 74,760,961 897 7,003 Feb.3月 45,571 10,055 3,142 51,117 80,762,720 1,024 7,116 Mar.4月 42,035 9,439 2,824 47,316 75,002,697 943 7,074 Apr.5月 36,842 8,032 2,550 41,207 65,849,508 864 7,033 May 6月 43,122 9,271 2,999 48,066 78,545,023 1,027 7,200 Jun.7月 43,111 9,375 2,906 48,062 77,524,541 980 7,419 Jul.8月 37,018 8,542 2,427 42,029 67,913,872 871 7,505 Aug.9月 44,002 9,718 2,928 49,478 80,226,285 965 7,481 Sep.10月 44,698 9,970 2,976 50,289 81,538,690 1,020 7,626 Oct.11月 45,104 10,277 3,023 51,016 81,182,165 1,023 7,579 Nov.12月 42,420 9,902 2,910 48,443 78,142,748 983 7,500 Dec.
*平成26年調査より調査対象規模を40人以上から50人以上の事業所へ変更。
数 量Quantity
金額(千円)
Value(Thousand Yen)
販 売 Salesそ の 他Others
Quantity
年 月
(5) 輸送機械用部品 Plastic transport
Year andMonth
生 産 数 量ProductionQuantity
受 入 数 量ReceiptQuantity
消 費 数 量Consumption
Quantity
出 荷 数 量 Shipments Quantity
在 庫 数 量InventoryQuantity
数 量Quantity
金額(千円)
Value(Thousand Yen)
販 売 Sales そ の 他Others
Quantity
Year andMonth
年 月
7.機械器具部品(照明用品を含む) (5)~(7) Plastic products for machine tools and parts (including lighting equipment)
生 産 数 量ProductionQuantity
受 入 数 量ReceiptQuantity
消 費 数 量Consumption
Quantity
出 荷 数 量 Shipments Quantity在 庫 数 量InventoryQuantity
- 77 -
(2)製品時系列表(つづき) Historical Data by Commodity (continued) 単位 : t / Unit : t
平成 25 年 140,425 24,335 15,011 148,474 243,269,354 1,048 4,201 C.Y. 201326 118,570 20,457 15,199 121,867 226,287,102 1,510 3,822 C.Y. 201427 114,783 18,786 15,216 116,649 219,029,703 1,515 3,853 C.Y. 201528 112,949 19,390 15,444 115,350 216,523,785 1,242 3,444 C.Y. 201629 115,038 19,820 15,494 115,727 222,359,399 1,302 4,307 C.Y. 2017
平成 27 年度 114,535 18,809 15,555 116,191 216,725,672 1,480 3,434 F.Y. 201528 114,207 19,686 15,709 116,357 219,224,386 1,136 3,585 F.Y. 2016
29 年 1~3月 28,721 4,897 3,812 29,179 55,224,158 260 3,585 Q1 20174~6月 29,507 4,981 4,058 29,487 55,748,423 331 3,703 Q27~9月 28,711 4,921 3,935 28,729 55,684,989 343 3,970 Q310~12月 28,099 5,021 3,689 28,332 55,701,829 368 4,307 Q4
29 年 1月 8,993 1,548 1,189 9,154 17,276,631 98 3,472 Jan. 20172月 9,540 1,665 1,302 9,678 18,513,160 45 3,510 Feb.3月 10,188 1,684 1,321 10,347 19,434,367 117 3,585 Mar.4月 9,753 1,612 1,256 9,825 18,499,145 112 3,523 Apr.5月 9,229 1,603 1,261 9,288 17,521,343 97 3,544 May 6月 10,525 1,766 1,541 10,374 19,727,935 122 3,703 Jun.7月 10,231 1,697 1,402 10,100 19,070,173 129 3,912 Jul.8月 8,979 1,636 1,207 9,185 18,132,433 104 3,920 Aug.9月 9,501 1,588 1,326 9,444 18,482,383 110 3,970 Sep.10月 9,517 1,695 1,322 9,541 18,698,519 115 4,076 Oct.11月 9,383 1,678 1,269 9,507 18,545,816 123 4,063 Nov.12月 9,199 1,648 1,098 9,284 18,457,494 130 4,307 Dec.
*平成26年調査より調査対象規模を40人以上から50人以上の事業所へ変更。
単位 : t / Unit : t
平成 25 年 52,972 14,662 1,701 66,246 124,103,469 2,997 2,307 C.Y. 201326 50,147 14,381 1,760 64,057 120,101,046 2,162 1,988 C.Y. 201427 51,384 14,225 1,724 64,348 121,681,083 2,248 2,035 C.Y. 201528 49,274 10,226 1,596 60,526 120,625,817 828 2,054 C.Y. 201629 51,588 11,613 1,606 63,950 130,715,968 767 2,134 C.Y. 2017
平成 27 年度 50,430 13,293 1,701 62,914 120,220,776 1,913 1,782 F.Y. 201528 50,692 10,940 1,612 62,619 124,301,488 769 2,031 F.Y. 2016
29 年 1~3月 13,344 3,149 386 16,734 32,723,149 191 2,031 Q1 20174~6月 12,791 2,944 429 15,873 32,648,988 195 2,076 Q27~9月 12,436 2,721 436 15,455 32,108,281 194 1,882 Q310~12月 13,017 2,799 355 15,888 33,235,550 187 2,134 Q4
29 年 1月 4,232 1,035 91 5,253 10,182,903 59 2,259 Jan. 20172月 4,406 1,100 143 5,601 11,086,991 64 2,154 Feb.3月 4,706 1,014 152 5,880 11,453,255 68 2,031 Mar.4月 4,404 923 144 5,315 10,961,696 65 2,137 Apr.5月 3,979 888 126 4,930 10,209,906 64 2,097 May 6月 4,408 1,133 159 5,628 11,477,386 66 2,076 Jun.7月 4,363 1,050 168 5,542 11,199,875 65 2,029 Jul.8月 3,848 790 129 4,715 10,035,379 63 1,861 Aug.9月 4,225 881 139 5,198 10,873,027 66 1,882 Sep.10月 4,457 980 120 5,467 11,154,617 65 1,965 Oct.11月 4,325 931 120 5,279 11,173,772 64 2,005 Nov.12月 4,235 888 115 5,142 10,907,161 58 2,134 Dec.
*平成26年調査より調査対象規模を40人以上から50人以上の事業所へ変更。
販 売 Salesそ の 他Others
Quantity
在 庫 数 量InventoryQuantity
数 量Quantity
金額(千円)
Value(Thousand Yen)
(7) その他の部品 Other plastic products for machine tools and parts
出 荷 数 量 Shipments QuantityYear andMonth
生 産 数 量ProductionQuantity
受 入 数 量ReceiptQuantity
消 費 数 量Consumption
Quantity
年 月
販 売 Sales そ の 他Others
Quantity
出 荷 数 量 Shipments Quantity在 庫 数 量InventoryQuantity
数 量Quantity
金額(千円)
Value(Thousand Yen)
消 費 数 量Consumption
Quantity
年 月
(6) 電気通信用部品 Electronic communication equipment parts
Year andMonth
生 産 数 量ProductionQuantity
受 入 数 量ReceiptQuantity

- 78 -
(2)製品時系列表(つづき) Historical Data by Commodity (continued) 単位 : t / Unit : t
平成 25 年 297,110 31,615 1,589 306,334 265,105,408 17,718 20,574 C.Y. 201326 291,262 27,503 1,537 296,026 261,680,204 16,557 17,935 C.Y. 201427 289,613 28,177 3,608 299,531 259,317,284 13,569 17,365 C.Y. 201528 298,382 30,711 2,878 309,157 271,704,060 16,120 18,060 C.Y. 201629 301,609 32,561 1,453 311,467 285,339,992 18,907 21,914 C.Y. 2017
平成 27 年度 294,827 28,793 3,784 303,097 261,667,099 13,613 18,066 F.Y. 201528 299,844 31,159 2,227 310,963 275,460,483 17,290 19,069 F.Y. 2016
29 年 1~3月 74,311 7,721 343 76,532 68,532,771 4,469 19,069 Q1 20174~6月 77,215 8,363 394 79,952 72,210,726 4,568 20,087 Q27~9月 72,784 7,762 366 74,886 70,169,403 4,599 21,335 Q310~12月 77,299 8,715 350 80,097 74,427,092 5,271 21,914 Q4
29 年 1月 23,248 2,305 93 23,507 20,407,950 1,459 18,768 Jan. 20172月 24,112 2,479 121 24,303 21,961,526 1,416 19,567 Feb.3月 26,951 2,937 129 28,722 26,163,295 1,594 19,069 Mar.4月 27,472 2,915 124 29,123 25,429,877 1,464 19,101 Apr.5月 25,231 2,795 121 26,049 22,909,409 1,564 19,435 May 6月 24,512 2,653 149 24,780 23,871,440 1,540 20,087 Jun.7月 24,779 2,570 128 25,395 23,909,670 1,417 20,883 Jul.8月 23,014 2,487 107 24,281 22,983,936 1,559 20,474 Aug.9月 24,991 2,705 131 25,210 23,275,797 1,623 21,335 Sep.10月 26,105 2,976 136 27,048 24,667,092 1,816 21,683 Oct.11月 26,238 2,963 120 26,614 24,680,202 1,742 22,188 Nov.12月 24,956 2,776 94 26,435 25,079,798 1,713 21,914 Dec.
*平成26年調査より調査対象規模を40人以上から50人以上の事業所へ変更。
単位 : t / Unit : t
平成 25 年 803,138 127,594 85 815,995 441,420,004 107,039 38,980 C.Y. 201326 782,047 123,779 84 807,236 431,498,014 95,798 36,849 C.Y. 201427 770,252 107,418 84 789,049 419,458,148 87,295 36,467 C.Y. 201528 783,460 99,458 84 812,847 427,010,043 67,717 35,602 C.Y. 201629 830,754 99,637 84 857,665 438,887,281 66,059 39,838 C.Y. 2017
平成 27 年度 768,210 109,359 84 785,019 420,005,537 86,333 42,937 F.Y. 201528 794,788 96,008 84 826,716 429,359,284 64,125 39,555 F.Y. 2016
29 年 1~3月 189,297 23,205 21 192,673 100,665,595 14,847 39,555 Q1 20174~6月 220,243 26,703 21 225,097 113,427,502 19,233 41,977 Q27~9月 215,278 27,230 21 223,571 113,287,945 18,737 41,478 Q310~12月 205,936 22,499 21 216,324 111,506,239 13,242 39,838 Q4
29 年 1月 56,335 6,995 7 57,724 29,678,354 3,975 36,334 Jan. 20172月 60,984 7,587 7 61,727 32,561,712 4,822 38,374 Feb.3月 71,978 8,623 7 73,222 38,425,529 6,050 39,555 Mar.4月 71,448 8,265 7 72,614 36,548,707 5,518 41,154 Apr.5月 70,147 9,274 7 71,268 37,523,691 6,911 42,152 May 6月 78,648 9,164 7 81,215 39,355,104 6,804 41,977 Jun.7月 78,316 10,063 7 80,509 39,628,008 7,663 42,032 Jul.8月 66,307 8,903 7 70,380 37,084,903 6,435 40,022 Aug.9月 70,655 8,264 7 72,682 36,575,034 4,639 41,478 Sep.10月 70,403 7,327 7 71,746 36,096,119 4,215 42,916 Oct.11月 69,003 8,054 7 73,203 38,401,594 4,881 41,902 Nov.12月 66,530 7,118 7 71,375 37,008,526 4,146 39,838 Dec.
*平成26年調査より調査対象規模を40人以上から50人以上の事業所へ変更。
数 量Quantity
金額(千円)
Value(Thousand Yen)
販 売 Salesそ の 他Others
Quantity
在 庫 数 量InventoryQuantity
年 月
9. 容 器 (8)~(9) Plastic containers
Year andMonth
生 産 数 量ProductionQuantity
受 入 数 量ReceiptQuantity
消 費 数 量Consumption
Quantity
出 荷 数 量 Shipments Quantity
数 量Quantity
金額(千円)
Value(Thousand Yen)
在 庫 数 量InventoryQuantity
販 売 Sales そ の 他Others
Quantity
生 産 数 量ProductionQuantity
受 入 数 量ReceiptQuantity
消 費 数 量Consumption
Quantity
出 荷 数 量 Shipments Quantity
年 月
8.日用品・雑貨 Plastic products for daily necessaries and miscellaneous goods
Year andMonth
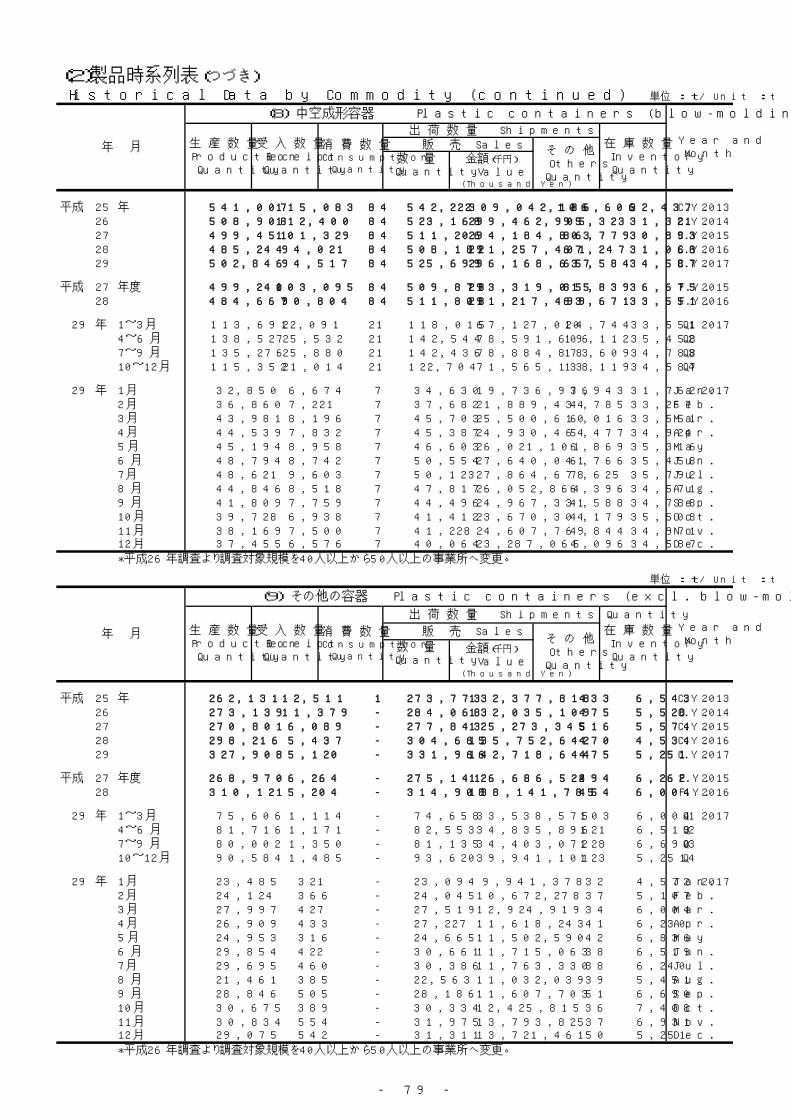
- 79 -
(2)製品時系列表(つづき) Historical Data by Commodity (continued) 単位 : t / Unit : t
平成 25 年 541,007 115,083 84 542,222 309,042,186 106,606 32,437 C.Y. 201326 508,908 112,400 84 523,168 299,462,905 95,323 31,321 C.Y. 201427 499,451 101,329 84 511,206 294,184,803 86,779 30,893 C.Y. 201528 485,244 94,021 84 508,182 291,257,401 67,247 31,068 C.Y. 201629 502,846 94,517 84 525,699 296,168,637 65,584 34,587 C.Y. 2017
平成 27 年度 499,240 103,095 84 509,878 293,319,015 85,839 36,675 F.Y. 201528 484,667 90,804 84 511,808 291,217,499 63,671 33,551 F.Y. 2016
29 年 1~3月 113,691 22,091 21 118,015 67,127,020 14,744 33,551 Q1 20174~6月 138,527 25,532 21 142,544 78,591,606 19,112 35,458 Q27~9月 135,276 25,880 21 142,436 78,884,873 18,609 34,788 Q310~12月 115,352 21,014 21 122,704 71,565,138 13,119 34,587 Q4
29 年 1月 32,850 6,674 7 34,630 19,736,976 3,943 31,762 Jan. 20172月 36,860 7,221 7 37,682 21,889,434 4,785 33,267 Feb.3月 43,981 8,196 7 45,703 25,500,610 6,016 33,551 Mar.4月 44,539 7,832 7 45,387 24,930,464 5,477 34,924 Apr.5月 45,194 8,958 7 46,603 26,021,101 6,869 35,316 May 6月 48,794 8,742 7 50,554 27,640,041 6,766 35,458 Jun.7月 48,621 9,603 7 50,123 27,864,678 7,625 35,792 Jul.8月 44,846 8,518 7 47,817 26,052,864 6,396 34,571 Aug.9月 41,809 7,759 7 44,496 24,967,331 4,588 34,788 Sep.10月 39,728 6,938 7 41,412 23,670,304 4,179 35,508 Oct.11月 38,169 7,500 7 41,228 24,607,769 4,844 34,971 Nov.12月 37,455 6,576 7 40,064 23,287,065 4,096 34,587 Dec.
*平成26年調査より調査対象規模を40人以上から50人以上の事業所へ変更。
単位 : t / Unit : t
平成 25 年 262,131 12,511 1 273,773 132,377,818 433 6,543 C.Y. 201326 273,139 11,379 - 284,068 132,035,109 475 5,528 C.Y. 201427 270,801 6,089 - 277,843 125,273,345 516 5,574 C.Y. 201528 298,216 5,437 - 304,665 135,752,642 470 4,534 C.Y. 201629 327,908 5,120 - 331,966 142,718,644 475 5,251 C.Y. 2017
平成 27 年度 268,970 6,264 - 275,141 126,686,522 494 6,262 F.Y. 201528 310,121 5,204 - 314,908 138,141,785 454 6,004 F.Y. 2016
29 年 1~3月 75,606 1,114 - 74,658 33,538,575 103 6,004 Q1 20174~6月 81,716 1,171 - 82,553 34,835,896 121 6,519 Q27~9月 80,002 1,350 - 81,135 34,403,072 128 6,690 Q310~12月 90,584 1,485 - 93,620 39,941,101 123 5,251 Q4
29 年 1月 23,485 321 - 23,094 9,941,378 32 4,572 Jan. 20172月 24,124 366 - 24,045 10,672,278 37 5,107 Feb.3月 27,997 427 - 27,519 12,924,919 34 6,004 Mar.4月 26,909 433 - 27,227 11,618,243 41 6,230 Apr.5月 24,953 316 - 24,665 11,502,590 42 6,836 May 6月 29,854 422 - 30,661 11,715,063 38 6,519 Jun.7月 29,695 460 - 30,386 11,763,330 38 6,240 Jul.8月 21,461 385 - 22,563 11,032,039 39 5,451 Aug.9月 28,846 505 - 28,186 11,607,703 51 6,690 Sep.10月 30,675 389 - 30,334 12,425,815 36 7,408 Oct.11月 30,834 554 - 31,975 13,793,825 37 6,931 Nov.12月 29,075 542 - 31,311 13,721,461 50 5,251 Dec.
*平成26年調査より調査対象規模を40人以上から50人以上の事業所へ変更。
数 量Quantity
金額(千円)
Value(Thousand Yen)
生 産 数 量ProductionQuantity
受 入 数 量ReceiptQuantity
消 費 数 量Consumption
Quantity
販 売 Salesそ の 他Others
Quantity
出 荷 数 量 Shipments Quantity
在 庫 数 量InventoryQuantity
年 月
(9) その他の容器 Plastic containers (excl. blow-molding)
Year andMonth
数 量Quantity
金額(千円)
Value(Thousand Yen)
生 産 数 量ProductionQuantity
受 入 数 量ReceiptQuantity
消 費 数 量Consumption
Quantity
販 売 Sales そ の 他Others
Quantity
出 荷 数 量 Shipments Quantity在 庫 数 量InventoryQuantity
年 月
(8) 中空成形容器 Plastic containers (blow-molding)
Year andMonth

- 80 -
(2)製品時系列表(つづき) Historical Data by Commodity (continued) 単位 : t / Unit : t
平成 25 年 305,268 11,759 1,167 310,767 143,293,482 3,302 27,059 C.Y. 201326 312,066 11,493 1,165 315,582 158,268,324 3,594 29,024 C.Y. 201427 296,556 10,360 1,164 303,461 144,537,680 2,126 28,067 C.Y. 201528 293,869 9,142 1,164 301,564 146,099,268 1,654 26,086 C.Y. 201629 283,809 9,908 1,164 289,442 144,445,456 3,451 25,475 C.Y. 2017
平成 27 年度 298,260 9,706 1,164 305,686 146,489,618 1,914 25,854 F.Y. 201528 289,744 9,483 1,164 296,966 145,137,205 1,504 24,894 F.Y. 2016
29 年 1~3月 70,855 2,591 291 73,776 35,893,851 376 24,894 Q1 20174~6月 71,465 2,261 291 71,411 35,871,891 238 26,698 Q27~9月 70,427 2,401 291 70,918 35,272,017 327 27,965 Q310~12月 71,062 2,655 291 73,337 37,407,697 2,510 25,475 Q4
29 年 1月 21,566 666 97 22,094 10,873,653 108 25,942 Jan. 20172月 23,868 1,089 97 24,662 11,883,066 128 25,959 Feb.3月 25,421 836 97 27,020 13,137,132 140 24,894 Mar.4月 23,781 827 97 24,499 11,550,527 120 24,724 Apr.5月 22,190 769 97 22,467 11,552,437 101 25,039 May 6月 25,494 665 97 24,445 12,768,927 17 26,698 Jun.7月 24,418 718 97 23,857 12,009,046 159 27,669 Jul.8月 20,829 879 97 21,642 11,073,278 137 27,538 Aug.9月 25,180 804 97 25,419 12,189,693 31 27,965 Sep.10月 24,376 921 97 24,813 12,337,297 254 28,051 Oct.11月 23,499 847 97 24,543 12,756,634 112 27,604 Nov.12月 23,187 887 97 23,981 12,313,766 2,144 25,475 Dec.
*平成26年調査より調査対象規模を40人以上から50人以上の事業所へ変更。
単位 : t / Unit : t
平成 25 年 31,191 4,870 3 35,287 37,360,976 372 2,025 C.Y. 201326 35,767 3,547 - 39,084 43,514,219 362 1,905 C.Y. 201427 28,710 1,404 - 29,860 29,772,619 274 1,727 C.Y. 201528 30,305 1,309 - 31,176 31,424,695 260 1,930 C.Y. 201629 29,191 2,693 - 31,637 32,637,538 281 1,877 C.Y. 2017
平成 27 年度 29,696 1,289 - 30,610 30,514,398 263 1,847 F.Y. 201528 30,239 1,622 - 31,494 31,835,060 269 1,826 F.Y. 2016
29 年 1~3月 7,527 571 - 8,023 7,960,830 74 1,826 Q1 20174~6月 7,528 525 - 7,928 8,102,565 65 1,982 Q27~9月 6,939 755 - 7,640 7,936,239 67 1,962 Q310~12月 7,197 842 - 8,046 8,637,904 75 1,877 Q4
29 年 1月 2,426 70 - 2,336 2,258,636 22 2,063 Jan. 20172月 2,276 266 - 2,631 2,616,104 25 1,948 Feb.3月 2,825 235 - 3,056 3,086,090 27 1,826 Mar.4月 2,377 165 - 2,543 2,574,372 23 1,900 Apr.5月 2,390 177 - 2,532 2,604,322 25 1,910 May 6月 2,761 183 - 2,853 2,923,871 17 1,982 Jun.7月 2,492 234 - 2,566 2,690,778 21 2,115 Jul.8月 1,863 243 - 2,290 2,534,666 20 1,911 Aug.9月 2,584 278 - 2,784 2,710,795 26 1,962 Sep.10月 2,500 274 - 2,610 2,629,274 27 2,099 Oct.11月 2,231 280 - 2,732 3,108,528 23 1,855 Nov.12月 2,466 288 - 2,704 2,900,102 25 1,877 Dec.
*平成26年調査より調査対象規模を40人以上から50人以上の事業所へ変更。
数 量Quantity
金額(千円)
Value(Thousand Yen)
販 売 Salesそ の 他Others
Quantity
在 庫 数 量InventoryQuantity
年 月
(10) 雨どい及び同付属品 Rainwater pipe and attachment
Year andMonth
生 産 数 量ProductionQuantity
受 入 数 量ReceiptQuantity
消 費 数 量Consumption
Quantity
出 荷 数 量 Shipments Quantity
数 量Quantity
金額(千円)
Value(Thousand Yen)
そ の 他Others
Quantity
販 売 Sales 在 庫 数 量InventoryQuantity
生 産 数 量ProductionQuantity
受 入 数 量ReceiptQuantity
年 月
10.建 材 (10)~(12) Plastic material for building (construction)
Year andMonth
消 費 数 量Consumption
Quantity
出 荷 数 量 Shipments Quantity
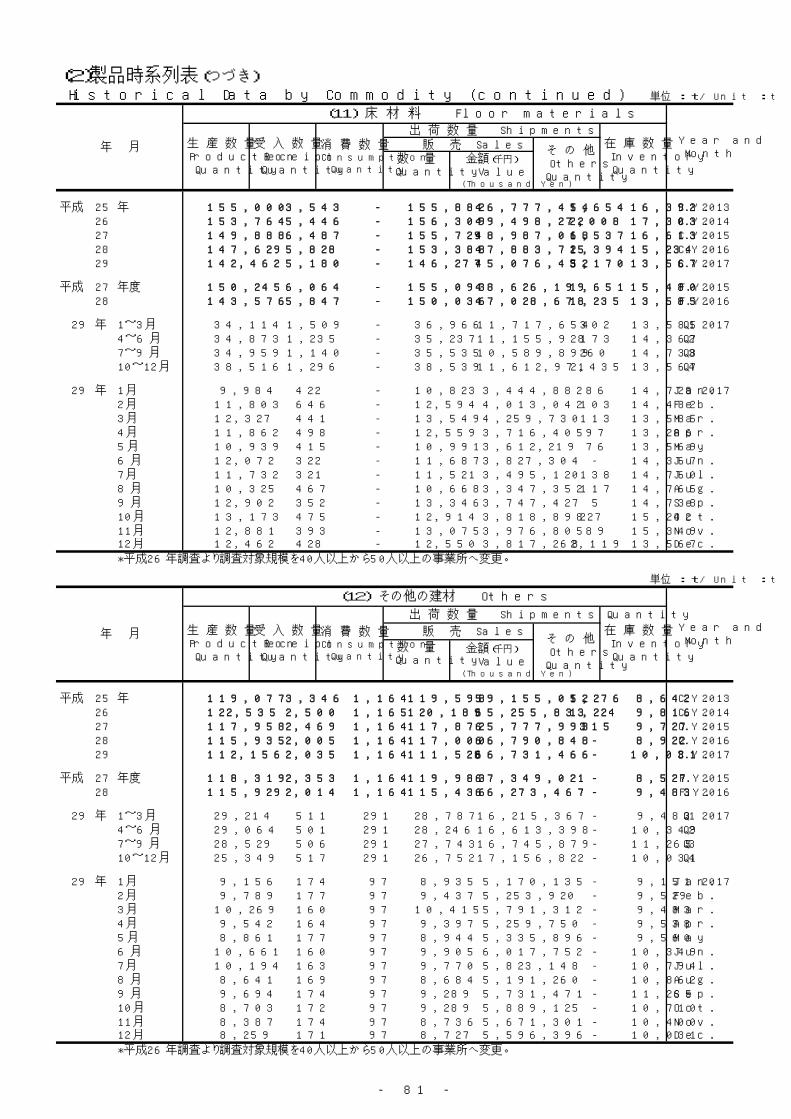
- 81 -
(2)製品時系列表(つづき) Historical Data by Commodity (continued) 単位 : t / Unit : t
平成 25 年 155,000 3,543 - 155,882 46,777,454 1,654 16,392 C.Y. 201326 153,764 5,446 - 156,309 49,498,272 2,008 17,303 C.Y. 201427 149,888 6,487 - 155,729 48,987,068 1,537 16,613 C.Y. 201528 147,629 5,828 - 153,388 47,883,725 1,394 15,234 C.Y. 201629 142,462 5,180 - 146,277 45,076,452 3,170 13,567 C.Y. 2017
平成 27 年度 150,245 6,064 - 155,093 48,626,199 1,651 15,480 F.Y. 201528 143,576 5,847 - 150,036 47,028,678 1,235 13,585 F.Y. 2016
29 年 1~3月 34,114 1,509 - 36,966 11,717,654 302 13,585 Q1 20174~6月 34,873 1,235 - 35,237 11,155,928 173 14,367 Q27~9月 34,959 1,140 - 35,535 10,589,899 260 14,738 Q310~12月 38,516 1,296 - 38,539 11,612,971 2,435 13,567 Q4
29 年 1月 9,984 422 - 10,823 3,444,882 86 14,728 Jan. 20172月 11,803 646 - 12,594 4,013,042 103 14,482 Feb.3月 12,327 441 - 13,549 4,259,730 113 13,585 Mar.4月 11,862 498 - 12,559 3,716,405 97 13,286 Apr.5月 10,939 415 - 10,991 3,612,219 76 13,569 May 6月 12,072 322 - 11,687 3,827,304 - 14,367 Jun.7月 11,732 321 - 11,521 3,495,120 138 14,760 Jul.8月 10,325 467 - 10,668 3,347,352 117 14,765 Aug.9月 12,902 352 - 13,346 3,747,427 5 14,738 Sep.10月 13,173 475 - 12,914 3,818,898 227 15,242 Oct.11月 12,881 393 - 13,075 3,976,805 89 15,349 Nov.12月 12,462 428 - 12,550 3,817,268 2,119 13,567 Dec.
*平成26年調査より調査対象規模を40人以上から50人以上の事業所へ変更。
単位 : t / Unit : t
平成 25 年 119,077 3,346 1,164 119,598 59,155,052 1,276 8,642 C.Y. 201326 122,535 2,500 1,165 120,189 65,255,833 1,224 9,816 C.Y. 201427 117,958 2,469 1,164 117,872 65,777,993 315 9,727 C.Y. 201528 115,935 2,005 1,164 117,000 66,790,848 - 8,922 C.Y. 201629 112,156 2,035 1,164 111,528 66,731,466 - 10,031 C.Y. 2017
平成 27 年度 118,319 2,353 1,164 119,983 67,349,021 - 8,527 F.Y. 201528 115,929 2,014 1,164 115,436 66,273,467 - 9,483 F.Y. 2016
29 年 1~3月 29,214 511 291 28,787 16,215,367 - 9,483 Q1 20174~6月 29,064 501 291 28,246 16,613,398 - 10,349 Q27~9月 28,529 506 291 27,743 16,745,879 - 11,265 Q310~12月 25,349 517 291 26,752 17,156,822 - 10,031 Q4
29 年 1月 9,156 174 97 8,935 5,170,135 - 9,151 Jan. 20172月 9,789 177 97 9,437 5,253,920 - 9,529 Feb.3月 10,269 160 97 10,415 5,791,312 - 9,483 Mar.4月 9,542 164 97 9,397 5,259,750 - 9,538 Apr.5月 8,861 177 97 8,944 5,335,896 - 9,560 May 6月 10,661 160 97 9,905 6,017,752 - 10,349 Jun.7月 10,194 163 97 9,770 5,823,148 - 10,794 Jul.8月 8,641 169 97 8,684 5,191,260 - 10,862 Aug.9月 9,694 174 97 9,289 5,731,471 - 11,265 Sep.10月 8,703 172 97 9,289 5,889,125 - 10,710 Oct.11月 8,387 174 97 8,736 5,671,301 - 10,400 Nov.12月 8,259 171 97 8,727 5,596,396 - 10,031 Dec.
*平成26年調査より調査対象規模を40人以上から50人以上の事業所へ変更。
在 庫 数 量InventoryQuantity
販 売 Salesそ の 他Others
Quantity
数 量Quantity
生 産 数 量ProductionQuantity
受 入 数 量ReceiptQuantity
消 費 数 量Consumption
Quantity
出 荷 数 量 Shipments Quantity
金額(千円)
Value(Thousand Yen)
年 月
(12) その他の建材 Others
Year andMonth
在 庫 数 量InventoryQuantity
販 売 Sales そ の 他Others
Quantity
数 量Quantity
出 荷 数 量 Shipments Quantity
金額(千円)
Value(Thousand Yen)
生 産 数 量ProductionQuantity
受 入 数 量ReceiptQuantity
消 費 数 量Consumption
Quantity
年 月
(11) 床 材 料 Floor materials
Year andMonth

- 82 -
(2)製品時系列表(つづき) Historical Data by Commodity (continued) 単位 : t / Unit : t
平成 25 年 276,250 53,659 17,217 299,872 181,865,517 10,613 23,981 C.Y. 201326 250,646 53,601 17,226 276,155 175,624,240 10,229 22,369 C.Y. 201427 248,548 52,357 16,342 270,839 171,658,174 11,503 24,224 C.Y. 201528 251,038 55,681 16,239 278,592 171,661,786 12,738 23,956 C.Y. 201629 249,400 57,723 16,791 274,179 169,386,147 15,086 24,649 C.Y. 2017
平成 27 年度 249,715 53,846 16,589 273,216 171,400,605 11,919 23,771 F.Y. 201528 251,528 54,691 16,193 277,629 170,561,429 12,840 22,866 F.Y. 2016
29 年 1~3月 59,211 12,361 3,838 65,161 40,159,385 2,988 22,866 Q1 20174~6月 61,542 14,831 4,103 67,944 41,704,238 4,172 23,405 Q27~9月 61,944 13,679 4,030 67,326 42,239,007 3,812 23,835 Q310~12月 66,703 16,852 4,820 73,748 45,283,517 4,114 24,649 Q4
29 年 1月 18,925 3,794 1,173 20,898 12,956,734 1,041 22,795 Jan. 20172月 19,789 4,020 1,284 21,347 13,110,275 913 23,095 Feb.3月 20,497 4,547 1,381 22,916 14,092,376 1,034 22,866 Mar.4月 20,466 4,714 1,474 22,720 14,170,875 919 22,960 Apr.5月 20,284 5,555 1,267 22,315 13,217,094 937 24,291 May 6月 20,792 4,562 1,362 22,909 14,316,269 2,316 23,405 Jun.7月 21,496 4,495 1,334 22,743 14,332,658 1,259 24,057 Jul.8月 19,184 4,311 1,224 22,013 13,680,354 1,178 23,092 Aug.9月 21,264 4,873 1,472 22,570 14,225,995 1,375 23,835 Sep.10月 22,649 5,040 1,582 24,227 14,807,654 1,456 24,237 Oct.11月 22,878 4,979 1,686 24,748 15,154,731 1,371 24,307 Nov.12月 21,176 6,833 1,552 24,773 15,321,132 1,287 24,649 Dec.
*平成26年調査より調査対象規模を40人以上から50人以上の事業所へ変更。
単位 : t / Unit : t
平成 25 年 94,438 2,165 2,943 88,421 48,497,355 4,582 7,792 C.Y. 201326 80,180 1,953 3,019 75,089 43,228,222 4,327 6,538 C.Y. 201427 77,021 2,949 2,671 70,717 41,567,863 4,980 7,978 C.Y. 201528 75,674 4,212 2,916 73,100 41,423,830 5,596 6,488 C.Y. 201629 81,292 2,655 3,021 74,083 41,906,119 6,979 6,221 C.Y. 2017
平成 27 年度 75,422 3,646 2,715 70,923 41,323,658 5,400 6,788 F.Y. 201528 78,716 3,815 2,954 73,945 41,766,442 5,732 6,803 F.Y. 2016
29 年 1~3月 19,824 662 700 17,899 10,165,103 1,527 6,803 Q1 20174~6月 19,612 753 789 18,343 10,363,707 1,422 6,541 Q27~9月 20,732 590 715 18,322 10,316,996 2,023 6,778 Q310~12月 21,124 650 817 19,519 11,060,313 2,007 6,221 Q4
29 年 1月 6,293 224 216 5,996 3,398,610 528 6,258 Jan. 20172月 6,753 236 221 5,817 3,323,688 442 6,736 Feb.3月 6,778 202 263 6,086 3,442,805 557 6,803 Mar.4月 6,096 336 248 6,001 3,394,760 405 6,578 Apr.5月 6,865 225 247 6,039 3,405,785 472 6,850 May 6月 6,651 192 294 6,303 3,563,162 545 6,541 Jun.7月 7,369 189 251 6,432 3,609,877 686 6,738 Jul.8月 6,490 198 213 5,893 3,356,097 646 6,666 Aug.9月 6,873 203 251 5,997 3,351,022 691 6,778 Sep.10月 7,227 220 291 6,535 3,676,315 685 6,743 Oct.11月 7,269 216 287 6,792 3,872,363 619 6,517 Nov.12月 6,628 214 239 6,192 3,511,635 703 6,221 Dec.
*平成26年調査より調査対象規模を40人以上から50人以上の事業所へ変更。
数 量Quantity
金額(千円)
Value(Thousand Yen)
在 庫 数 量InventoryQuantity
販 売 Salesそ の 他Others
Quantity
年 月
(13) 板 物 Plastic foam plates
Year andMonth
生 産 数 量ProductionQuantity
受 入 数 量ReceiptQuantity
消 費 数 量Consumption
Quantity
出 荷 数 量 Shipments Quantity
在 庫 数 量InventoryQuantity
そ の 他Others
Quantity
数 量Quantity
金額(千円)
Value(Thousand Yen)
販 売 Sales生 産 数 量ProductionQuantity
受 入 数 量ReceiptQuantity
年 月
11. 発泡製品 (13)~(15) Plastic foam products
Year andMonth
消 費 数 量Consumption
Quantity
出 荷 数 量 Shipments Quantity

- 83 -
(2)製品時系列表(つづき) Historical Data by Commodity (continued) 単位 : t / Unit : t
平成 25 年 48,340 4,301 559 50,858 40,586,906 160 2,809 C.Y. 201326 39,950 3,213 553 41,998 37,124,948 115 2,319 C.Y. 201427 40,068 2,476 568 41,316 36,518,888 378 2,372 C.Y. 201528 38,765 3,486 545 41,344 35,493,065 24 2,617 C.Y. 201629 38,568 3,009 576 40,745 35,056,712 62 2,722 C.Y. 2017
平成 27 年度 39,445 2,674 560 41,003 35,978,649 265 2,363 F.Y. 201528 38,913 3,449 571 41,514 35,607,374 27 2,562 F.Y. 2016
29 年 1~3月 8,983 709 148 9,581 8,339,400 7 2,562 Q1 20174~6月 9,846 727 158 10,261 8,563,251 2 2,713 Q27~9月 9,682 747 135 10,277 8,924,600 16 2,686 Q310~12月 10,057 826 135 10,626 9,229,461 37 2,722 Q4
29 年 1月 2,760 201 40 2,972 2,579,922 2 2,562 Jan. 20172月 2,992 228 43 3,176 2,754,089 - 2,558 Feb.3月 3,231 280 65 3,433 3,005,389 5 2,562 Mar.4月 3,170 244 50 3,388 2,853,993 - 2,534 Apr.5月 3,256 249 50 3,356 2,689,683 2 2,638 May 6月 3,420 234 58 3,517 3,019,575 - 2,713 Jun.7月 3,344 211 47 3,533 3,031,681 6 2,661 Jul.8月 3,055 271 43 3,261 2,818,865 3 2,651 Aug.9月 3,283 265 45 3,483 3,074,054 7 2,686 Sep.10月 3,397 272 54 3,540 3,130,072 31 2,707 Oct.11月 3,312 258 45 3,453 2,998,869 1 2,785 Nov.12月 3,348 296 36 3,633 3,100,520 5 2,722 Dec.
*平成26年調査より調査対象規模を40人以上から50人以上の事業所へ変更。
単位 : t / Unit : t
平成 25 年 133,472 47,193 13,715 160,593 92,781,256 5,871 13,380 C.Y. 201326 130,516 48,435 13,654 159,068 95,271,070 5,787 13,512 C.Y. 201427 131,459 46,932 13,103 158,806 93,571,423 6,145 13,874 C.Y. 201528 136,599 47,983 12,778 164,148 94,744,891 7,118 14,851 C.Y. 201629 129,540 52,059 13,194 159,351 92,423,316 8,045 15,706 C.Y. 2017
平成 27 年度 134,848 47,526 13,314 161,290 94,098,298 6,254 14,620 F.Y. 201528 133,899 47,427 12,668 162,170 93,187,613 7,081 13,501 F.Y. 2016
29 年 1~3月 30,404 10,990 2,990 37,681 21,654,882 1,454 13,501 Q1 20174~6月 32,084 13,351 3,156 39,340 22,777,280 2,748 14,151 Q27~9月 31,530 12,342 3,180 38,727 22,997,411 1,773 14,371 Q310~12月 35,522 15,376 3,868 43,603 24,993,743 2,070 15,706 Q4
29 年 1月 9,872 3,369 917 11,930 6,978,202 511 13,975 Jan. 20172月 10,044 3,556 1,020 12,354 7,032,498 471 13,801 Feb.3月 10,488 4,065 1,053 13,397 7,644,182 472 13,501 Mar.4月 11,200 4,134 1,176 13,331 7,922,122 514 13,848 Apr.5月 10,163 5,081 970 12,920 7,121,626 463 14,803 May 6月 10,721 4,136 1,010 13,089 7,733,532 1,771 14,151 Jun.7月 10,783 4,095 1,036 12,778 7,691,100 567 14,658 Jul.8月 9,639 3,842 968 12,859 7,505,392 529 13,775 Aug.9月 11,108 4,405 1,176 13,090 7,800,919 677 14,371 Sep.10月 12,025 4,548 1,237 14,152 8,001,267 740 14,787 Oct.11月 12,297 4,505 1,354 14,503 8,283,499 751 15,005 Nov.12月 11,200 6,323 1,277 14,948 8,708,977 579 15,706 Dec.
*平成26年調査より調査対象規模を40人以上から50人以上の事業所へ変更。
数 量Quantity
金額(千円)
Value(Thousand Yen)
生 産 数 量ProductionQuantity
受 入 数 量ReceiptQuantity
消 費 数 量Consumption
Quantity
出 荷 数 量 Shipments Quantity
在 庫 数 量InventoryQuantity
販 売 Salesそ の 他Others
Quantity
年 月
(15) その他の発泡製品 Others
Year andMonth
生 産 数 量ProductionQuantity
受 入 数 量ReceiptQuantity
数 量Quantity
金額(千円)
Value(Thousand Yen)
消 費 数 量Consumption
Quantity
出 荷 数 量 Shipments Quantity在 庫 数 量InventoryQuantity
販 売 Sales そ の 他Others
Quantity
年 月
(14) 型 物 Plastic foam mould
Year andMonth
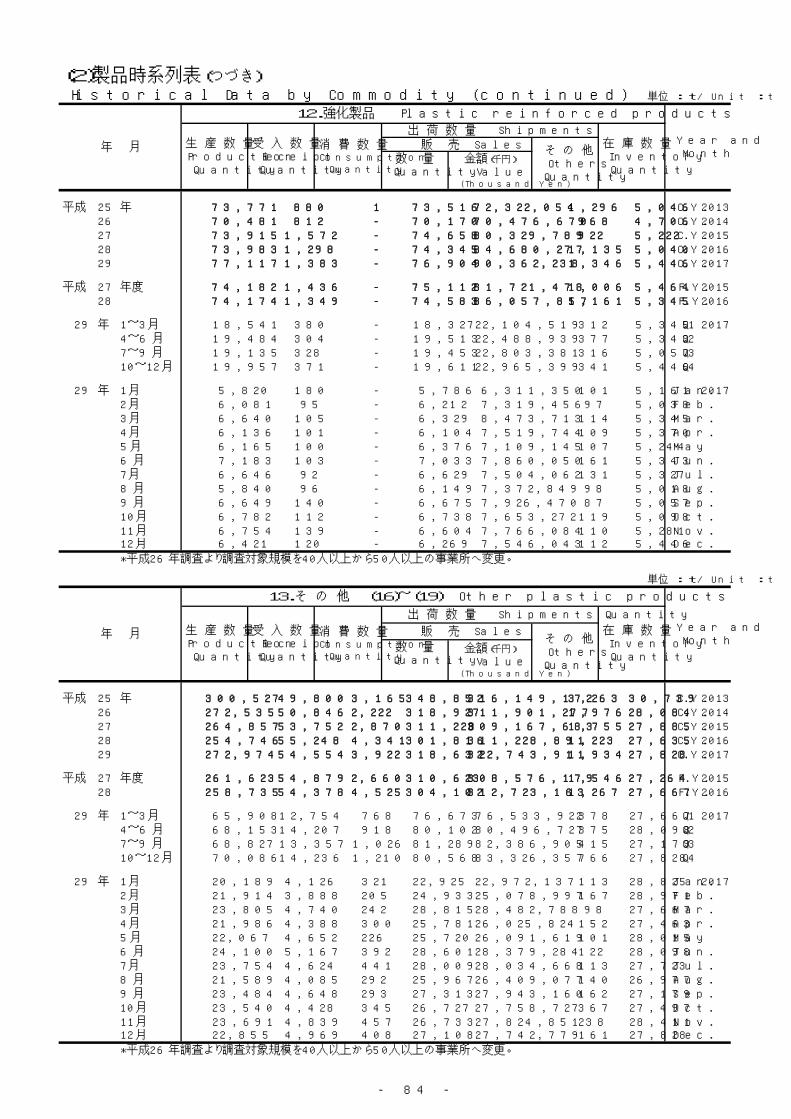
- 84 -
(2)製品時系列表(つづき) Historical Data by Commodity (continued) 単位 : t / Unit : t
平成 25 年 73,771 880 1 73,516 72,322,054 1,296 5,046 C.Y. 201326 70,481 812 - 70,170 70,476,670 968 4,706 C.Y. 201427 73,915 1,572 - 74,658 80,329,789 922 5,222 C.Y. 201528 73,983 1,298 - 74,345 84,680,277 1,135 5,040 C.Y. 201629 77,117 1,383 - 76,904 90,362,238 1,346 5,446 C.Y. 2017
平成 27 年度 74,182 1,436 - 75,112 81,721,478 1,006 5,464 F.Y. 201528 74,174 1,349 - 74,583 86,057,857 1,161 5,345 F.Y. 2016
29 年 1~3月 18,541 380 - 18,327 22,104,519 312 5,345 Q1 20174~6月 19,484 304 - 19,513 22,488,939 377 5,343 Q27~9月 19,135 328 - 19,453 22,803,381 316 5,057 Q310~12月 19,957 371 - 19,611 22,965,399 341 5,446 Q4
29 年 1月 5,820 180 - 5,786 6,311,350 101 5,161 Jan. 20172月 6,081 95 - 6,212 7,319,456 97 5,038 Feb.3月 6,640 105 - 6,329 8,473,713 114 5,345 Mar.4月 6,136 101 - 6,104 7,519,744 109 5,370 Apr.5月 6,165 100 - 6,376 7,109,145 107 5,244 May 6月 7,183 103 - 7,033 7,860,050 161 5,343 Jun.7月 6,646 92 - 6,629 7,504,062 131 5,327 Jul.8月 5,840 96 - 6,149 7,372,849 98 5,018 Aug.9月 6,649 140 - 6,675 7,926,470 87 5,057 Sep.10月 6,782 112 - 6,738 7,653,272 119 5,098 Oct.11月 6,754 139 - 6,604 7,766,084 110 5,281 Nov.12月 6,421 120 - 6,269 7,546,043 112 5,446 Dec.
*平成26年調査より調査対象規模を40人以上から50人以上の事業所へ変更。
単位 : t / Unit : t
平成 25 年 300,527 49,800 3,165 348,852 316,149,172 3,263 30,739 C.Y. 201326 272,535 50,846 2,222 318,927 311,901,277 1,976 28,084 C.Y. 201427 264,857 53,752 2,870 311,228 309,167,683 1,755 27,885 C.Y. 201528 254,746 55,248 4,341 301,816 311,228,891 1,223 27,635 C.Y. 201629 272,974 54,554 3,922 318,632 322,743,911 1,934 27,828 C.Y. 2017
平成 27 年度 261,623 54,879 2,660 310,623 308,576,179 1,546 27,264 F.Y. 201528 258,735 54,378 4,525 304,102 312,723,163 1,267 27,667 F.Y. 2016
29 年 1~3月 65,908 12,754 768 76,673 76,533,922 378 27,667 Q1 20174~6月 68,153 14,207 918 80,102 80,496,727 375 28,098 Q27~9月 68,827 13,357 1,026 81,289 82,386,905 415 27,179 Q310~12月 70,086 14,236 1,210 80,568 83,326,357 766 27,828 Q4
29 年 1月 20,189 4,126 321 22,925 22,972,137 113 28,825 Jan. 20172月 21,914 3,888 205 24,933 25,078,997 167 28,971 Feb.3月 23,805 4,740 242 28,815 28,482,788 98 27,667 Mar.4月 21,986 4,388 300 25,781 26,025,824 152 27,463 Apr.5月 22,067 4,652 226 25,720 26,091,619 101 28,015 May 6月 24,100 5,167 392 28,601 28,379,284 122 28,098 Jun.7月 23,754 4,624 441 28,009 28,034,668 113 27,723 Jul.8月 21,589 4,085 292 25,967 26,409,077 140 26,977 Aug.9月 23,484 4,648 293 27,313 27,943,160 162 27,179 Sep.10月 23,540 4,428 345 26,727 27,758,727 367 27,497 Oct.11月 23,691 4,839 457 26,733 27,824,851 238 28,411 Nov.12月 22,855 4,969 408 27,108 27,742,779 161 27,828 Dec.
*平成26年調査より調査対象規模を40人以上から50人以上の事業所へ変更。
在 庫 数 量InventoryQuantity
販 売 Salesそ の 他Others
Quantity
数 量Quantity
金額(千円)
Value(Thousand Yen)
消 費 数 量Consumption
Quantity
出 荷 数 量 Shipments Quantity
年 月
13.そ の 他 (16)~(19) Other plastic products
Year andMonth
生 産 数 量ProductionQuantity
受 入 数 量ReceiptQuantity
在 庫 数 量InventoryQuantity
販 売 Sales数 量Quantity
金額(千円)
Value(Thousand Yen)
そ の 他Others
Quantity
消 費 数 量Consumption
Quantity
出 荷 数 量 Shipments Quantity受 入 数 量
ReceiptQuantity
年 月
12.強化製品 Plastic reinforced products
Year andMonth
生 産 数 量ProductionQuantity
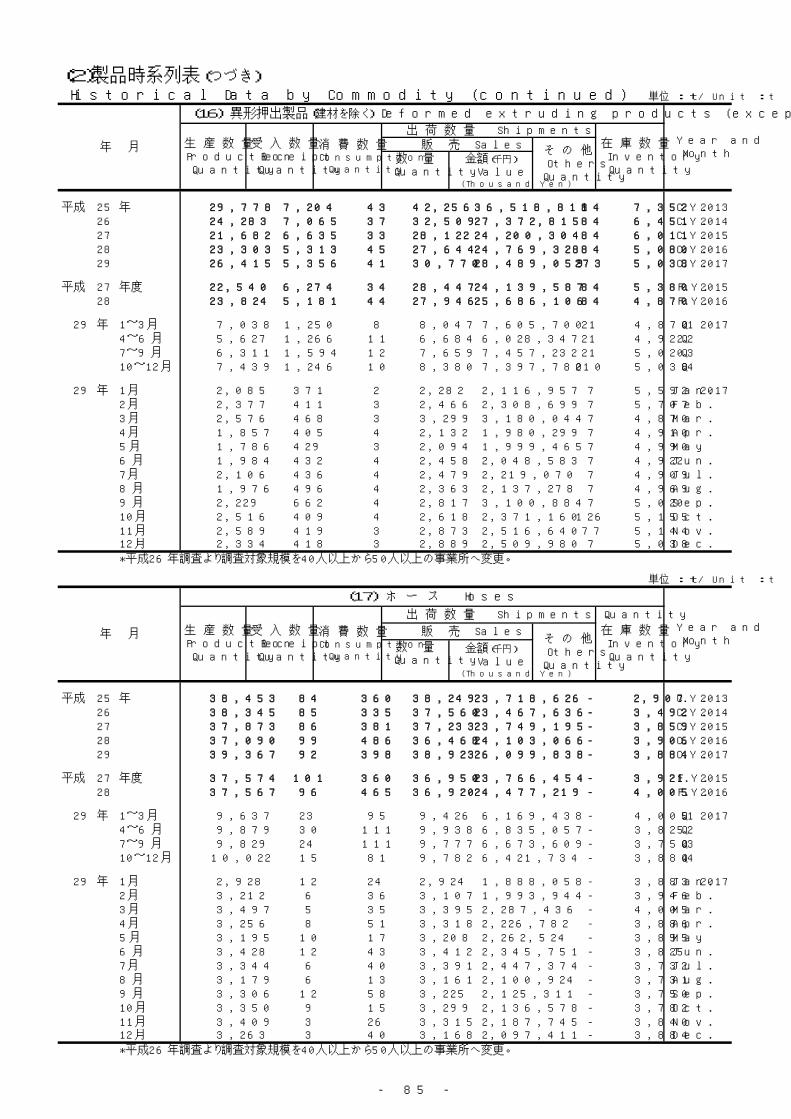
- 85 -
(2)製品時系列表(つづき) Historical Data by Commodity (continued) 単位 : t / Unit : t
平成 25 年 29,778 7,204 43 42,256 36,518,811 84 7,352 C.Y. 201326 24,283 7,065 37 32,509 27,372,815 84 6,451 C.Y. 201427 21,682 6,635 33 28,122 24,200,304 84 6,011 C.Y. 201528 23,303 5,313 45 27,644 24,769,328 84 5,080 C.Y. 201629 26,415 5,356 41 30,770 28,489,059 273 5,038 C.Y. 2017
平成 27 年度 22,540 6,274 34 28,447 24,139,587 84 5,380 F.Y. 201528 23,824 5,181 44 27,946 25,686,106 84 4,870 F.Y. 2016
29 年 1~3月 7,038 1,250 8 8,047 7,605,700 21 4,870 Q1 20174~6月 5,627 1,266 11 6,684 6,028,347 21 4,922 Q27~9月 6,311 1,594 12 7,659 7,457,232 21 5,020 Q310~12月 7,439 1,246 10 8,380 7,397,780 210 5,038 Q4
29 年 1月 2,085 371 2 2,282 2,116,957 7 5,592 Jan. 20172月 2,377 411 3 2,466 2,308,699 7 5,707 Feb.3月 2,576 468 3 3,299 3,180,044 7 4,870 Mar.4月 1,857 405 4 2,132 1,980,299 7 4,910 Apr.5月 1,786 429 3 2,094 1,999,465 7 4,990 May 6月 1,984 432 4 2,458 2,048,583 7 4,922 Jun.7月 2,106 436 4 2,479 2,219,070 7 4,909 Jul.8月 1,976 496 4 2,363 2,137,278 7 4,969 Aug.9月 2,229 662 4 2,817 3,100,884 7 5,020 Sep.10月 2,516 409 4 2,618 2,371,160 126 5,155 Oct.11月 2,589 419 3 2,873 2,516,640 77 5,144 Nov.12月 2,334 418 3 2,889 2,509,980 7 5,038 Dec.
*平成26年調査より調査対象規模を40人以上から50人以上の事業所へ変更。
単位 : t / Unit : t
平成 25 年 38,453 84 360 38,249 23,718,626 - 2,907 C.Y. 201326 38,345 85 335 37,560 23,467,636 - 3,492 C.Y. 201427 37,873 86 381 37,233 23,749,195 - 3,859 C.Y. 201528 37,090 99 486 36,468 24,103,066 - 3,906 C.Y. 201629 39,367 92 398 38,923 26,099,838 - 3,884 C.Y. 2017
平成 27 年度 37,574 101 360 36,950 23,766,454 - 3,921 F.Y. 201528 37,567 96 465 36,920 24,477,219 - 4,005 F.Y. 2016
29 年 1~3月 9,637 23 95 9,426 6,169,438 - 4,005 Q1 20174~6月 9,879 30 111 9,938 6,835,057 - 3,825 Q27~9月 9,829 24 111 9,777 6,673,609 - 3,750 Q310~12月 10,022 15 81 9,782 6,421,734 - 3,884 Q4
29 年 1月 2,928 12 24 2,924 1,888,058 - 3,883 Jan. 20172月 3,212 6 36 3,107 1,993,944 - 3,946 Feb.3月 3,497 5 35 3,395 2,287,436 - 4,005 Mar.4月 3,256 8 51 3,318 2,226,782 - 3,886 Apr.5月 3,195 10 17 3,208 2,262,524 - 3,855 May 6月 3,428 12 43 3,412 2,345,751 - 3,825 Jun.7月 3,344 6 40 3,391 2,447,374 - 3,732 Jul.8月 3,179 6 13 3,161 2,100,924 - 3,731 Aug.9月 3,306 12 58 3,225 2,125,311 - 3,750 Sep.10月 3,350 9 15 3,299 2,136,578 - 3,782 Oct.11月 3,409 3 26 3,315 2,187,745 - 3,840 Nov.12月 3,263 3 40 3,168 2,097,411 - 3,884 Dec.
*平成26年調査より調査対象規模を40人以上から50人以上の事業所へ変更。
数 量Quantity
金額(千円)
Value(Thousand Yen)
生 産 数 量ProductionQuantity
受 入 数 量ReceiptQuantity
消 費 数 量Consumption
Quantity
販 売 Sales
出 荷 数 量 Shipments Quantity
在 庫 数 量InventoryQuantity
年 月
(17) ホ ー ス Hoses
Year andMonthそ の 他
OthersQuantity
数 量Quantity
金額(千円)
Value(Thousand Yen)
生 産 数 量ProductionQuantity
受 入 数 量ReceiptQuantity
消 費 数 量Consumption
Quantity
出 荷 数 量 Shipments Quantity在 庫 数 量InventoryQuantity
年 月
(16) 異形押出製品(建材を除く) Deformed extruding products (except for building)
Year andMonth
販 売 Sales そ の 他Others
Quantity
- 86 -
(2)製品時系列表(つづき) Historical Data by Commodity (continued) 単位 : t / Unit : t
平成 25 年 8,789 2,112 - 10,911 40,972,738 - 55 C.Y. 201326 8,268 1,656 - 9,949 36,427,380 - 35 C.Y. 201427 8,442 1,563 - 9,992 34,698,249 - 51 C.Y. 201528 8,471 1,724 - 10,192 34,301,636 - 54 C.Y. 201629 7,736 1,463 122 9,070 30,015,222 - 68 C.Y. 2017
平成 27 年度 8,496 1,615 - 10,109 34,237,004 - 29 F.Y. 201528 8,292 1,657 53 9,886 33,666,539 - 36 F.Y. 2016
29 年 1~3月 2,039 410 53 2,413 8,207,619 - 36 Q1 20174~6月 1,784 347 9 2,112 6,943,016 - 46 Q27~9月 1,780 313 31 2,068 6,716,765 - 36 Q310~12月 2,133 393 29 2,477 8,147,822 - 68 Q4
29 年 1月 599 117 24 695 2,438,003 - 51 Jan. 20172月 650 138 13 754 2,533,045 - 71 Feb.3月 790 155 16 964 3,236,571 - 36 Mar.4月 591 125 3 700 2,325,191 - 50 Apr.5月 565 91 3 659 2,227,250 - 44 May 6月 628 131 3 753 2,390,575 - 46 Jun.7月 654 112 2 769 2,380,927 - 39 Jul.8月 540 108 3 646 2,171,007 - 38 Aug.9月 586 93 26 653 2,164,831 - 36 Sep.10月 721 129 13 829 2,688,490 - 46 Oct.11月 727 124 9 844 2,756,894 - 52 Nov.12月 685 140 7 804 2,702,438 - 68 Dec.
*平成26年調査より調査対象規模を40人以上から50人以上の事業所へ変更。
単位 : t / Unit : t
平成 25 年 223,507 40,400 2,762 257,436 214,938,997 3,179 20,425 C.Y. 201326 201,639 42,040 1,850 238,909 224,633,446 1,892 18,106 C.Y. 201427 196,860 45,468 2,456 235,881 226,519,935 1,671 17,964 C.Y. 201528 185,882 48,112 3,810 227,512 228,054,861 1,139 18,595 C.Y. 201629 199,456 47,643 3,361 239,869 238,139,792 1,661 18,838 C.Y. 2017
平成 27 年度 193,013 46,889 2,266 235,117 226,433,134 1,462 17,934 F.Y. 201528 189,052 47,444 3,963 229,350 228,893,299 1,183 18,756 F.Y. 2016
29 年 1~3月 47,194 11,071 612 56,787 54,551,165 357 18,756 Q1 20174~6月 50,863 12,564 787 61,368 60,690,307 354 19,305 Q27~9月 50,907 11,426 872 61,785 61,539,299 394 18,373 Q310~12月 50,492 12,582 1,090 59,929 61,359,021 556 18,838 Q4
29 年 1月 14,577 3,626 271 17,024 16,529,119 106 19,299 Jan. 20172月 15,675 3,333 153 18,606 18,243,309 160 19,247 Feb.3月 16,942 4,112 188 21,157 19,778,737 91 18,756 Mar.4月 16,282 3,850 242 19,631 19,493,552 145 18,617 Apr.5月 16,521 4,122 203 19,759 19,602,380 94 19,126 May 6月 18,060 4,592 342 21,978 21,594,375 115 19,305 Jun.7月 17,650 4,070 395 21,370 20,987,297 106 19,043 Jul.8月 15,894 3,475 272 19,797 19,999,868 133 18,239 Aug.9月 17,363 3,881 205 20,618 20,552,134 155 18,373 Sep.10月 16,953 3,881 313 19,981 20,562,499 241 18,514 Oct.11月 16,966 4,293 419 19,701 20,363,572 161 19,375 Nov.12月 16,573 4,408 358 20,247 20,432,950 154 18,838 Dec.
*平成26年調査より調査対象規模を40人以上から50人以上の事業所へ変更。
数 量Quantity
金額(千円)
Value(Thousand Yen)
販 売 Salesそ の 他Others
Quantity
年 月
(19) その他製品 Others
Year andMonth
生 産 数 量ProductionQuantity
受 入 数 量ReceiptQuantity
消 費 数 量Consumption
Quantity
出 荷 数 量 Shipments Quantity
在 庫 数 量InventoryQuantity
数 量Quantity
金額(千円)
Value(Thousand Yen)
販 売 Sales そ の 他Others
Quantity
Year andMonth
年 月
(18) ディスクレコード Disk records
生 産 数 量ProductionQuantity
受 入 数 量ReceiptQuantity
消 費 数 量Consumption
Quantity
出 荷 数 量 Shipments Quantity在 庫 数 量InventoryQuantity
- 87 -
(2)製品時系列表(つづき) Historical Data by Commodity (continued) 単位 :個 / Unit : Number
平成 25 年 1,129,475 4,733 - 1,128,064 13,909,912 49 44,632 C.Y. 201326 1,187,032 7,724 - 1,196,436 13,890,968 48 45,862 C.Y. 201427 1,201,169 6,220 - 1,202,851 13,472,970 25 56,132 C.Y. 201528 1,176,847 8,439 - 1,192,686 13,826,407 - 51,557 C.Y. 201629 1,303,774 12,095 - 1,321,267 14,393,586 - 51,864 C.Y. 2017
平成 27 年度 1,168,935 6,615 - 1,185,074 13,585,157 13 50,087 F.Y. 201528 1,194,063 9,915 - 1,203,014 13,847,593 - 54,933 F.Y. 2016
29 年 1~3月 305,036 3,462 - 306,110 3,406,950 - 54,933 Q1 20174~6月 344,478 2,256 - 349,039 3,491,932 - 53,883 Q27~9月 309,086 2,620 - 313,286 3,539,208 - 54,034 Q310~12月 345,174 3,757 - 352,832 3,955,496 - 51,864 Q4
29 年 1月 103,042 1,959 - 97,795 1,061,989 - 58,773 Jan. 20172月 98,079 298 - 100,642 1,121,202 - 57,147 Feb.3月 103,915 1,205 - 107,673 1,223,759 - 54,933 Mar.4月 104,400 838 - 103,027 1,146,754 - 57,483 Apr.5月 122,133 671 - 120,058 1,095,314 - 60,568 May 6月 117,945 747 - 125,954 1,249,864 - 53,883 Jun.7月 103,823 758 - 102,750 1,177,710 - 56,291 Jul.8月 100,536 808 - 104,707 1,154,809 - 53,505 Aug.9月 104,727 1,054 - 105,829 1,206,689 - 54,034 Sep.10月 115,895 934 - 120,565 1,358,280 - 50,875 Oct.11月 115,734 1,384 - 116,837 1,325,908 - 51,733 Nov.12月 113,545 1,439 - 115,430 1,271,308 - 51,864 Dec.
*平成26年調査より調査対象規模を40人以上から50人以上の事業所へ変更。
単位 :個 / Unit : Number
平成 25 年 118,229 4,537 - 122,110 13,879,865 72 5,951 C.Y. 201326 113,100 3,944 - 116,596 12,961,299 25 6,328 C.Y. 201427 109,882 3,703 - 115,472 13,090,911 11 5,007 C.Y. 201528 126,260 4,066 - 130,346 13,474,522 - 4,842 C.Y. 201629 116,353 3,925 - 120,919 12,839,232 - 4,201 C.Y. 2017
平成 27 年度 116,064 3,565 - 120,972 13,070,600 2 5,620 F.Y. 201528 124,456 4,035 - 129,069 13,471,479 - 4,987 F.Y. 2016
29 年 1~3月 26,894 861 - 27,610 2,990,980 - 4,987 Q1 20174~6月 31,005 891 - 32,647 3,240,141 - 4,236 Q27~9月 29,474 1,074 - 30,663 3,214,428 - 4,121 Q310~12月 28,980 1,099 - 29,999 3,393,683 - 4,201 Q4
29 年 1月 7,691 283 - 7,821 844,787 - 4,995 Jan. 20172月 9,666 325 - 10,300 1,124,445 - 4,686 Feb.3月 9,537 253 - 9,489 1,021,748 - 4,987 Mar.4月 9,808 278 - 10,359 993,193 - 4,714 Apr.5月 9,249 288 - 9,851 1,007,199 - 4,400 May 6月 11,948 325 - 12,437 1,239,749 - 4,236 Jun.7月 10,849 301 - 11,075 1,126,911 - 4,311 Jul.8月 9,286 343 - 9,660 954,553 - 4,280 Aug.9月 9,339 430 - 9,928 1,132,964 - 4,121 Sep.10月 9,738 423 - 10,088 1,081,675 - 4,194 Oct.11月 9,573 334 - 9,906 1,156,915 - 4,195 Nov.12月 9,669 342 - 10,005 1,155,093 - 4,201 Dec.
*平成26年調査より調査対象規模を40人以上から50人以上の事業所へ変更。
販 売 Salesそ の 他Others
Quantity
在 庫 数 量InventoryQuantity
数 量Quantity
金額(千円)
Value(Thousand Yen)
15. 〔特掲〕 浄 化 槽 (個) 〔inserted specially〕Septic tank (Number)
出 荷 数 量 Shipments QuantityYear andMonth
生 産 数 量ProductionQuantity
受 入 数 量ReceiptQuantity
消 費 数 量Consumption
Quantity
年 月
販 売 Sales そ の 他Others
Quantity
出 荷 数 量 Shipments Quantity在 庫 数 量InventoryQuantity
数 量Quantity
金額(千円)
Value(Thousand Yen)
消 費 数 量Consumption
Quantity
年 月
14. 〔特掲〕 浴 槽 (個) 〔inserted specially〕Bathtub (Number)
Year andMonth
生 産 数 量ProductionQuantity
受 入 数 量ReceiptQuantity
- 88 -
2.原材料統計 Raw Material Statistics
原材料時系列表 Historical Data by Raw material
フィルム・シートFilm and Sheets
板Plates
合 成 皮 革Syntheticleathers
パイプ・継手Pipes and Pipe
fittings
機械器具部品for Machine
tools and parts
平成 25 年 5,646,194 2,527,991 118,043 37,901 518,966 636,42526 5,363,845 2,423,234 104,170 39,702 470,693 596,17827 5,273,412 2,414,728 105,066 40,988 423,874 586,19628 5,358,433 2,459,878 107,144 42,983 411,366 609,39629 5,511,446 2,508,324 109,714 43,435 422,591 638,415
平成 27 年度 5,287,913 2,429,949 105,668 41,458 417,226 589,52128 5,406,342 2,481,650 109,259 42,794 409,341 619,664
29 年 1~3月 1,330,599 609,894 26,556 10,363 102,395 161,6914~6月 1,383,448 631,964 27,646 10,489 99,501 155,2547~9月 1,376,373 620,892 27,028 10,515 106,633 156,89110~12月 1,421,026 645,574 28,484 12,068 114,062 164,579
29 年 1月 420,607 194,949 8,423 3,267 34,364 50,0852月 438,368 200,804 8,888 3,450 34,583 53,8253月 471,624 214,141 9,245 3,646 33,448 57,7814月 461,897 213,493 9,441 3,435 31,774 52,2825月 438,139 201,525 8,483 3,314 31,119 47,4716月 483,412 216,946 9,722 3,740 36,608 55,5017月 483,925 219,180 9,355 3,677 37,134 54,6078月 419,338 188,602 8,178 3,279 29,845 47,9889月 473,110 213,110 9,495 3,559 39,654 54,29610月 486,954 223,570 9,263 3,988 38,273 56,16111月 481,803 219,252 10,113 4,294 38,832 55,05812月 452,269 202,752 9,108 3,786 36,957 53,360
フィルム・シートFilm and Sheets
板Plates
合 成 皮 革Syntheticleathers
パイプ・継手Pipes and Pipe
fittings
機械器具部品for Machine
tools and parts
平成 25 年 1,165,070 763,733 958 3,467 47,613 30,91526 1,128,583 741,397 112 3,815 39,188 19,65327 1,109,032 727,830 9 3,177 35,391 19,52328 1,145,742 745,076 25 3,725 35,904 19,93729 1,190,185 766,216 28 3,328 36,819 20,795
平成 27 年度 1,117,190 733,068 11 3,436 35,256 19,561
28 1,154,938 748,620 28 3,638 35,582 20,469
29 年 1~3月 285,622 186,708 9 903 8,086 5,4274~6月 296,732 190,354 7 759 8,689 5,1807~9月 297,492 188,964 6 838 9,941 5,04410~12月 310,339 200,190 6 828 10,103 5,144
29 年 1月 90,099 58,731 3 293 2,802 1,6972月 93,876 61,734 3 318 2,684 1,8203月 101,647 66,243 3 292 2,600 1,9104月 100,199 65,068 2 70 2,790 1,8825月 92,993 59,031 2 329 2,692 1,5176月 103,540 66,255 3 360 3,207 1,7817月 104,650 67,441 2 248 3,290 1,7488月 88,648 54,902 2 309 3,060 1,5609月 104,194 66,621 2 281 3,591 1,73610月 108,428 69,992 2 307 3,742 1,72911月 106,646 69,471 2 280 3,455 1,73712月 95,265 60,727 2 241 2,906 1,678
消 費 計Consumption
total
生 産 品 目 別 消 費 内 訳年 月
2.ポ リ エ チ レ ン
消 費 計Consumption
total
生 産 品 目 別 消 費 内 訳年 月
1.原 材 料 樹 脂 計 2 ~ 10
- 89 -
単位 : t / Unit : t
日用品・雑貨for Daily necessariesand Miscellaneous
goods
容 器Containers
建 材for Building
発 泡 製 品Foam products
強 化 製 品Reinforcedproducts
そ の 他Other products
270,445 809,485 157,416 251,802 49,474 268,246 C.Y. 2013263,709 785,384 163,054 232,764 45,857 239,100 C.Y. 2014259,277 769,679 154,919 232,042 45,296 241,347 C.Y. 2015273,938 783,133 156,033 236,292 43,730 234,540 C.Y. 2016278,631 828,868 153,242 232,580 45,950 249,696 C.Y. 2017
264,243 768,019 155,445 233,570 45,220 237,594 F.Y. 2015276,283 794,504 155,481 236,435 43,558 237,373 F.Y. 2016
68,049 189,423 37,486 55,567 10,919 58,256 Q1 201771,153 217,418 38,473 57,979 11,472 62,099 Q266,873 216,556 38,019 57,479 11,532 63,955 Q372,556 205,471 39,264 61,555 12,027 65,386 Q4
21,013 56,768 11,643 18,068 3,440 18,587 Jan. 201722,198 60,865 12,438 18,304 3,524 19,489 Feb.24,838 71,790 13,405 19,195 3,955 20,180 Mar.24,937 70,242 12,846 19,752 3,711 19,984 Apr.22,952 68,371 11,783 19,011 3,680 20,430 May 23,264 78,805 13,844 19,216 4,081 21,685 Jun.22,729 78,522 13,209 19,983 3,991 21,538 Jul.20,986 67,274 11,139 18,058 3,548 20,441 Aug.23,158 70,760 13,671 19,438 3,993 21,976 Sep.24,519 70,845 13,395 20,797 4,072 22,071 Oct.24,310 69,310 13,058 21,370 4,108 22,098 Nov.23,727 65,316 12,811 19,388 3,847 21,217 Dec.
単位 : t / Unit : t
日用品・雑貨for Daily necessariesand Miscellaneous
goods
容 器Containers
建 材for Building
発 泡 製 品Foam products
強 化 製 品Reinforcedproducts
そ の 他Other products
22,737 206,089 3,599 41,884 17 44,058 C.Y. 201328,337 207,035 3,648 40,845 7 44,546 C.Y. 201427,606 204,284 4,067 40,633 15 46,497 C.Y. 201530,254 217,179 3,588 41,586 13 48,455 C.Y. 201631,715 231,497 3,125 41,473 8 55,181 C.Y. 2017
28,751 205,485 4,014 41,077 21 46,510 F.Y. 2015
31,295 220,933 3,455 41,547 8 49,363 F.Y. 2016
8,359 53,055 817 10,109 1 12,148 Q1 20177,709 58,937 801 10,379 3 13,914 Q27,584 59,619 778 10,095 3 14,620 Q38,063 59,886 729 10,890 1 14,499 Q4
2,727 16,193 240 3,301 - 4,112 Jan. 20172,599 16,952 283 3,343 - 4,140 Feb.3,033 19,910 294 3,465 1 3,896 Mar.2,688 19,308 258 3,518 1 4,614 Apr.2,478 18,620 244 3,420 1 4,659 May 2,543 21,009 299 3,441 1 4,641 Jun.2,759 20,853 267 3,480 1 4,561 Jul.2,199 18,287 239 3,144 1 4,945 Aug.2,626 20,479 272 3,471 1 5,114 Sep.2,686 21,270 224 3,640 - 4,836 Oct.2,740 20,160 246 3,654 - 4,901 Nov.2,637 18,456 259 3,596 1 4,762 Dec.
Consumption items by the products
Polyethylene
Year andMonth
Consumption items by the products
Raw material plastic Total
Year andMonth
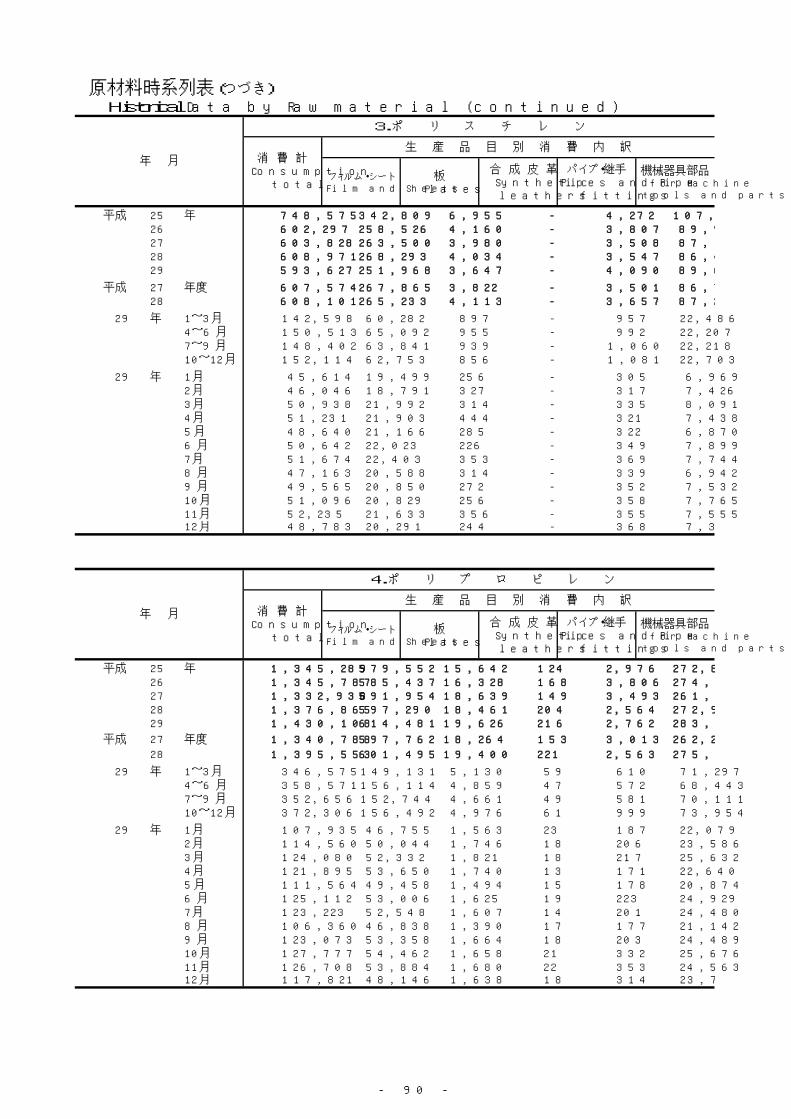
- 90 -
原材料時系列表(つづき) Historical Data by Raw material (continued)
フィルム・シートFilm and Sheets
板Plates
合 成 皮 革Syntheticleathers
パイプ・継手Pipes and Pipe
fittings
機械器具部品for Machine
tools and parts
平成 25 年 748,575 342,809 6,955 - 4,272 107,80626 602,297 258,526 4,160 - 3,807 89,98527 603,828 263,500 3,980 - 3,508 87,10328 608,971 268,293 4,034 - 3,547 86,44229 593,627 251,968 3,647 - 4,090 89,614
平成 27 年度 607,574 267,865 3,822 - 3,501 86,76228 608,101 265,233 4,113 - 3,657 87,245
29 年 1~3月 142,598 60,282 897 - 957 22,4864~6月 150,513 65,092 955 - 992 22,2077~9月 148,402 63,841 939 - 1,060 22,21810~12月 152,114 62,753 856 - 1,081 22,703
29 年 1月 45,614 19,499 256 - 305 6,9692月 46,046 18,791 327 - 317 7,4263月 50,938 21,992 314 - 335 8,0914月 51,231 21,903 444 - 321 7,4385月 48,640 21,166 285 - 322 6,8706月 50,642 22,023 226 - 349 7,8997月 51,674 22,403 353 - 369 7,7448月 47,163 20,588 314 - 339 6,9429月 49,565 20,850 272 - 352 7,53210月 51,096 20,829 256 - 358 7,76511月 52,235 21,633 356 - 355 7,55512月 48,783 20,291 244 - 368 7,383
フィルム・シートFilm and Sheets
板Plates
合 成 皮 革Syntheticleathers
パイプ・継手Pipes and Pipe
fittings
機械器具部品for Machine
tools and parts
平成 25 年 1,345,289 579,552 15,642 124 2,976 272,83026 1,345,787 585,437 16,328 168 3,806 274,14327 1,332,938 591,954 18,639 149 3,493 261,56628 1,376,865 597,290 18,461 204 2,564 272,90729 1,430,108 614,481 19,626 216 2,762 283,805
平成 27 年度 1,340,788 597,762 18,264 153 3,013 262,298
28 1,395,553 601,495 19,400 221 2,563 275,930
29 年 1~3月 346,575 149,131 5,130 59 610 71,2974~6月 358,571 156,114 4,859 47 572 68,4437~9月 352,656 152,744 4,661 49 581 70,11110~12月 372,306 156,492 4,976 61 999 73,954
29 年 1月 107,935 46,755 1,563 23 187 22,0792月 114,560 50,044 1,746 18 206 23,5863月 124,080 52,332 1,821 18 217 25,6324月 121,895 53,650 1,740 13 171 22,6405月 111,564 49,458 1,494 15 178 20,8746月 125,112 53,006 1,625 19 223 24,9297月 123,223 52,548 1,607 14 201 24,4808月 106,360 46,838 1,390 17 177 21,1429月 123,073 53,358 1,664 18 203 24,48910月 127,777 54,462 1,658 21 332 25,67611月 126,708 53,884 1,680 22 353 24,56312月 117,821 48,146 1,638 18 314 23,715
消 費 計Consumption
total
生 産 品 目 別 消 費 内 訳年 月
4.ポ リ プ ロ ピ レ ン
3.ポ リ ス チ レ ン
生 産 品 目 別 消 費 内 訳消 費 計
Consumptiontotal
年 月
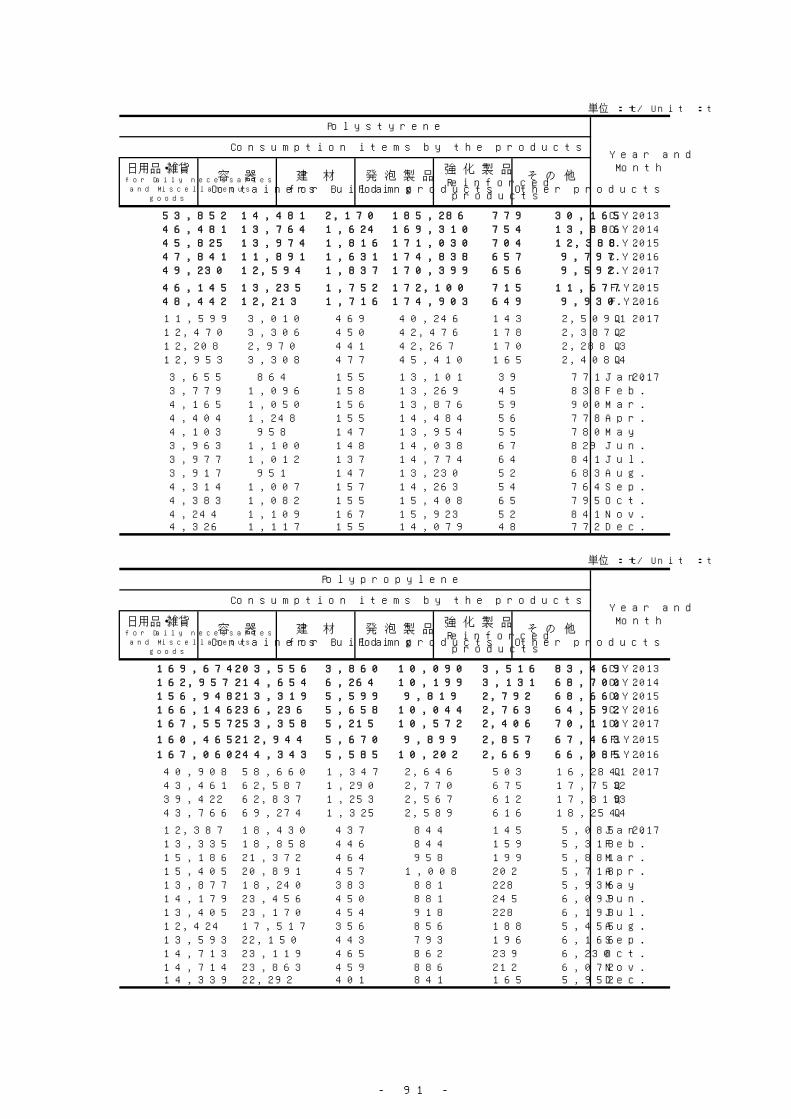
- 91 -
単位 : t / Unit : t
日用品・雑貨for Daily necessariesand Miscellaneous
goods
容 器Containers
建 材for Building
発 泡 製 品Foam products
強 化 製 品Reinforcedproducts
そ の 他Other products
53,852 14,481 2,170 185,286 779 30,165 C.Y. 201346,481 13,764 1,624 169,310 754 13,886 C.Y. 201445,825 13,974 1,816 171,030 704 12,388 C.Y. 201547,841 11,891 1,631 174,838 657 9,797 C.Y. 201649,230 12,594 1,837 170,399 656 9,592 C.Y. 2017
46,145 13,235 1,752 172,100 715 11,677 F.Y. 201548,442 12,213 1,716 174,903 649 9,930 F.Y. 2016
11,599 3,010 469 40,246 143 2,509 Q1 201712,470 3,306 450 42,476 178 2,387 Q212,208 2,970 441 42,267 170 2,288 Q312,953 3,308 477 45,410 165 2,408 Q4
3,655 864 155 13,101 39 771 Jan. 20173,779 1,096 158 13,269 45 838 Feb.4,165 1,050 156 13,876 59 900 Mar.4,404 1,248 155 14,484 56 778 Apr.4,103 958 147 13,954 55 780 May 3,963 1,100 148 14,038 67 829 Jun.3,977 1,012 137 14,774 64 841 Jul.3,917 951 147 13,230 52 683 Aug.4,314 1,007 157 14,263 54 764 Sep.4,383 1,082 155 15,408 65 795 Oct.4,244 1,109 167 15,923 52 841 Nov.4,326 1,117 155 14,079 48 772 Dec.
単位 : t / Unit : t
日用品・雑貨for Daily necessariesand Miscellaneous
goods
容 器Containers
建 材for Building
発 泡 製 品Foam products
強 化 製 品Reinforcedproducts
そ の 他Other products
169,674 203,556 3,860 10,090 3,516 83,469 C.Y. 2013162,957 214,654 6,264 10,199 3,131 68,700 C.Y. 2014156,948 213,319 5,599 9,819 2,792 68,660 C.Y. 2015166,146 236,236 5,658 10,044 2,763 64,592 C.Y. 2016167,557 253,358 5,215 10,572 2,406 70,110 C.Y. 2017
160,465 212,944 5,670 9,899 2,857 67,463 F.Y. 2015
167,060 244,343 5,585 10,202 2,669 66,085 F.Y. 2016
40,908 58,660 1,347 2,646 503 16,284 Q1 201743,461 62,587 1,290 2,770 675 17,753 Q239,422 62,837 1,253 2,567 612 17,819 Q343,766 69,274 1,325 2,589 616 18,254 Q4
12,387 18,430 437 844 145 5,085 Jan. 201713,335 18,858 446 844 159 5,318 Feb.15,186 21,372 464 958 199 5,881 Mar.15,405 20,891 457 1,008 202 5,718 Apr.13,877 18,240 383 881 228 5,936 May 14,179 23,456 450 881 245 6,099 Jun.13,405 23,170 454 918 228 6,198 Jul.12,424 17,517 356 856 188 5,455 Aug.13,593 22,150 443 793 196 6,166 Sep.14,713 23,119 465 862 239 6,230 Oct.14,714 23,863 459 886 212 6,072 Nov.14,339 22,292 401 841 165 5,952 Dec.
Consumption items by the products
Polypropylene
Year andMonth
Year andMonth
Consumption items by the products
Polystyrene

- 92 -
原材料時系列表(つづき) Historical Data by Raw material (continued)
フィルム・シートFilm and Sheets
板Plates
合 成 皮 革Syntheticleathers
パイプ・継手Pipes and Pipe
fittings
機械器具部品for Machine
tools and parts
平成 25 年 854,012 143,448 30,922 22,742 451,753 13,99326 805,307 138,839 29,326 23,414 410,417 13,69427 756,759 133,502 29,652 24,342 368,639 13,38428 747,411 135,188 30,913 24,957 355,862 12,94829 765,214 142,267 33,369 25,820 364,465 13,448
平成 27 年度 750,052 132,898 30,457 24,373 362,136 13,14228 749,299 138,951 32,104 24,894 353,358 13,278
29 年 1~3月 186,204 35,126 8,097 6,041 88,498 3,3384~6月 186,499 36,116 8,151 6,067 86,168 3,3067~9月 190,777 35,019 8,434 6,194 91,629 3,34010~12月 201,734 36,006 8,687 7,518 98,170 3,464
29 年 1月 60,433 11,197 2,490 1,826 29,880 1,0822月 62,394 11,542 2,776 2,000 29,940 1,1153月 63,377 12,387 2,831 2,215 28,678 1,1414月 60,375 11,596 2,671 2,056 27,474 1,0895月 57,822 10,973 2,433 1,894 26,938 1,0546月 68,302 13,547 3,047 2,117 31,756 1,1637月 66,863 12,404 3,032 2,169 32,111 1,1488月 55,007 10,561 2,487 1,948 25,249 1,0349月 68,907 12,054 2,915 2,077 34,269 1,15810月 67,642 12,396 2,703 2,367 32,534 1,26311月 69,265 12,779 3,243 2,652 33,464 1,13112月 64,827 10,831 2,741 2,499 32,172 1,070
フィルム・シートFilm and Sheets
板Plates
合 成 皮 革Syntheticleathers
パイプ・継手Pipes and Pipe
fittings
機械器具部品for Machine
tools and parts
平成 25 年 30,151 - 9,592 - - 11,98226 28,506 - 10,228 - - 10,92927 29,681 - 10,762 - - 11,09728 31,185 - 11,243 - - 11,51829 32,051 - 10,156 - - 12,764
平成 27 年度 29,660 - 10,782 - - 11,115
28 31,728 - 11,234 - - 11,765
29 年 1~3月 7,887 - 2,553 - - 3,1564~6月 7,820 - 2,299 - - 3,0637~9月 7,852 - 2,429 - - 3,15710~12月 8,492 - 2,875 - - 3,388
29 年 1月 2,497 - 782 - - 9622月 2,655 - 949 - - 1,0503月 2,735 - 822 - - 1,1444月 2,612 - 863 - - 1,0395月 2,417 - 688 - - 9106月 2,791 - 748 - - 1,1147月 2,561 - 772 - - 1,0738月 2,444 - 780 - - 9679月 2,847 - 877 - - 1,11710月 2,841 - 899 - - 1,14511月 2,854 - 986 - - 1,13112月 2,797 - 990 - - 1,112
消 費 計Consumption
total
生 産 品 目 別 消 費 内 訳年 月
6.メ タ ク リ ル 樹 脂 ( 成 形 材 料 )
年 月
5.塩 化 ビ ニ ル 樹 脂 ( コ ン パ ウ ン ド を 含 む )
消 費 計Consumption
total
生 産 品 目 別 消 費 内 訳

- 93 -
単位 : t / Unit : t
日用品・雑貨for Daily necessariesand Miscellaneous
goods
容 器Containers
建 材for Building
発 泡 製 品Foam products
強 化 製 品Reinforcedproducts
そ の 他Other products
4,459 479 135,365 4,819 - 46,032 C.Y. 20135,255 299 137,758 2,926 - 43,379 C.Y. 20145,323 432 133,000 1,065 - 47,420 C.Y. 20154,665 143 137,399 1,120 - 44,216 C.Y. 20164,856 145 136,121 1,324 - 43,399 C.Y. 2017
5,133 382 134,543 1,277 - 45,711 F.Y. 20154,751 139 137,091 1,116 - 43,617 F.Y. 2016
1,266 38 32,970 322 - 10,508 Q1 20171,197 36 34,291 346 - 10,821 Q21,151 35 33,646 342 - 10,987 Q31,242 36 35,214 314 - 11,083 Q4
359 11 10,196 96 - 3,296 Jan. 2017470 14 10,911 113 - 3,513 Feb.437 13 11,863 113 - 3,699 Mar.412 11 11,479 99 - 3,488 Apr.387 13 10,453 116 - 3,561 May 398 12 12,359 131 - 3,772 Jun.376 12 11,785 118 - 3,708 Jul.363 12 9,657 100 - 3,596 Aug.412 11 12,204 124 - 3,683 Sep.430 12 12,038 108 - 3,791 Oct.436 11 11,680 103 - 3,766 Nov.376 13 11,496 103 - 3,526 Dec.
単位 : t / Unit : t
日用品・雑貨for Daily necessariesand Miscellaneous
goods
容 器Containers
建 材for Building
発 泡 製 品Foam products
強 化 製 品Reinforcedproducts
そ の 他Other products
2,078 - - - 1,346 5,153 C.Y. 20132,156 - 1 - 1,208 3,984 C.Y. 20142,284 - 268 - 1,080 4,190 C.Y. 20152,770 - 292 - 1,107 4,255 C.Y. 20162,896 - 403 - 1,020 4,812 C.Y. 2017
2,343 - 309 - 1,103 4,008 F.Y. 2015
2,859 - 318 - 1,090 4,462 F.Y. 2016
692 - 105 - 212 1,169 Q1 2017723 - 113 - 276 1,346 Q2745 - 97 - 256 1,168 Q3736 - 88 - 276 1,129 Q4
228 - 33 - 60 432 Jan. 2017225 - 35 - 69 327 Feb.239 - 37 - 83 410 Mar.237 - 33 - 86 354 Apr.240 - 40 - 91 448 May 246 - 40 - 99 544 Jun.251 - 33 - 95 337 Jul.251 - 31 - 76 339 Aug.243 - 33 - 85 492 Sep.242 - 30 - 106 419 Oct.245 - 31 - 94 367 Nov.249 - 27 - 76 343 Dec.
Methacrylic Resins (molding material)
Year andMonth
Consumption items by the products
Vinyl chloride resins (including compound)
Year andMonth
Consumption items by the products
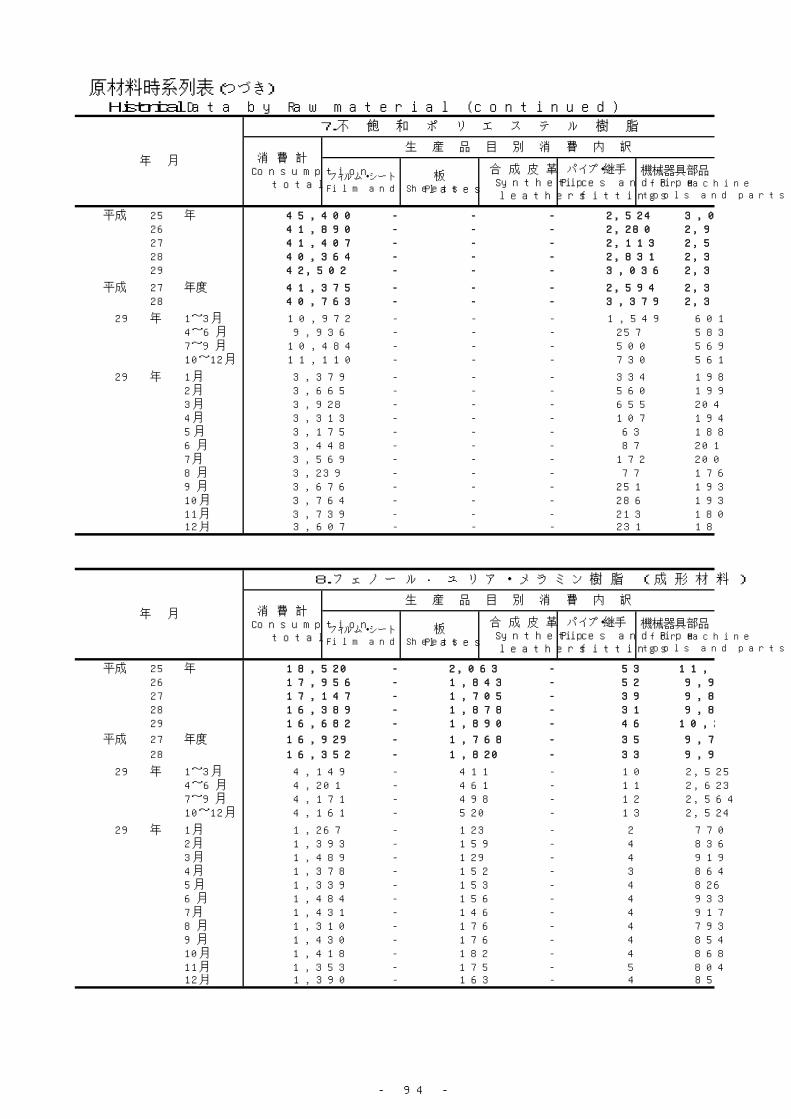
- 94 -
原材料時系列表(つづき) Historical Data by Raw material (continued)
フィルム・シートFilm and Sheets
板Plates
合 成 皮 革Syntheticleathers
パイプ・継手Pipes and Pipe
fittings
機械器具部品for Machine
tools and parts
平成 25 年 45,400 - - - 2,524 3,07726 41,890 - - - 2,280 2,92127 41,407 - - - 2,113 2,50128 40,364 - - - 2,831 2,34229 42,502 - - - 3,036 2,314
平成 27 年度 41,375 - - - 2,594 2,38728 40,763 - - - 3,379 2,347
29 年 1~3月 10,972 - - - 1,549 6014~6月 9,936 - - - 257 5837~9月 10,484 - - - 500 56910~12月 11,110 - - - 730 561
29 年 1月 3,379 - - - 334 1982月 3,665 - - - 560 1993月 3,928 - - - 655 2044月 3,313 - - - 107 1945月 3,175 - - - 63 1886月 3,448 - - - 87 2017月 3,569 - - - 172 2008月 3,239 - - - 77 1769月 3,676 - - - 251 19310月 3,764 - - - 286 19311月 3,739 - - - 213 18012月 3,607 - - - 231 188
フィルム・シートFilm and Sheets
板Plates
合 成 皮 革Syntheticleathers
パイプ・継手Pipes and Pipe
fittings
機械器具部品for Machine
tools and parts
平成 25 年 18,520 - 2,063 - 53 11,13426 17,956 - 1,843 - 52 9,90027 17,147 - 1,705 - 39 9,85528 16,389 - 1,878 - 31 9,80129 16,682 - 1,890 - 46 10,236
平成 27 年度 16,929 - 1,768 - 35 9,727
28 16,352 - 1,820 - 33 9,975
29 年 1~3月 4,149 - 411 - 10 2,5254~6月 4,201 - 461 - 11 2,6237~9月 4,171 - 498 - 12 2,56410~12月 4,161 - 520 - 13 2,524
29 年 1月 1,267 - 123 - 2 7702月 1,393 - 159 - 4 8363月 1,489 - 129 - 4 9194月 1,378 - 152 - 3 8645月 1,339 - 153 - 4 8266月 1,484 - 156 - 4 9337月 1,431 - 146 - 4 9178月 1,310 - 176 - 4 7939月 1,430 - 176 - 4 85410月 1,418 - 182 - 4 86811月 1,353 - 175 - 5 80412月 1,390 - 163 - 4 852
年 月
8.フ ェ ノ ー ル ・ ユ リ ア ・ メ ラ ミ ン 樹 脂 ( 成 形 材 料 )
消 費 計Consumption
total
生 産 品 目 別 消 費 内 訳
生 産 品 目 別 消 費 内 訳
7.不 飽 和 ポ リ エ ス テ ル 樹 脂
消 費 計Consumption
total
年 月
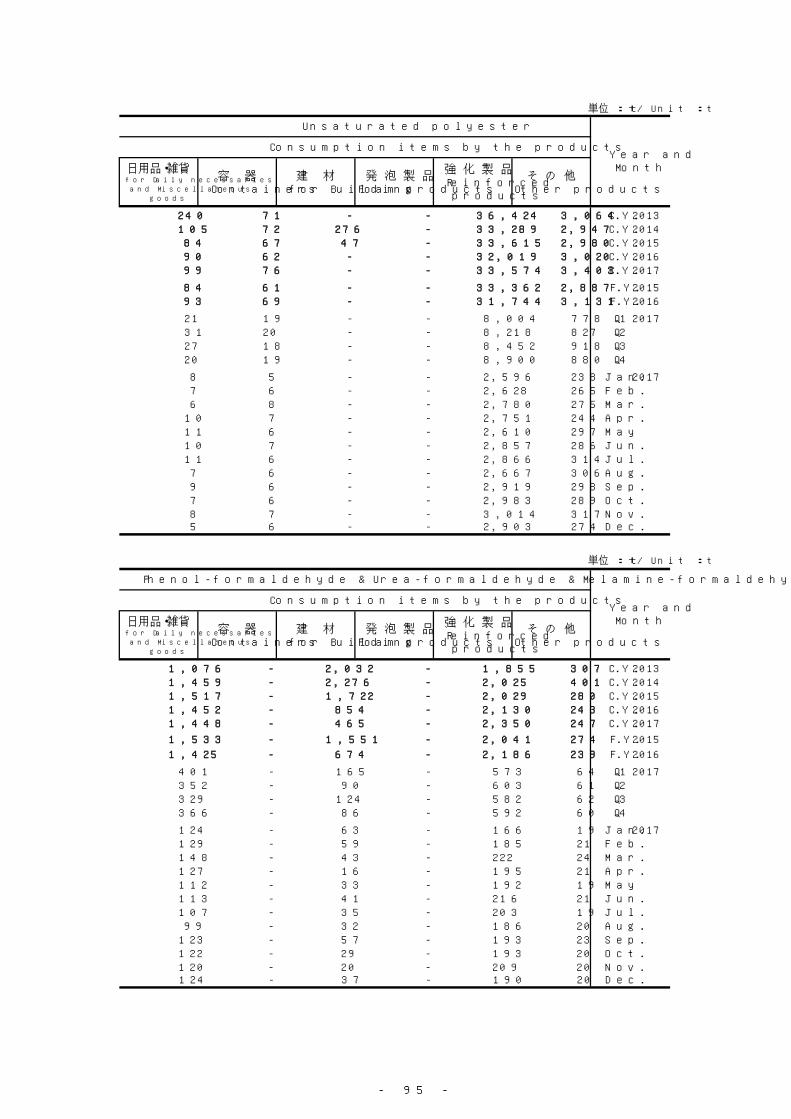
- 95 -
単位 : t / Unit : t
日用品・雑貨for Daily necessariesand Miscellaneous
goods
容 器Containers
建 材for Building
発 泡 製 品Foam products
強 化 製 品Reinforcedproducts
そ の 他Other products
240 71 - - 36,424 3,064 C.Y. 2013105 72 276 - 33,289 2,947 C.Y. 201484 67 47 - 33,615 2,980 C.Y. 201590 62 - - 32,019 3,020 C.Y. 201699 76 - - 33,574 3,403 C.Y. 2017
84 61 - - 33,362 2,887 F.Y. 201593 69 - - 31,744 3,131 F.Y. 2016
21 19 - - 8,004 778 Q1 201731 20 - - 8,218 827 Q227 18 - - 8,452 918 Q320 19 - - 8,900 880 Q4
8 5 - - 2,596 238 Jan. 20177 6 - - 2,628 265 Feb.6 8 - - 2,780 275 Mar.
10 7 - - 2,751 244 Apr.11 6 - - 2,610 297 May 10 7 - - 2,857 286 Jun.11 6 - - 2,866 314 Jul.7 6 - - 2,667 306 Aug.9 6 - - 2,919 298 Sep.7 6 - - 2,983 289 Oct.8 7 - - 3,014 317 Nov.5 6 - - 2,903 274 Dec.
単位 : t / Unit : t
日用品・雑貨for Daily necessariesand Miscellaneous
goods
容 器Containers
建 材for Building
発 泡 製 品Foam products
強 化 製 品Reinforcedproducts
そ の 他Other products
1,076 - 2,032 - 1,855 307 C.Y. 20131,459 - 2,276 - 2,025 401 C.Y. 20141,517 - 1,722 - 2,029 280 C.Y. 20151,452 - 854 - 2,130 243 C.Y. 20161,448 - 465 - 2,350 247 C.Y. 2017
1,533 - 1,551 - 2,041 274 F.Y. 2015
1,425 - 674 - 2,186 239 F.Y. 2016
401 - 165 - 573 64 Q1 2017352 - 90 - 603 61 Q2329 - 124 - 582 62 Q3366 - 86 - 592 60 Q4
124 - 63 - 166 19 Jan. 2017129 - 59 - 185 21 Feb.148 - 43 - 222 24 Mar.127 - 16 - 195 21 Apr.112 - 33 - 192 19 May 113 - 41 - 216 21 Jun.107 - 35 - 203 19 Jul.99 - 32 - 186 20 Aug.
123 - 57 - 193 23 Sep.122 - 29 - 193 20 Oct.120 - 20 - 209 20 Nov.124 - 37 - 190 20 Dec.
Phenol-formaldehyde & Urea-formaldehyde & Melamine-formaldehyde (molding material)
Year andMonth
Consumption items by the products
Year andMonth
Consumption items by the products
Unsaturated polyester
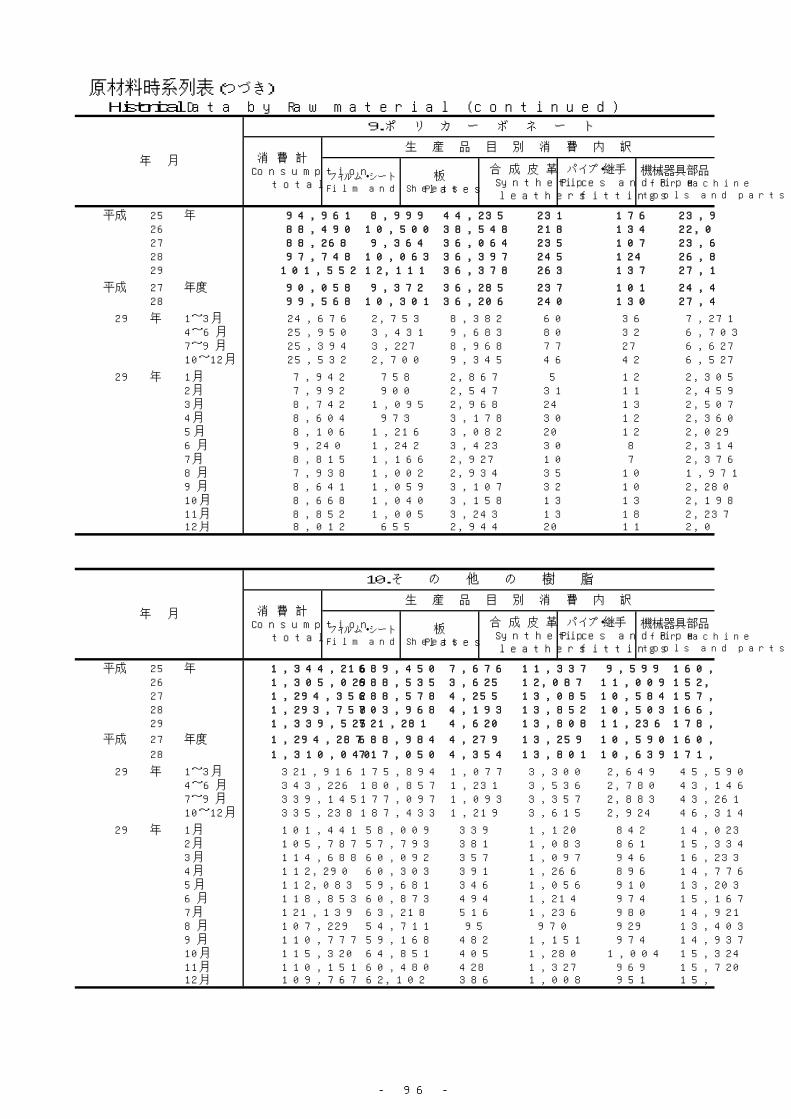
- 96 -
原材料時系列表(つづき) Historical Data by Raw material (continued)
フィルム・シートFilm and Sheets
板Plates
合 成 皮 革Syntheticleathers
パイプ・継手Pipes and Pipe
fittings
機械器具部品for Machine
tools and parts
平成 25 年 94,961 8,999 44,235 231 176 23,95026 88,490 10,500 38,548 218 134 22,09927 88,268 9,364 36,064 235 107 23,65528 97,748 10,063 36,397 245 124 26,84429 101,552 12,111 36,378 263 137 27,128
平成 27 年度 90,058 9,372 36,285 237 101 24,46828 99,568 10,301 36,206 240 130 27,493
29 年 1~3月 24,676 2,753 8,382 60 36 7,2714~6月 25,950 3,431 9,683 80 32 6,7037~9月 25,394 3,227 8,968 77 27 6,62710~12月 25,532 2,700 9,345 46 42 6,527
29 年 1月 7,942 758 2,867 5 12 2,3052月 7,992 900 2,547 31 11 2,4593月 8,742 1,095 2,968 24 13 2,5074月 8,604 973 3,178 30 12 2,3605月 8,106 1,216 3,082 20 12 2,0296月 9,240 1,242 3,423 30 8 2,3147月 8,815 1,166 2,927 10 7 2,3768月 7,938 1,002 2,934 35 10 1,9719月 8,641 1,059 3,107 32 10 2,28010月 8,668 1,040 3,158 13 13 2,19811月 8,852 1,005 3,243 13 18 2,23712月 8,012 655 2,944 20 11 2,092
フィルム・シートFilm and Sheets
板Plates
合 成 皮 革Syntheticleathers
パイプ・継手Pipes and Pipe
fittings
機械器具部品for Machine
tools and parts
平成 25 年 1,344,216 689,450 7,676 11,337 9,599 160,73826 1,305,029 688,535 3,625 12,087 11,009 152,85427 1,294,352 688,578 4,255 13,085 10,584 157,51228 1,293,758 703,968 4,193 13,852 10,503 166,65729 1,339,525 721,281 4,620 13,808 11,236 178,311
平成 27 年度 1,294,287 688,984 4,279 13,259 10,590 160,061
28 1,310,040 717,050 4,354 13,801 10,639 171,162
29 年 1~3月 321,916 175,894 1,077 3,300 2,649 45,5904~6月 343,226 180,857 1,231 3,536 2,780 43,1467~9月 339,145 177,097 1,093 3,357 2,883 43,26110~12月 335,238 187,433 1,219 3,615 2,924 46,314
29 年 1月 101,441 58,009 339 1,120 842 14,0232月 105,787 57,793 381 1,083 861 15,3343月 114,688 60,092 357 1,097 946 16,2334月 112,290 60,303 391 1,266 896 14,7765月 112,083 59,681 346 1,056 910 13,2036月 118,853 60,873 494 1,214 974 15,1677月 121,139 63,218 516 1,236 980 14,9218月 107,229 54,711 95 970 929 13,4039月 110,777 59,168 482 1,151 974 14,93710月 115,320 64,851 405 1,280 1,004 15,32411月 110,151 60,480 428 1,327 969 15,72012月 109,767 62,102 386 1,008 951 15,270
生 産 品 目 別 消 費 内 訳年 月
10.そ の 他 の 樹 脂
消 費 計Consumption
total
年 月
9.ポ リ カ ー ボ ネ ー ト
消 費 計Consumption
total
生 産 品 目 別 消 費 内 訳
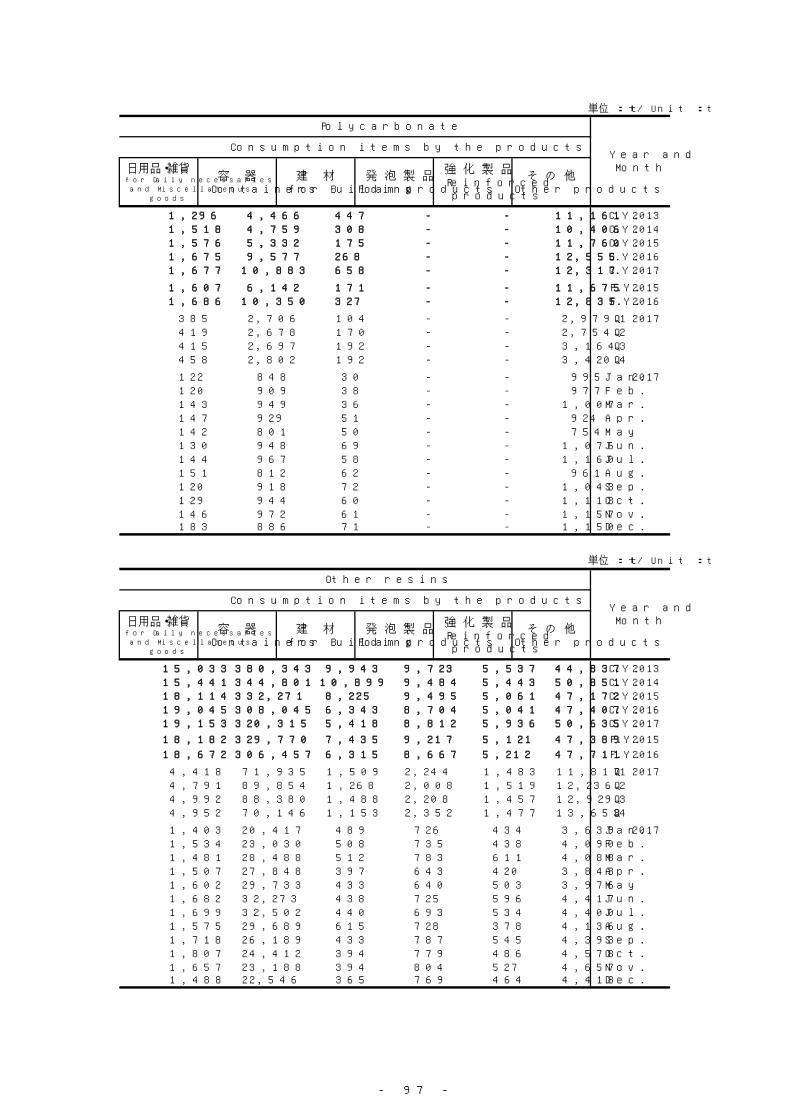
- 97 -
単位 : t / Unit : t
日用品・雑貨for Daily necessariesand Miscellaneous
goods
容 器Containers
建 材for Building
発 泡 製 品Foam products
強 化 製 品Reinforcedproducts
そ の 他Other products
1,296 4,466 447 - - 11,161 C.Y. 20131,518 4,759 308 - - 10,406 C.Y. 20141,576 5,332 175 - - 11,760 C.Y. 20151,675 9,577 268 - - 12,555 C.Y. 20161,677 10,883 658 - - 12,317 C.Y. 2017
1,607 6,142 171 - - 11,675 F.Y. 20151,686 10,350 327 - - 12,835 F.Y. 2016
385 2,706 104 - - 2,979 Q1 2017419 2,678 170 - - 2,754 Q2415 2,697 192 - - 3,164 Q3458 2,802 192 - - 3,420 Q4
122 848 30 - - 995 Jan. 2017120 909 38 - - 977 Feb.143 949 36 - - 1,007 Mar.147 929 51 - - 924 Apr.142 801 50 - - 754 May 130 948 69 - - 1,076 Jun.144 967 58 - - 1,160 Jul.151 812 62 - - 961 Aug.120 918 72 - - 1,043 Sep.129 944 60 - - 1,113 Oct.146 972 61 - - 1,157 Nov.183 886 71 - - 1,150 Dec.
単位 : t / Unit : t
日用品・雑貨for Daily necessariesand Miscellaneous
goods
容 器Containers
建 材for Building
発 泡 製 品Foam products
強 化 製 品Reinforcedproducts
そ の 他Other products
15,033 380,343 9,943 9,723 5,537 44,837 C.Y. 201315,441 344,801 10,899 9,484 5,443 50,851 C.Y. 201418,114 332,271 8,225 9,495 5,061 47,172 C.Y. 201519,045 308,045 6,343 8,704 5,041 47,407 C.Y. 201619,153 320,315 5,418 8,812 5,936 50,635 C.Y. 2017
18,182 329,770 7,435 9,217 5,121 47,389 F.Y. 2015
18,672 306,457 6,315 8,667 5,212 47,711 F.Y. 2016
4,418 71,935 1,509 2,244 1,483 11,817 Q1 20174,791 89,854 1,268 2,008 1,519 12,236 Q24,992 88,380 1,488 2,208 1,457 12,929 Q34,952 70,146 1,153 2,352 1,477 13,653 Q4
1,403 20,417 489 726 434 3,639 Jan. 20171,534 23,030 508 735 438 4,090 Feb.1,481 28,488 512 783 611 4,088 Mar.1,507 27,848 397 643 420 3,843 Apr.1,602 29,733 433 640 503 3,976 May 1,682 32,273 438 725 596 4,417 Jun.1,699 32,502 440 693 534 4,400 Jul.1,575 29,689 615 728 378 4,136 Aug.1,718 26,189 433 787 545 4,393 Sep.1,807 24,412 394 779 486 4,578 Oct.1,657 23,188 394 804 527 4,657 Nov.1,488 22,546 365 769 464 4,418 Dec.
Consumption items by the products
Other resins
Year andMonth
Polycarbonate
Year andMonth
Consumption items by the products
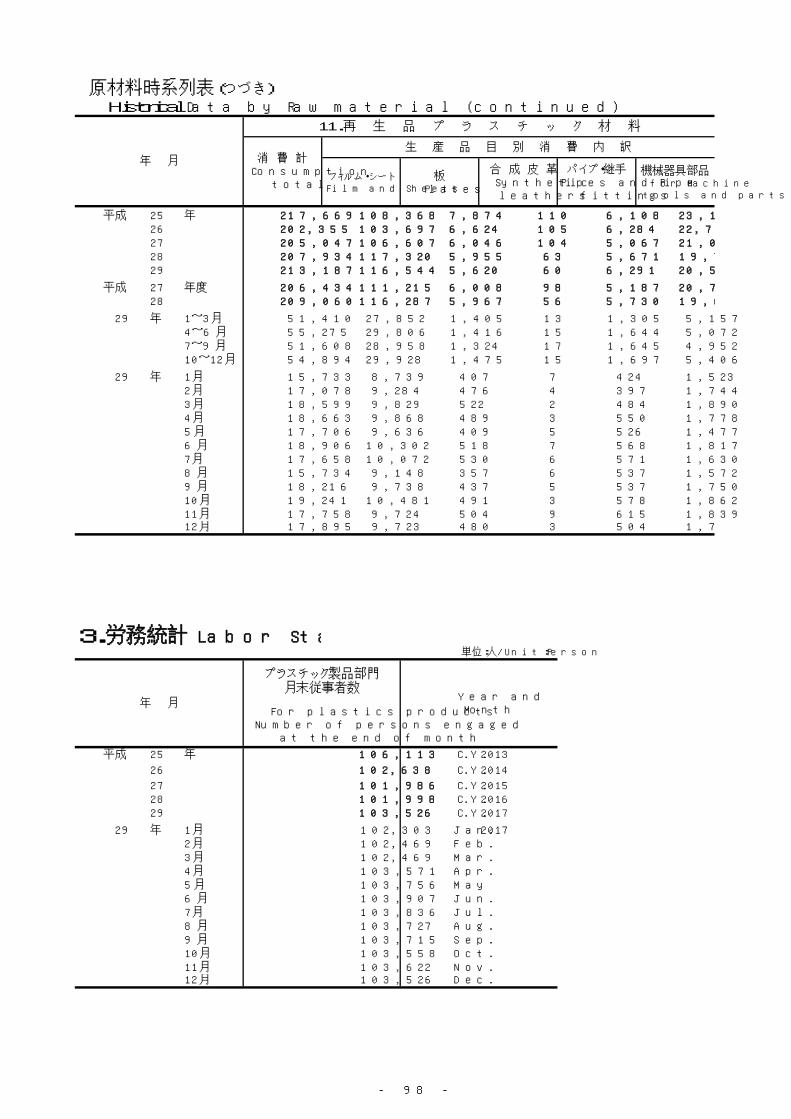
- 98 -
原材料時系列表(つづき) Historical Data by Raw material (continued)
フィルム・シートFilm and Sheets
板Plates
合 成 皮 革Syntheticleathers
パイプ・継手Pipes and Pipe
fittings
機械器具部品for Machine
tools and parts
平成 25 年 217,669 108,368 7,874 110 6,108 23,19526 202,355 103,697 6,624 105 6,284 22,76427 205,047 106,607 6,046 104 5,067 21,06228 207,934 117,320 5,955 63 5,671 19,71829 213,187 116,544 5,620 60 6,291 20,587
平成 27 年度 206,434 111,215 6,008 98 5,187 20,71928 209,060 116,287 5,967 56 5,730 19,620
29 年 1~3月 51,410 27,852 1,405 13 1,305 5,1574~6月 55,275 29,806 1,416 15 1,644 5,0727~9月 51,608 28,958 1,324 17 1,645 4,95210~12月 54,894 29,928 1,475 15 1,697 5,406
29 年 1月 15,733 8,739 407 7 424 1,5232月 17,078 9,284 476 4 397 1,7443月 18,599 9,829 522 2 484 1,8904月 18,663 9,868 489 3 550 1,7785月 17,706 9,636 409 5 526 1,4776月 18,906 10,302 518 7 568 1,8177月 17,658 10,072 530 6 571 1,6308月 15,734 9,148 357 6 537 1,5729月 18,216 9,738 437 5 537 1,75010月 19,241 10,481 491 3 578 1,86211月 17,758 9,724 504 9 615 1,83912月 17,895 9,723 480 3 504 1,705
3.労務統計 Labor Statistics
平成 25 年 106,113 C.Y. 2013
26 102,638 C.Y. 2014
27 101,986 C.Y. 201528 101,998 C.Y. 201629 103,526 C.Y. 2017
29 年 1月 102,303 Jan. 20172月 102,469 Feb.3月 102,469 Mar.4月 103,571 Apr.5月 103,756 May 6月 103,907 Jun.7月 103,836 Jul.8月 103,727 Aug.9月 103,715 Sep.10月 103,558 Oct.11月 103,622 Nov.12月 103,526 Dec.
単位:人/Unit:Person
年 月
プラスチック製品部門月末従事者数
Year andMonthFor plastics products
Number of persons engaged at the end of month
年 月
11.再 生 品 プ ラ ス チ ッ ク 材 料
消 費 計Consumption
total
生 産 品 目 別 消 費 内 訳
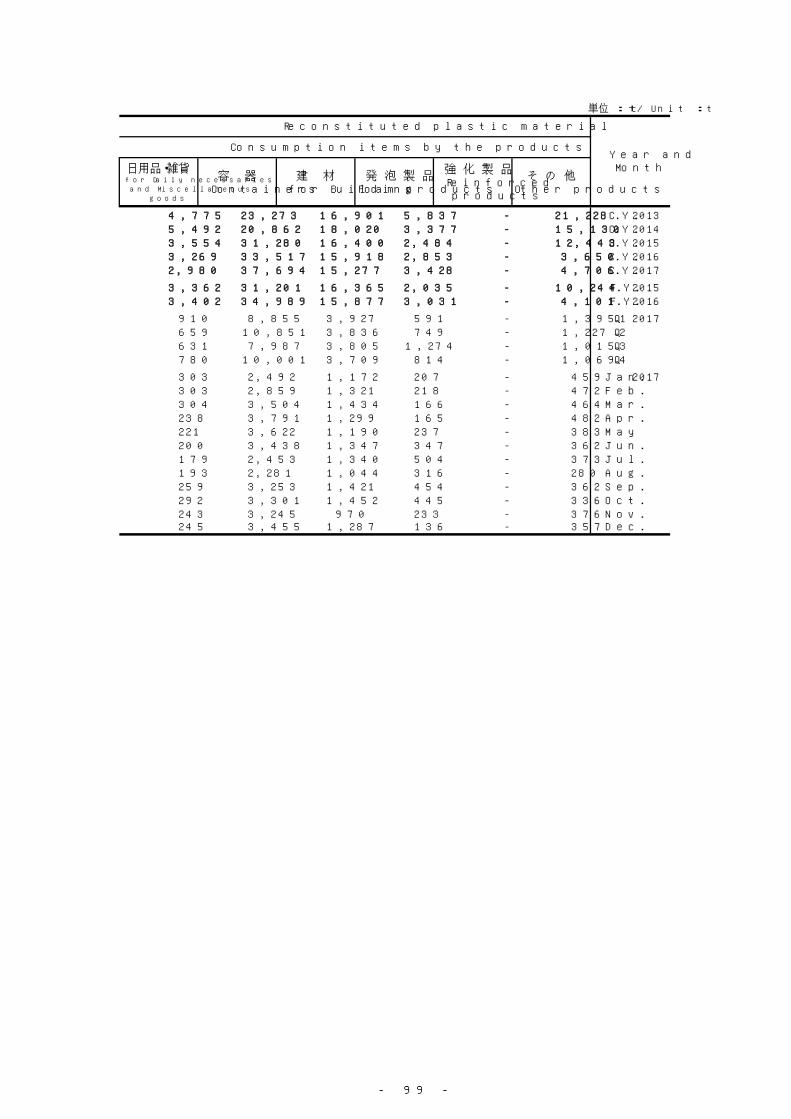
- 99 -
単位 : t / Unit : t
日用品・雑貨for Daily necessariesand Miscellaneous
goods
容 器Containers
建 材for Building
発 泡 製 品Foam products
強 化 製 品Reinforcedproducts
そ の 他Other products
4,775 23,273 16,901 5,837 - 21,228 C.Y. 20135,492 20,862 18,020 3,377 - 15,130 C.Y. 20143,554 31,280 16,400 2,484 - 12,443 C.Y. 20153,269 33,517 15,918 2,853 - 3,650 C.Y. 20162,980 37,694 15,277 3,428 - 4,706 C.Y. 2017
3,362 31,201 16,365 2,035 - 10,244 F.Y. 20153,402 34,989 15,877 3,031 - 4,101 F.Y. 2016
910 8,855 3,927 591 - 1,395 Q1 2017659 10,851 3,836 749 - 1,227 Q2631 7,987 3,805 1,274 - 1,015 Q3780 10,001 3,709 814 - 1,069 Q4
303 2,492 1,172 207 - 459 Jan. 2017303 2,859 1,321 218 - 472 Feb.304 3,504 1,434 166 - 464 Mar.238 3,791 1,299 165 - 482 Apr.221 3,622 1,190 237 - 383 May 200 3,438 1,347 347 - 362 Jun.179 2,453 1,340 504 - 373 Jul.193 2,281 1,044 316 - 280 Aug.259 3,253 1,421 454 - 362 Sep.292 3,301 1,452 445 - 336 Oct.243 3,245 970 233 - 376 Nov.245 3,455 1,287 136 - 357 Dec.
Reconstituted plastic material
Year andMonth
Consumption items by the products
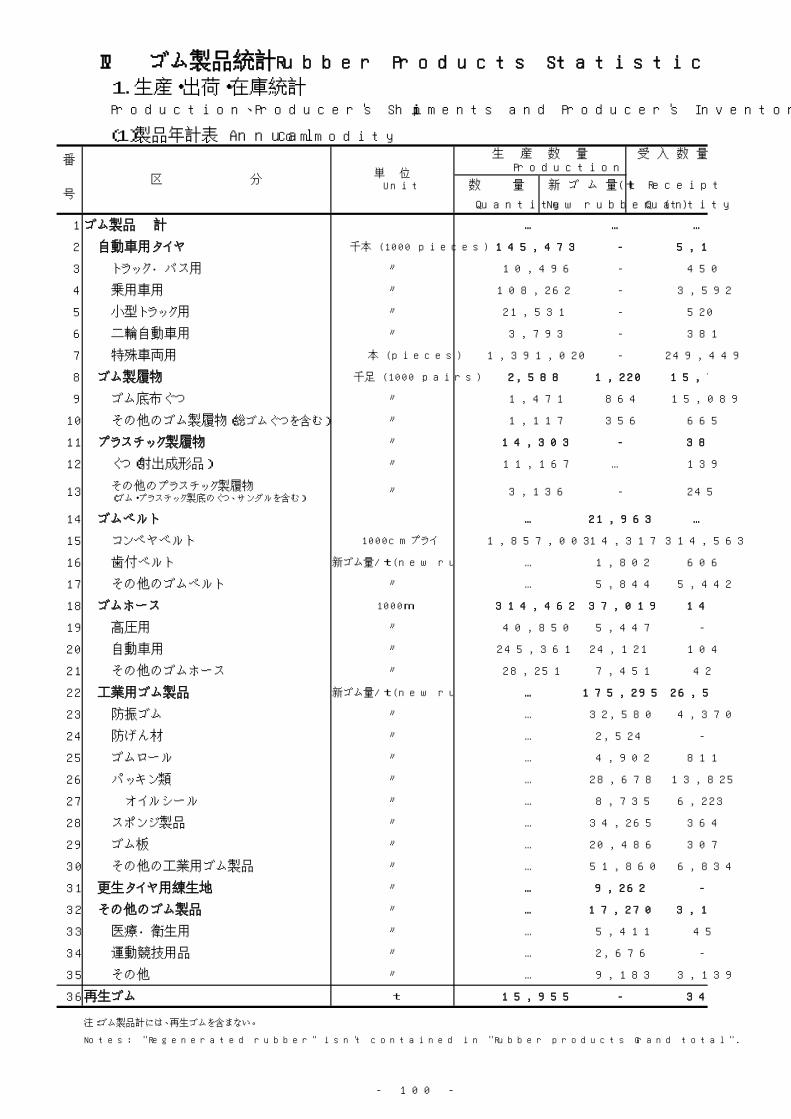
- 100 -
Ⅳ ゴム製品統計 Rubber Products Statistics
(1)製品年計表 Annual Commodity受 入 数 量
数 量 新 ゴ ム 量(t) Receipt
Quantity New rubber (t) Quantity
1 ゴム製品 計 … … …
2 自動車用タイヤ 千本 (1000 pieces) 145,473 - 5,191
3 トラック・バス用 〃 10,496 - 450
4 乗用車用 〃 108,262 - 3,592
5 小型トラック用 〃 21,531 - 520
6 二輪自動車用 〃 3,793 - 381
7 特殊車両用 本 (pieces) 1,391,020 - 249,449
8 ゴム製履物 千足 (1000 pairs) 2,588 1,220 15,754
9 ゴム底布ぐつ 〃 1,471 864 15,089
10 その他のゴム製履物(総ゴムぐつを含む) 〃 1,117 356 665
11 プラスチック製履物 〃 14,303 - 384
12 くつ(射出成形品) 〃 11,167 … 139
13 その他のプラスチック製履物(ゴム・プラスチック製底のくつ、サンダルを含む)
〃 3,136 - 245
14 ゴムベルト … 21,963 …
15 コンベヤベルト 1000cmプライ 1,857,003 14,317 314,563
16 歯付ベルト 新ゴム量/t (new rubber/t) … 1,802 606
17 その他のゴムベルト 〃 … 5,844 5,442
18 ゴムホース 1000m 314,462 37,019 146
19 高圧用 〃 40,850 5,447 -
20 自動車用 〃 245,361 24,121 104
21 その他のゴムホース 〃 28,251 7,451 42
22 工業用ゴム製品 新ゴム量/t (new rubber/t) … 175,295 26,511
23 防振ゴム 〃 … 32,580 4,370
24 防げん材 〃 … 2,524 -
25 ゴムロール 〃 … 4,902 811
26 パッキン類 〃 … 28,678 13,825
27 オイルシール 〃 … 8,735 6,223
28 スポンジ製品 〃 … 34,265 364
29 ゴム板 〃 … 20,486 307
30 その他の工業用ゴム製品 〃 … 51,860 6,834
31 更生タイヤ用練生地 〃 … 9,262 -
32 その他のゴム製品 〃 … 17,270 3,184
33 医療・衛生用 〃 … 5,411 45
34 運動競技用品 〃 … 2,676 -
35 その他 〃 … 9,183 3,139
36 再生ゴム t 15,955 - 343
注:ゴム製品計には、再生ゴムを含まない。
Notes: "Regenerated rubber" isn't contained in "Rubber products Grand total".
1.生産・出荷・在庫統計 Production、Producer's Shipments and Producer's Inventory of Finished Goods
番
区 分単 位
Unit
生 産 数 量Production
号
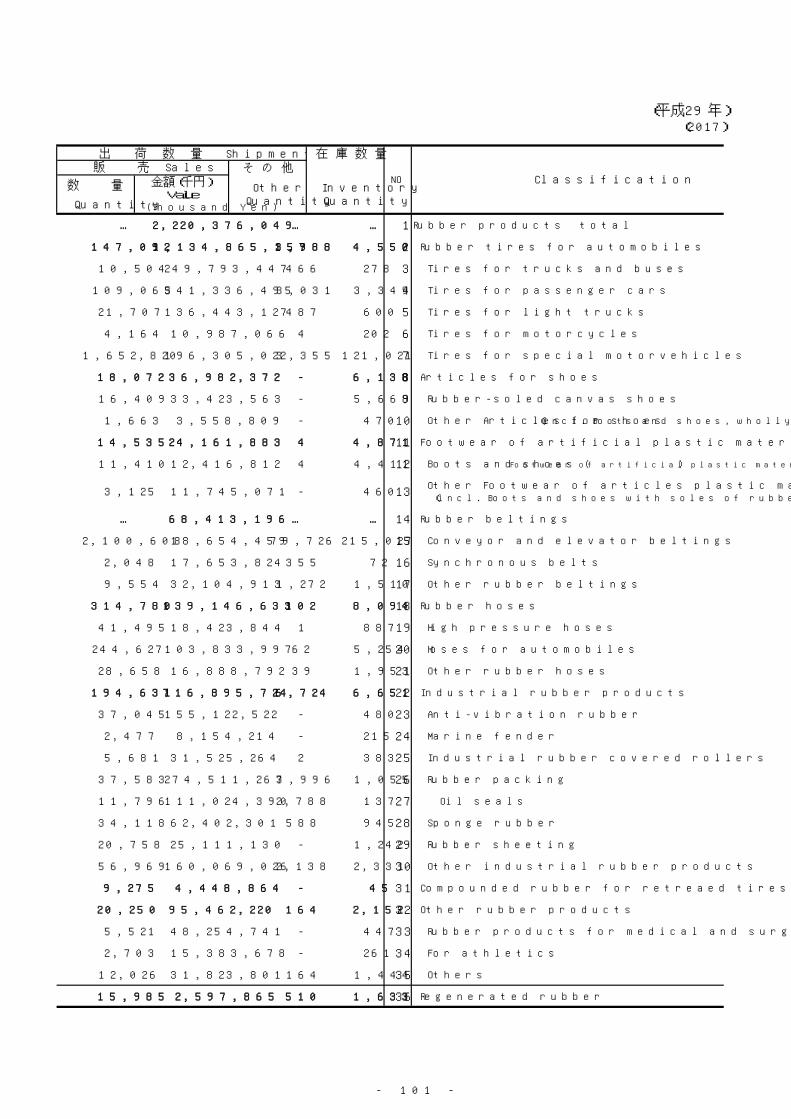
- 101 -
(平成29年)(2017)
在 庫 数 量そ の 他
数 量
Quantity
… 2,220,376,049 … … 1 Rubber products total
147,092 1,134,865,157 3,988 4,550 2 Rubber tires for automobiles
10,504 249,793,447 466 278 3 Tires for trucks and buses
109,063 541,336,495 3,031 3,349 4 Tires for passenger cars
21,707 136,443,127 487 600 5 Tires for light trucks
4,164 10,987,066 4 202 6 Tires for motorcycles
1,652,820 196,305,022 3,355 121,021 7 Tires for special motorvehicles
18,072 36,982,372 - 6,138 8 Articles for shoes
16,409 33,423,563 - 5,668 9 Rubber-soled canvas shoes
1,663 3,558,809 - 470 10 Other Articles for shoes(incl. Boots and shoes, wholly of rubber)
14,535 24,161,883 4 4,871 11 Footwear of artificial plastic materials
11,410 12,416,812 4 4,411 12 Boots and shoes (Footwear of artificial plastic materials (injected))
3,125 11,745,071 - 460 13 Other Footwear of articles plastic materials (incl. Boots and shoes with soles of rubber and plastic, sandals)
… 68,413,196 … … 14 Rubber beltings
2,100,608 18,654,459 79,726 215,027 15 Conveyor and elevator beltings
2,048 17,653,824 355 72 16 Synchronous belts
9,554 32,104,913 1,272 1,510 17 Other rubber beltings
314,780 139,146,633 102 8,094 18 Rubber hoses
41,495 18,423,844 1 887 19 High pressure hoses
244,627 103,833,997 62 5,254 20 Hoses for automobiles
28,658 16,888,792 39 1,953 21 Other rubber hoses
194,631 716,895,724 6,724 6,651 22 Industrial rubber products
37,045 155,122,522 - 480 23 Anti-vibration rubber
2,477 8,154,214 - 215 24 Marine fender
5,681 31,525,264 2 383 25 Industrial rubber covered rollers
37,583 274,511,267 3,996 1,055 26 Rubber packing
11,796 111,024,390 2,788 137 27 Oil seals
34,118 62,402,301 588 945 28 Sponge rubber
20,758 25,111,130 - 1,242 29 Rubber sheeting
56,969 160,069,026 2,138 2,331 30 Other industrial rubber products
9,275 4,448,864 - 45 31 Compounded rubber for retreaed tires and recapped tires
20,250 95,462,220 164 2,152 32 Other rubber products
5,521 48,254,741 - 447 33 Rubber products for medical and surgical dressings
2,703 15,383,678 - 261 34 For athletics
12,026 31,823,801 164 1,444 35 Others
15,985 2,597,865 510 1,633 36 Regenerated rubber
出 荷 数 量 Shipment
NO Classification販 売 Sales
金額(千円)Value
(Thousand Yen)
OtherQuantity
InventoryQuantity
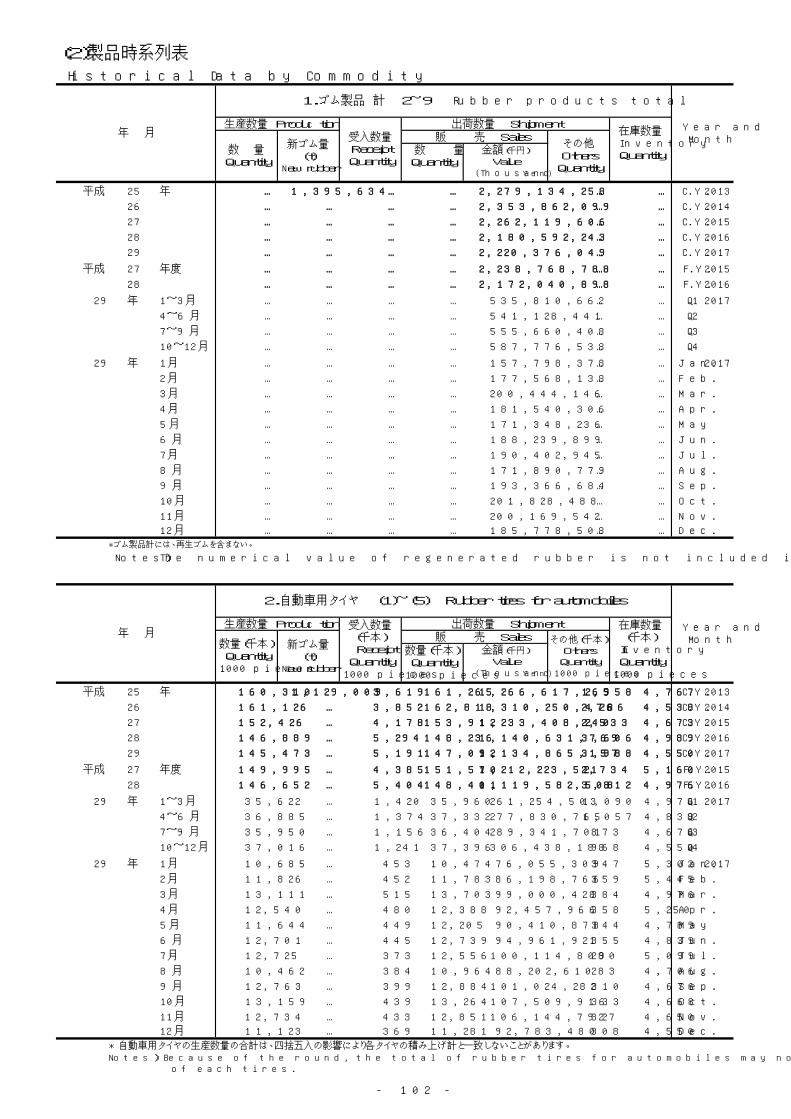
- 102 -
(2)製品時系列表
Historical Data by Commodity
平成 25 年 … 1,395,634 … … 2,279,134,258 … … C.Y. 2013
26 … … … … 2,353,862,099 … … C.Y. 2014
27 … … … … 2,262,119,606 … … C.Y. 2015
28 … … … … 2,180,592,243 … … C.Y. 2016
29 … … … … 2,220,376,049 … … C.Y. 2017
平成 27 年度 … … … … 2,238,768,788 … … F.Y. 2015
28 … … … … 2,172,040,898 … … F.Y. 2016
29 年 1~3月 … … … … 535,810,662 … … Q1 2017
4~6月 … … … … 541,128,441 … … Q2
7~9月 … … … … 555,660,408 … … Q3
10~12月 … … … … 587,776,538 … … Q4
29 年 1月 … … … … 157,798,378 … … Jan. 2017
2月 … … … … 177,568,138 … … Feb.
3月 … … … … 200,444,146 … … Mar.
4月 … … … … 181,540,306 … … Apr.
5月 … … … … 171,348,236 … … May
6月 … … … … 188,239,899 … … Jun.
7月 … … … … 190,402,945 … … Jul.
8月 … … … … 171,890,779 … … Aug.
9月 … … … … 193,366,684 … … Sep.
10月 … … … … 201,828,488 … … Oct.
11月 … … … … 200,169,542 … … Nov.
12月 … … … … 185,778,508 … … Dec.*ゴム製品計には、再生ゴムを含まない。
Notes)
平成 25 年 160,310 1,129,009 3,619 161,265 1,266,617,265 1,958 4,767 C.Y. 2013
26 161,126 … 3,852 162,818 1,310,250,478 2,266 4,538 C.Y. 2014
27 152,426 … 4,178 153,912 1,233,408,240 2,533 4,673 C.Y. 2015
28 146,889 … 5,294 148,236 1,140,631,769 3,606 4,989 C.Y. 2016
29 145,473 … 5,191 147,092 1,134,865,157 3,988 4,550 C.Y. 2017
平成 27 年度 149,995 … 4,385 151,570 1,212,223,521 2,734 5,160 F.Y. 2015
28 146,652 … 5,404 148,401 1,119,582,508 3,812 4,976 F.Y. 2016
29 年 1~3月 35,622 … 1,420 35,960 261,254,503 1,090 4,976 Q1 2017
4~6月 36,885 … 1,374 37,332 277,830,765 1,057 4,839 Q2
7~9月 35,950 … 1,156 36,404 289,341,701 873 4,676 Q3
10~12月 37,016 … 1,241 37,396 306,438,188 968 4,550 Q4
29 年 1月 10,685 … 453 10,474 76,055,309 347 5,302 Jan. 2017
2月 11,826 … 452 11,783 86,198,766 359 5,445 Feb.
3月 13,111 … 515 13,703 99,000,428 384 4,976 Mar.
4月 12,540 … 480 12,388 92,457,966 358 5,250 Apr.
5月 11,644 … 449 12,205 90,410,878 344 4,789 May
6月 12,701 … 445 12,739 94,961,921 355 4,839 Jun.
7月 12,725 … 373 12,556 100,114,809 280 5,099 Jul.
8月 10,462 … 384 10,964 88,202,610 283 4,706 Aug.
9月 12,763 … 399 12,884 101,024,282 310 4,676 Sep.
10月 13,159 … 439 13,264 107,509,916 333 4,668 Oct.
11月 12,734 … 433 12,851 106,144,792 327 4,650 Nov.
12月 11,123 … 369 11,281 92,783,480 308 4,550 Dec.
*自動車用タイヤの生産数量の合計は、四捨五入の影響により各タイヤの積み上げ計と一致しないことがあります。
年 月
1.ゴム製品 計 2~9 Rubber products total
Year andMonth
生産数量 Production 受入数量ReceiptQuantity
出荷数量 Shipment在庫数量InventoryQuantity
数 量Quantity
新ゴム量(t)
New rubber
販 売 Salesその他Others
Quantity
数 量Quantity
金額(千円)
Value(Thousand Yen)
The numerical value of regenerated rubber is not included in the rubber product total.
年 月
2.自動車用タイヤ (1)~(5) Rubber tires for automobiles
Year andMonth
生産数量 Production 受入数量(千本)
ReceiptQuantity
1000 pieces
出荷数量 Shipment 在庫数量(千本)
InventoryQuantity
1000 pieces
数量(千本)Quantity
1000 pieces
新ゴム量(t)
New rubber
販 売 Sales その他(千本)Others
Quantity1000 pieces
数量(千本)Quantity
1000 pieces
金額(千円)
Value(Thousand Yen)
Notes) Because of the round, the total of rubber tires for automobiles may not accord with the total that piled up the numerical value of each tires.
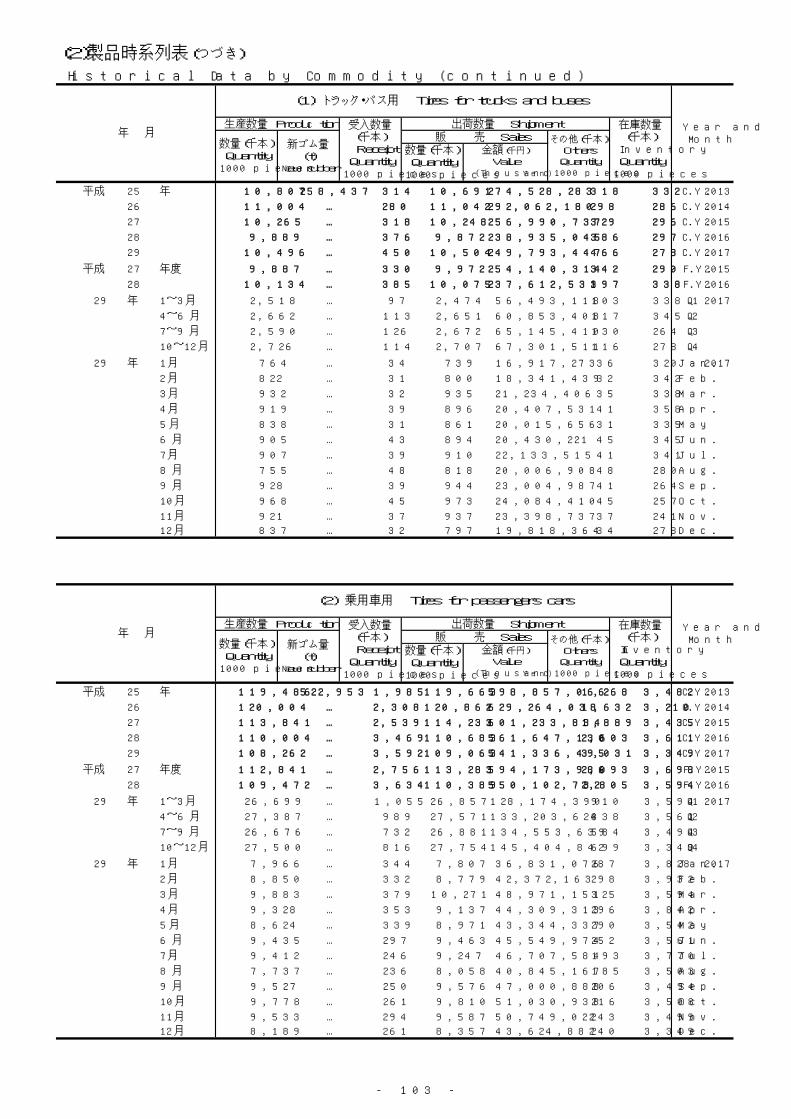
- 103 -
(2)製品時系列表(つづき)
Historical Data by Commodity (continued)
平成 25 年 10,807 258,437 314 10,691 274,528,283 318 332 C.Y. 2013
26 11,004 … 280 11,042 292,062,180 298 286 C.Y. 2014
27 10,265 … 318 10,248 256,990,737 329 296 C.Y. 2015
28 9,889 … 376 9,872 238,935,045 386 297 C.Y. 2016
29 10,496 … 450 10,504 249,793,447 466 278 C.Y. 2017
平成 27 年度 9,887 … 330 9,972 254,140,314 342 290 F.Y. 2015
28 10,134 … 385 10,075 237,612,531 397 338 F.Y. 2016
29 年 1~3月 2,518 … 97 2,474 56,493,118 103 338 Q1 2017
4~6月 2,662 … 113 2,651 60,853,408 117 345 Q2
7~9月 2,590 … 126 2,672 65,145,410 130 264 Q3
10~12月 2,726 … 114 2,707 67,301,511 116 278 Q4
29 年 1月 764 … 34 739 16,917,273 36 320 Jan. 2017
2月 822 … 31 800 18,341,439 32 342 Feb.
3月 932 … 32 935 21,234,406 35 338 Mar.
4月 919 … 39 896 20,407,531 41 358 Apr.
5月 838 … 31 861 20,015,656 31 335 May
6月 905 … 43 894 20,430,221 45 345 Jun.
7月 907 … 39 910 22,133,515 41 341 Jul.
8月 755 … 48 818 20,006,908 48 280 Aug.
9月 928 … 39 944 23,004,987 41 264 Sep.
10月 968 … 45 973 24,084,410 45 257 Oct.
11月 921 … 37 937 23,398,737 37 241 Nov.
12月 837 … 32 797 19,818,364 34 278 Dec.
平成 25 年 119,486 522,953 1,985 119,663 598,857,066 1,268 3,482 C.Y. 2013
26 120,004 … 2,308 120,862 629,264,038 1,632 3,210 C.Y. 2014
27 113,841 … 2,539 114,233 601,233,834 1,889 3,435 C.Y. 2015
28 110,004 … 3,469 110,683 561,647,130 2,603 3,611 C.Y. 2016
29 108,262 … 3,592 109,063 541,336,495 3,031 3,349 C.Y. 2017
平成 27 年度 112,841 … 2,756 113,283 594,173,986 2,093 3,698 F.Y. 2015
28 109,472 … 3,634 110,389 550,102,732 2,805 3,594 F.Y. 2016
29 年 1~3月 26,699 … 1,055 26,857 128,174,390 910 3,594 Q1 2017
4~6月 27,387 … 989 27,571 133,203,624 838 3,561 Q2
7~9月 26,676 … 732 26,881 134,553,639 584 3,494 Q3
10~12月 27,500 … 816 27,754 145,404,842 699 3,349 Q4
29 年 1月 7,966 … 344 7,807 36,831,076 287 3,828 Jan. 2017
2月 8,850 … 332 8,779 42,372,163 298 3,932 Feb.
3月 9,883 … 379 10,271 48,971,151 325 3,594 Mar.
4月 9,328 … 353 9,137 44,309,313 296 3,842 Apr.
5月 8,624 … 339 8,971 43,344,337 290 3,542 May
6月 9,435 … 297 9,463 45,549,974 252 3,561 Jun.
7月 9,412 … 246 9,247 46,707,584 193 3,770 Jul.
8月 7,737 … 236 8,058 40,845,167 185 3,503 Aug.
9月 9,527 … 250 9,576 47,000,888 206 3,494 Sep.
10月 9,778 … 261 9,810 51,030,938 216 3,508 Oct.
11月 9,533 … 294 9,587 50,749,022 243 3,499 Nov.
12月 8,189 … 261 8,357 43,624,882 240 3,349 Dec.
年 月
(1) トラック・バス用 Tires for trucks and buses
Year andMonth
生産数量 Production 受入数量(千本)
ReceiptQuantity
1000 pieces
出荷数量 Shipment 在庫数量(千本)
InventoryQuantity
1000 pieces
販 売 Sales その他(千本)Others
Quantity1000 pieces
数量(千本)Quantity
1000 pieces
新ゴム量(t)
New rubber
数量(千本)Quantity
1000 pieces
金額(千円)
Value(Thousand Yen)
年 月
(2) 乗用車用 Tires for passengers cars
Year andMonth
生産数量 Production 受入数量(千本)
ReceiptQuantity
1000 pieces
出荷数量 Shipment 在庫数量(千本)
InventoryQuantity
1000 pieces
販 売 Sales その他(千本)Others
Quantity1000 pieces
数量(千本)Quantity
1000 pieces
新ゴム量(t)
New rubber
数量(千本)Quantity
1000 pieces
金額(千円)
Value(Thousand Yen)
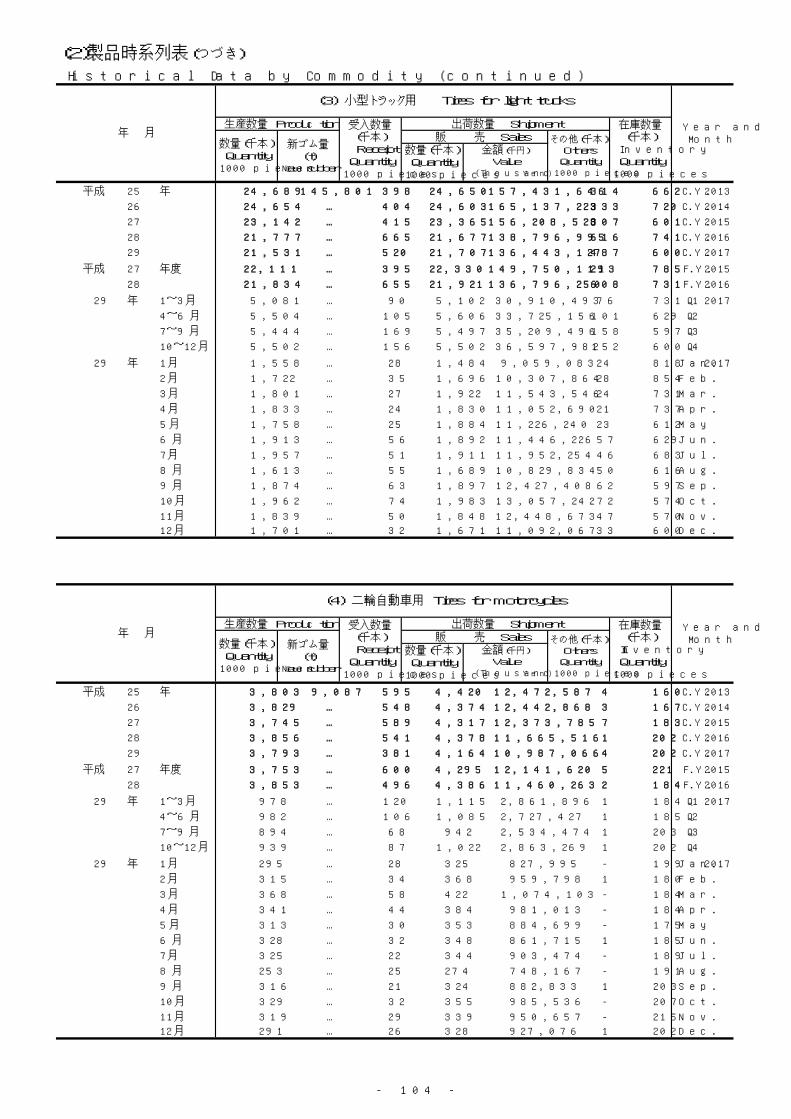
- 104 -
(2)製品時系列表(つづき)
Historical Data by Commodity (continued)
平成 25 年 24,689 145,801 398 24,650 157,431,646 314 662 C.Y. 2013
26 24,654 … 404 24,603 165,137,223 333 720 C.Y. 2014
27 23,142 … 415 23,365 156,208,528 307 601 C.Y. 2015
28 21,777 … 665 21,677 138,796,995 616 741 C.Y. 2016
29 21,531 … 520 21,707 136,443,127 487 600 C.Y. 2017
平成 27 年度 22,111 … 395 22,330 149,750,111 293 785 F.Y. 2015
28 21,834 … 655 21,921 136,796,250 608 731 F.Y. 2016
29 年 1~3月 5,081 … 90 5,102 30,910,493 76 731 Q1 2017
4~6月 5,504 … 105 5,606 33,725,156 101 629 Q2
7~9月 5,444 … 169 5,497 35,209,496 158 597 Q3
10~12月 5,502 … 156 5,502 36,597,982 152 600 Q4
29 年 1月 1,558 … 28 1,484 9,059,083 24 818 Jan. 2017
2月 1,722 … 35 1,696 10,307,864 28 854 Feb.
3月 1,801 … 27 1,922 11,543,546 24 731 Mar.
4月 1,833 … 24 1,830 11,052,690 21 737 Apr.
5月 1,758 … 25 1,884 11,226,240 23 612 May
6月 1,913 … 56 1,892 11,446,226 57 629 Jun.
7月 1,957 … 51 1,911 11,952,254 46 683 Jul.
8月 1,613 … 55 1,689 10,829,834 50 616 Aug.
9月 1,874 … 63 1,897 12,427,408 62 597 Sep.
10月 1,962 … 74 1,983 13,057,242 72 574 Oct.
11月 1,839 … 50 1,848 12,448,673 47 570 Nov.
12月 1,701 … 32 1,671 11,092,067 33 600 Dec.
平成 25 年 3,803 9,087 595 4,420 12,472,587 4 160 C.Y. 2013
26 3,829 … 548 4,374 12,442,868 3 167 C.Y. 2014
27 3,745 … 589 4,317 12,373,785 7 183 C.Y. 2015
28 3,856 … 541 4,378 11,665,516 1 202 C.Y. 2016
29 3,793 … 381 4,164 10,987,066 4 202 C.Y. 2017
平成 27 年度 3,753 … 600 4,295 12,141,620 5 221 F.Y. 2015
28 3,853 … 496 4,386 11,460,263 2 184 F.Y. 2016
29 年 1~3月 978 … 120 1,115 2,861,896 1 184 Q1 2017
4~6月 982 … 106 1,085 2,727,427 1 185 Q2
7~9月 894 … 68 942 2,534,474 1 203 Q3
10~12月 939 … 87 1,022 2,863,269 1 202 Q4
29 年 1月 295 … 28 325 827,995 - 199 Jan. 2017
2月 315 … 34 368 959,798 1 180 Feb.
3月 368 … 58 422 1,074,103 - 184 Mar.
4月 341 … 44 384 981,013 - 184 Apr.
5月 313 … 30 353 884,699 - 175 May
6月 328 … 32 348 861,715 1 185 Jun.
7月 325 … 22 344 903,474 - 189 Jul.
8月 253 … 25 274 748,167 - 191 Aug.
9月 316 … 21 324 882,833 1 203 Sep.
10月 329 … 32 355 985,536 - 207 Oct.
11月 319 … 29 339 950,657 - 215 Nov.
12月 291 … 26 328 927,076 1 202 Dec.
年 月
(3) 小型トラック用 Tires for light trucks
Year andMonth
出荷数量 Shipment 在庫数量(千本)
InventoryQuantity
1000 pieces
生産数量 Production 受入数量(千本)
ReceiptQuantity
1000 pieces
数量(千本)Quantity
1000 pieces
新ゴム量(t)
New rubber
販 売 Sales その他(千本)Others
Quantity1000 pieces
数量(千本)Quantity
1000 pieces
金額(千円)
Value(Thousand Yen)
年 月
(4) 二輪自動車用 Tires for motorcycles
Year andMonth
出荷数量 Shipment 在庫数量(千本)
InventoryQuantity
1000 pieces
生産数量 Production 受入数量(千本)
ReceiptQuantity
1000 pieces
数量(千本)Quantity
1000 pieces
新ゴム量(t)
New rubber
販 売 Sales その他(千本)Others
Quantity1000 pieces
数量(千本)Quantity
1000 pieces
金額(千円)
Value(Thousand Yen)
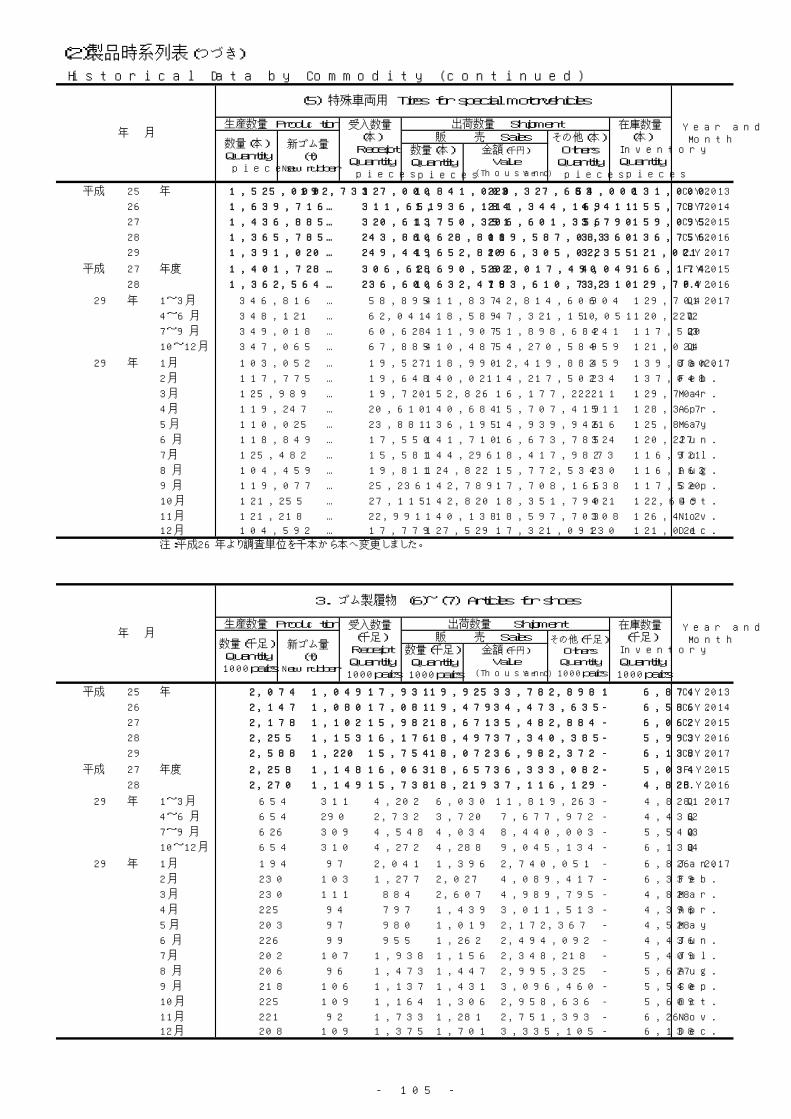
- 105 -
(2)製品時系列表(つづき)
Historical Data by Commodity (continued)
平成 25 年 1,525,000 192,731 327,000 1,841,000 223,327,683 54,000 131,000 C.Y. 2013
26 1,639,716 … 311,651 1,936,184 211,344,169 4,411 155,787 C.Y. 2014
27 1,436,885 … 320,613 1,750,351 206,601,356 3,790 159,095 C.Y. 2015
28 1,365,785 … 243,860 1,628,801 189,587,083 3,360 136,756 C.Y. 2016
29 1,391,020 … 249,449 1,652,820 196,305,022 3,355 121,021 C.Y. 2017
平成 27 年度 1,401,728 … 306,628 1,690,562 202,017,490 4,049 166,174 F.Y. 2015
28 1,362,564 … 236,600 1,632,479 183,610,732 3,310 129,704 F.Y. 2016
29 年 1~3月 346,816 … 58,895 411,837 42,814,606 904 129,704 Q1 2017
4~6月 348,121 … 62,041 418,589 47,321,150 1,051 120,227 Q2
7~9月 349,018 … 60,628 411,907 51,898,682 441 117,520 Q3
10~12月 347,065 … 67,885 410,487 54,270,584 959 121,021 Q4
29 年 1月 103,052 … 19,527 118,990 12,419,882 459 139,880 Jan. 2017
2月 117,775 … 19,648 140,021 14,217,502 234 137,048 Feb.
3月 125,989 … 19,720 152,826 16,177,222 211 129,704 Mar.
4月 119,247 … 20,610 140,684 15,707,419 511 128,367 Apr.
5月 110,025 … 23,881 136,195 14,939,946 216 125,867 May
6月 118,849 … 17,550 141,710 16,673,785 324 120,227 Jun.
7月 125,482 … 15,581 144,296 18,417,982 73 116,921 Jul.
8月 104,459 … 19,811 124,822 15,772,534 230 116,162 Aug.
9月 119,077 … 25,236 142,789 17,708,166 138 117,520 Sep.
10月 121,255 … 27,115 142,820 18,351,790 421 122,649 Oct.
11月 121,218 … 22,991 140,138 18,597,703 308 126,412 Nov.
12月 104,592 … 17,779 127,529 17,321,091 230 121,021 Dec.
注:平成26年より調査単位を千本から本へ変更しました。
平成 25 年 2,074 1,049 17,931 19,925 33,782,898 1 6,874 C.Y. 2013
26 2,147 1,080 17,081 19,479 34,473,635 - 6,586 C.Y. 2014
27 2,178 1,102 15,982 18,671 35,482,884 - 6,062 C.Y. 2015
28 2,255 1,153 16,176 18,497 37,340,385 - 5,993 C.Y. 2016
29 2,588 1,220 15,754 18,072 36,982,372 - 6,138 C.Y. 2017
平成 27 年度 2,258 1,148 16,063 18,657 36,333,082 - 5,034 F.Y. 2015
28 2,270 1,149 15,738 18,219 37,116,129 - 4,828 F.Y. 2016
29 年 1~3月 654 311 4,202 6,030 11,819,263 - 4,828 Q1 2017
4~6月 654 290 2,732 3,720 7,677,972 - 4,436 Q2
7~9月 626 309 4,548 4,034 8,440,003 - 5,540 Q3
10~12月 654 310 4,272 4,288 9,045,134 - 6,138 Q4
29 年 1月 194 97 2,041 1,396 2,740,051 - 6,826 Jan. 2017
2月 230 103 1,277 2,027 4,089,417 - 6,339 Feb.
3月 230 111 884 2,607 4,989,795 - 4,828 Mar.
4月 225 94 797 1,439 3,011,513 - 4,396 Apr.
5月 203 97 980 1,019 2,172,367 - 4,528 May
6月 226 99 955 1,262 2,494,092 - 4,436 Jun.
7月 202 107 1,938 1,156 2,348,218 - 5,409 Jul.
8月 206 96 1,473 1,447 2,995,325 - 5,627 Aug.
9月 218 106 1,137 1,431 3,096,460 - 5,540 Sep.
10月 225 109 1,164 1,306 2,958,636 - 5,609 Oct.
11月 221 92 1,733 1,281 2,751,393 - 6,268 Nov.
12月 208 109 1,375 1,701 3,335,105 - 6,138 Dec.
年 月
(5) 特殊車両用 Tires for special motorvehicles
Year andMonth
生産数量 Production 受入数量(本)
ReceiptQuantity
pieces
出荷数量 Shipment 在庫数量(本)
InventoryQuantity
pieces
数量(本)Quantity
pieces
新ゴム量(t)
New rubber
販 売 Sales その他(本)Others
Quantitypieces
数量(本)Quantity
pieces
金額(千円)
Value(Thousand Yen)
年 月
3. ゴム製履物 (6)~(7) Articles for shoes
Year andMonth
生産数量 Production 受入数量(千足)
ReceiptQuantity1000pairs
出荷数量 Shipment 在庫数量(千足)
InventoryQuantity1000pairs
数量(千足)Quantity1000pairs
新ゴム量(t)
New rubber
販 売 Sales その他(千足)Others
Quantity1000pairs
数量(千足)Quantity1000pairs
金額(千円)
Value(Thousand Yen)
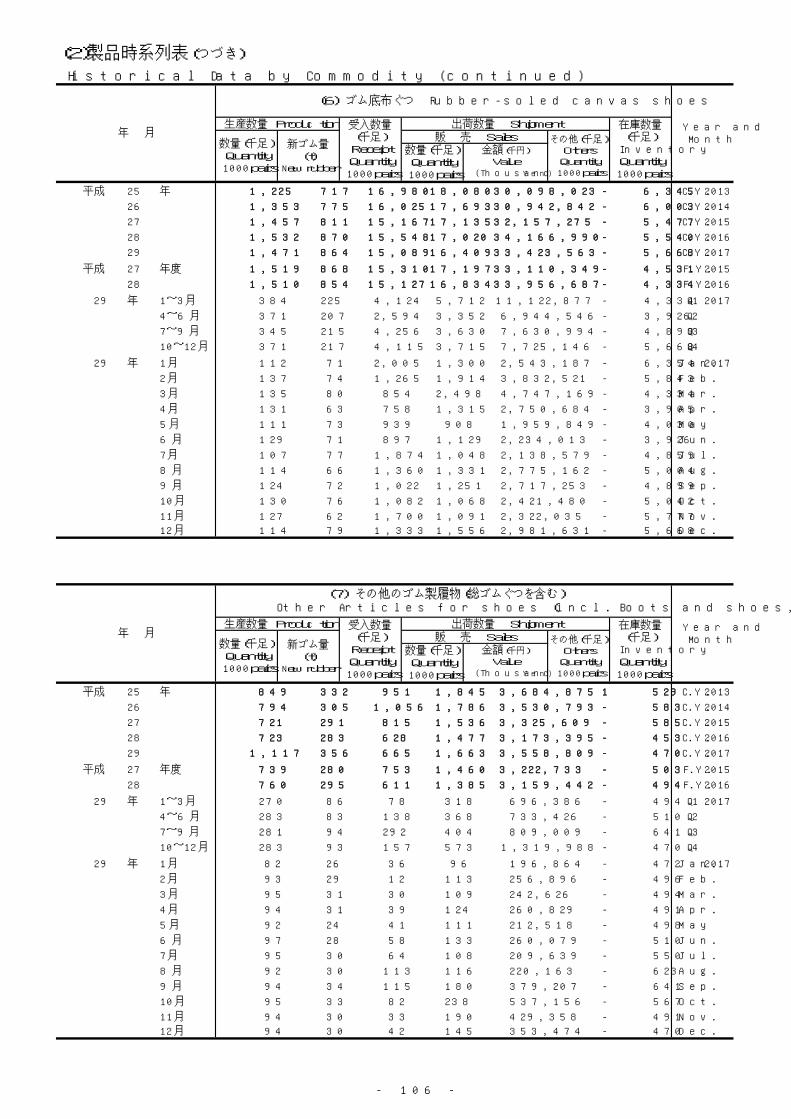
- 106 -
(2)製品時系列表(つづき)
Historical Data by Commodity (continued)
平成 25 年 1,225 717 16,980 18,080 30,098,023 - 6,345 C.Y. 2013
26 1,353 775 16,025 17,693 30,942,842 - 6,003 C.Y. 2014
27 1,457 811 15,167 17,135 32,157,275 - 5,477 C.Y. 2015
28 1,532 870 15,548 17,020 34,166,990 - 5,540 C.Y. 2016
29 1,471 864 15,089 16,409 33,423,563 - 5,668 C.Y. 2017
平成 27 年度 1,519 868 15,310 17,197 33,110,349 - 4,531 F.Y. 2015
28 1,510 854 15,127 16,834 33,956,687 - 4,334 F.Y. 2016
29 年 1~3月 384 225 4,124 5,712 11,122,877 - 4,334 Q1 2017
4~6月 371 207 2,594 3,352 6,944,546 - 3,926 Q2
7~9月 345 215 4,256 3,630 7,630,994 - 4,899 Q3
10~12月 371 217 4,115 3,715 7,725,146 - 5,668 Q4
29 年 1月 112 71 2,005 1,300 2,543,187 - 6,354 Jan. 2017
2月 137 74 1,265 1,914 3,832,521 - 5,843 Feb.
3月 135 80 854 2,498 4,747,169 - 4,334 Mar.
4月 131 63 758 1,315 2,750,684 - 3,905 Apr.
5月 111 73 939 908 1,959,849 - 4,030 May
6月 129 71 897 1,129 2,234,013 - 3,926 Jun.
7月 107 77 1,874 1,048 2,138,579 - 4,859 Jul.
8月 114 66 1,360 1,331 2,775,162 - 5,004 Aug.
9月 124 72 1,022 1,251 2,717,253 - 4,899 Sep.
10月 130 76 1,082 1,068 2,421,480 - 5,042 Oct.
11月 127 62 1,700 1,091 2,322,035 - 5,777 Nov.
12月 114 79 1,333 1,556 2,981,631 - 5,668 Dec.
平成 25 年 849 332 951 1,845 3,684,875 1 529 C.Y. 2013
26 794 305 1,056 1,786 3,530,793 - 583 C.Y. 2014
27 721 291 815 1,536 3,325,609 - 585 C.Y. 2015
28 723 283 628 1,477 3,173,395 - 453 C.Y. 2016
29 1,117 356 665 1,663 3,558,809 - 470 C.Y. 2017
平成 27 年度 739 280 753 1,460 3,222,733 - 503 F.Y. 2015
28 760 295 611 1,385 3,159,442 - 494 F.Y. 2016
29 年 1~3月 270 86 78 318 696,386 - 494 Q1 2017
4~6月 283 83 138 368 733,426 - 510 Q2
7~9月 281 94 292 404 809,009 - 641 Q3
10~12月 283 93 157 573 1,319,988 - 470 Q4
29 年 1月 82 26 36 96 196,864 - 472 Jan. 2017
2月 93 29 12 113 256,896 - 496 Feb.
3月 95 31 30 109 242,626 - 494 Mar.
4月 94 31 39 124 260,829 - 491 Apr.
5月 92 24 41 111 212,518 - 498 May
6月 97 28 58 133 260,079 - 510 Jun.
7月 95 30 64 108 209,639 - 550 Jul.
8月 92 30 113 116 220,163 - 623 Aug.
9月 94 34 115 180 379,207 - 641 Sep.
10月 95 33 82 238 537,156 - 567 Oct.
11月 94 30 33 190 429,358 - 491 Nov.
12月 94 30 42 145 353,474 - 470 Dec.
年 月
(6) ゴム底布ぐつ Rubber-soled canvas shoes
Year andMonth
生産数量 Production 受入数量(千足)
ReceiptQuantity1000pairs
出荷数量 Shipment 在庫数量(千足)
InventoryQuantity1000pairs
数量(千足)Quantity1000pairs
新ゴム量(t)
New rubber
販 売 Sales その他(千足)Others
Quantity1000pairs
数量(千足)Quantity1000pairs
金額(千円)
Value(Thousand Yen)
年 月
(7) その他のゴム製履物(総ゴムぐつを含む)Other Articles for shoes (incl. Boots and shoes, wholly of rubber)
Year andMonth
生産数量 Production 受入数量(千足)
ReceiptQuantity1000pairs
出荷数量 Shipment 在庫数量(千足)
InventoryQuantity1000pairs
数量(千足)Quantity1000pairs
新ゴム量(t)
New rubber
販 売 Sales その他(千足)Others
Quantity1000pairs
数量(千足)Quantity1000pairs
金額(千円)
Value(Thousand Yen)
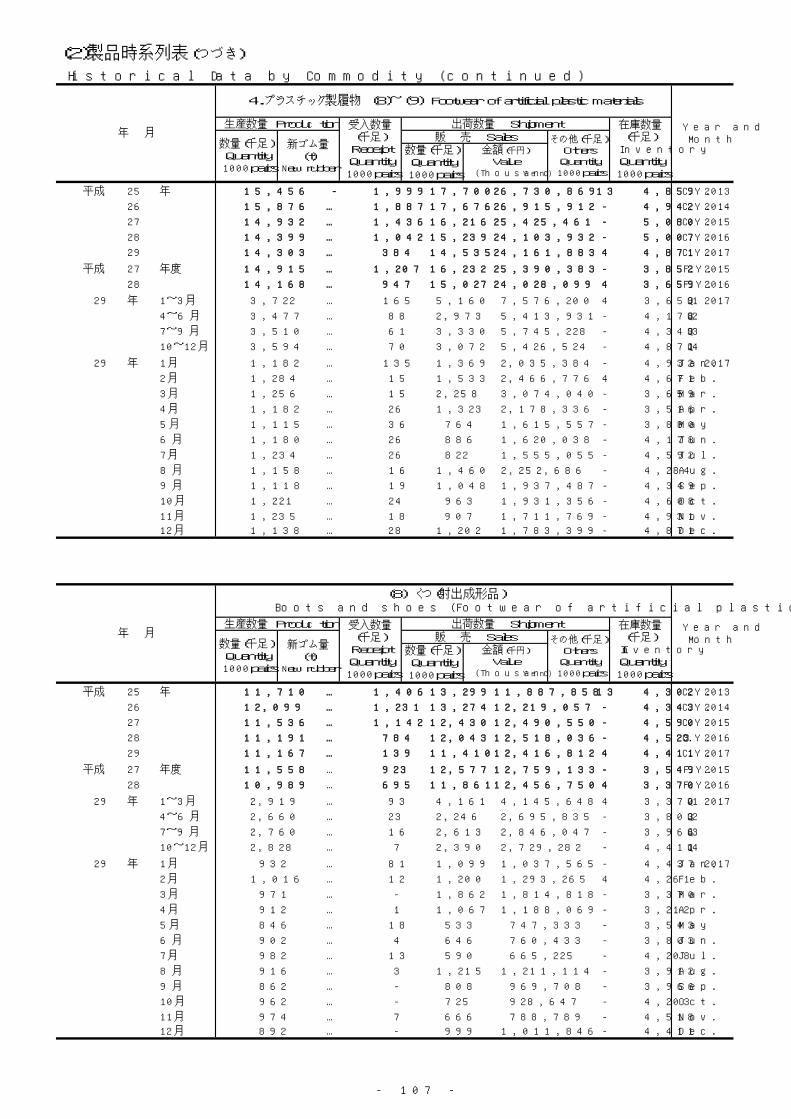
- 107 -
(2)製品時系列表(つづき)
Historical Data by Commodity (continued)
平成 25 年 15,456 - 1,999 17,700 26,730,869 13 4,859 C.Y. 2013
26 15,876 … 1,887 17,676 26,915,912 - 4,942 C.Y. 2014
27 14,932 … 1,436 16,216 25,425,461 - 5,080 C.Y. 2015
28 14,399 … 1,042 15,239 24,103,932 - 5,007 C.Y. 2016
29 14,303 … 384 14,535 24,161,883 4 4,871 C.Y. 2017
平成 27 年度 14,915 … 1,207 16,232 25,390,383 - 3,852 F.Y. 2015
28 14,168 … 947 15,027 24,028,099 4 3,659 F.Y. 2016
29 年 1~3月 3,722 … 165 5,160 7,576,200 4 3,659 Q1 2017
4~6月 3,477 … 88 2,973 5,413,931 - 4,178 Q2
7~9月 3,510 … 61 3,330 5,745,228 - 4,349 Q3
10~12月 3,594 … 70 3,072 5,426,524 - 4,871 Q4
29 年 1月 1,182 … 135 1,369 2,035,384 - 4,932 Jan. 2017
2月 1,284 … 15 1,533 2,466,776 4 4,671 Feb.
3月 1,256 … 15 2,258 3,074,040 - 3,659 Mar.
4月 1,182 … 26 1,323 2,178,336 - 3,516 Apr.
5月 1,115 … 36 764 1,615,557 - 3,880 May
6月 1,180 … 26 886 1,620,038 - 4,178 Jun.
7月 1,234 … 26 822 1,555,055 - 4,592 Jul.
8月 1,158 … 16 1,460 2,252,686 - 4,284 Aug.
9月 1,118 … 19 1,048 1,937,487 - 4,349 Sep.
10月 1,221 … 24 963 1,931,356 - 4,608 Oct.
11月 1,235 … 18 907 1,711,769 - 4,931 Nov.
12月 1,138 … 28 1,202 1,783,399 - 4,871 Dec.
平成 25 年 11,710 … 1,406 13,299 11,887,858 13 4,302 C.Y. 2013
26 12,099 … 1,231 13,274 12,219,057 - 4,343 C.Y. 2014
27 11,536 … 1,142 12,430 12,490,550 - 4,590 C.Y. 2015
28 11,191 … 784 12,043 12,518,036 - 4,523 C.Y. 2016
29 11,167 … 139 11,410 12,416,812 4 4,411 C.Y. 2017
平成 27 年度 11,558 … 923 12,577 12,759,133 - 3,549 F.Y. 2015
28 10,989 … 695 11,861 12,456,750 4 3,370 F.Y. 2016
29 年 1~3月 2,919 … 93 4,161 4,145,648 4 3,370 Q1 2017
4~6月 2,660 … 23 2,246 2,695,835 - 3,803 Q2
7~9月 2,760 … 16 2,613 2,846,047 - 3,966 Q3
10~12月 2,828 … 7 2,390 2,729,282 - 4,411 Q4
29 年 1月 932 … 81 1,099 1,037,565 - 4,437 Jan. 2017
2月 1,016 … 12 1,200 1,293,265 4 4,261 Feb.
3月 971 … - 1,862 1,814,818 - 3,370 Mar.
4月 912 … 1 1,067 1,188,069 - 3,212 Apr.
5月 846 … 18 533 747,333 - 3,543 May
6月 902 … 4 646 760,433 - 3,803 Jun.
7月 982 … 13 590 665,225 - 4,208 Jul.
8月 916 … 3 1,215 1,211,114 - 3,912 Aug.
9月 862 … - 808 969,708 - 3,966 Sep.
10月 962 … - 725 928,647 - 4,203 Oct.
11月 974 … 7 666 788,789 - 4,518 Nov.
12月 892 … - 999 1,011,846 - 4,411 Dec.
数量(千足)Quantity1000pairs
金額(千円)
Value(Thousand Yen)
数量(千足)Quantity1000pairs
新ゴム量(t)
New rubber
販 売 Sales その他(千足)Others
Quantity1000pairs
年 月
(8) くつ(射出成形品)Boots and shoes (Footwear of artificial plastic materials (injected))
Year andMonth
生産数量 Production 受入数量(千足)
ReceiptQuantity1000pairs
出荷数量 Shipment 在庫数量(千足)
InventoryQuantity1000pairs
数量(千足)Quantity1000pairs
金額(千円)
Value(Thousand Yen)
数量(千足)Quantity1000pairs
新ゴム量(t)
New rubber
販 売 Sales その他(千足)Others
Quantity1000pairs
年 月
4.プラスチック製履物 (8)~(9) Footwear of artificial plastic materials
Year andMonth
生産数量 Production 受入数量(千足)
ReceiptQuantity1000pairs
出荷数量 Shipment 在庫数量(千足)
InventoryQuantity1000pairs
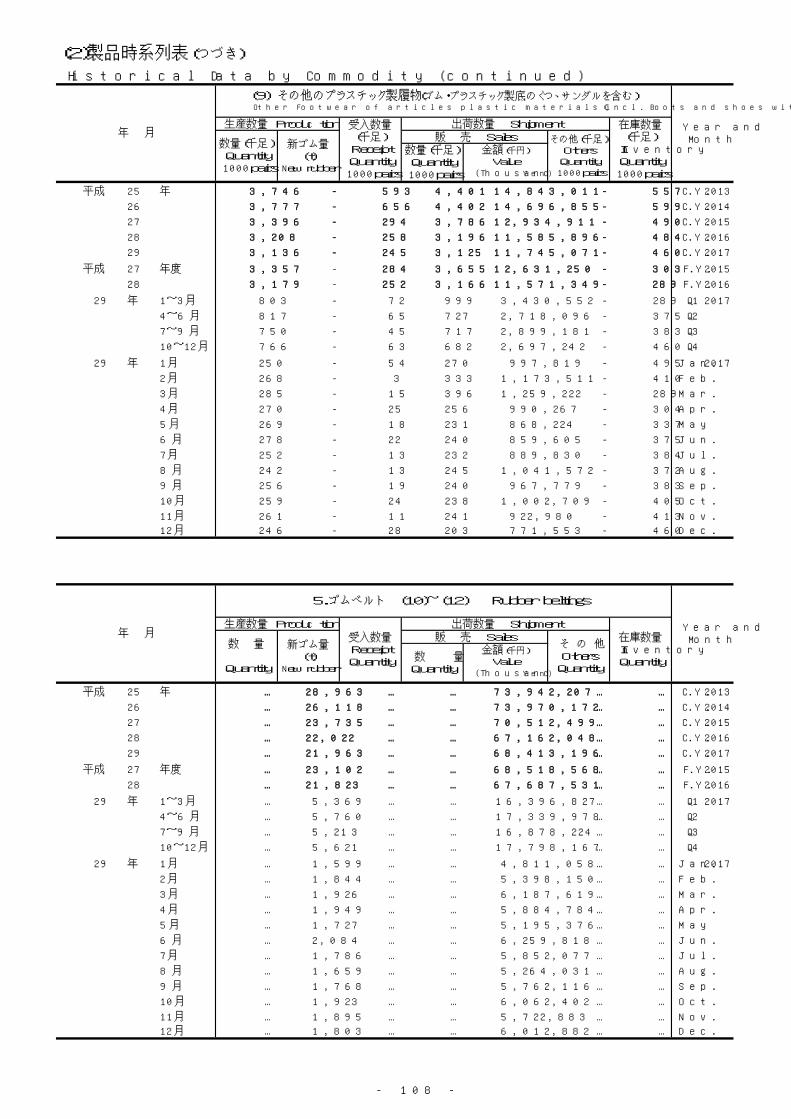
- 108 -
(2)製品時系列表(つづき)
Historical Data by Commodity (continued)
平成 25 年 3,746 - 593 4,401 14,843,011 - 557 C.Y. 2013
26 3,777 - 656 4,402 14,696,855 - 599 C.Y. 2014
27 3,396 - 294 3,786 12,934,911 - 490 C.Y. 2015
28 3,208 - 258 3,196 11,585,896 - 484 C.Y. 2016
29 3,136 - 245 3,125 11,745,071 - 460 C.Y. 2017
平成 27 年度 3,357 - 284 3,655 12,631,250 - 303 F.Y. 2015
28 3,179 - 252 3,166 11,571,349 - 289 F.Y. 2016
29 年 1~3月 803 - 72 999 3,430,552 - 289 Q1 2017
4~6月 817 - 65 727 2,718,096 - 375 Q2
7~9月 750 - 45 717 2,899,181 - 383 Q3
10~12月 766 - 63 682 2,697,242 - 460 Q4
29 年 1月 250 - 54 270 997,819 - 495 Jan. 2017
2月 268 - 3 333 1,173,511 - 410 Feb.
3月 285 - 15 396 1,259,222 - 289 Mar.
4月 270 - 25 256 990,267 - 304 Apr.
5月 269 - 18 231 868,224 - 337 May
6月 278 - 22 240 859,605 - 375 Jun.
7月 252 - 13 232 889,830 - 384 Jul.
8月 242 - 13 245 1,041,572 - 372 Aug.
9月 256 - 19 240 967,779 - 383 Sep.
10月 259 - 24 238 1,002,709 - 405 Oct.
11月 261 - 11 241 922,980 - 413 Nov.
12月 246 - 28 203 771,553 - 460 Dec.
平成 25 年 … 28,963 … … 73,942,207 … … C.Y. 2013
26 … 26,118 … … 73,970,172 … … C.Y. 2014
27 … 23,735 … … 70,512,499 … … C.Y. 2015
28 … 22,022 … … 67,162,048 … … C.Y. 2016
29 … 21,963 … … 68,413,196 … … C.Y. 2017
平成 27 年度 … 23,102 … … 68,518,568 … … F.Y. 2015
28 … 21,823 … … 67,687,531 … … F.Y. 2016
29 年 1~3月 … 5,369 … … 16,396,827 … … Q1 2017
4~6月 … 5,760 … … 17,339,978 … … Q2
7~9月 … 5,213 … … 16,878,224 … … Q3
10~12月 … 5,621 … … 17,798,167 … … Q4
29 年 1月 … 1,599 … … 4,811,058 … … Jan. 2017
2月 … 1,844 … … 5,398,150 … … Feb.
3月 … 1,926 … … 6,187,619 … … Mar.
4月 … 1,949 … … 5,884,784 … … Apr.
5月 … 1,727 … … 5,195,376 … … May
6月 … 2,084 … … 6,259,818 … … Jun.
7月 … 1,786 … … 5,852,077 … … Jul.
8月 … 1,659 … … 5,264,031 … … Aug.
9月 … 1,768 … … 5,762,116 … … Sep.
10月 … 1,923 … … 6,062,402 … … Oct.
11月 … 1,895 … … 5,722,883 … … Nov.
12月 … 1,803 … … 6,012,882 … … Dec.
生産数量 Production 受入数量(千足)
ReceiptQuantity1000pairs
出荷数量 Shipment 在庫数量(千足)
InventoryQuantity1000pairs
数量(千足)Quantity1000pairs
新ゴム量(t)
New rubber
年 月
(9) その他のプラスチック製履物(ゴム・プラスチック製底のくつ、サンダルを含む)Other Footwear of articles plastic materials(incl. Boots and shoes with soles of rubber and plastic, sandals)
販 売 Sales その他(千足)Others
Quantity1000pairs
数量(千足)Quantity1000pairs
金額(千円)
Value(Thousand Yen)
Year andMonth
Year andMonth
生産数量 Production 受入数量ReceiptQuantity
出荷数量 Shipment在庫数量InventoryQuantity
数 量
Quantity
新ゴム量(t)
New rubber
年 月
5.ゴムベルト (10)~(12) Rubber beltings
販 売 Salesそ の 他Others
Quantity数 量
Quantity
金額(千円)
Value(Thousand Yen)
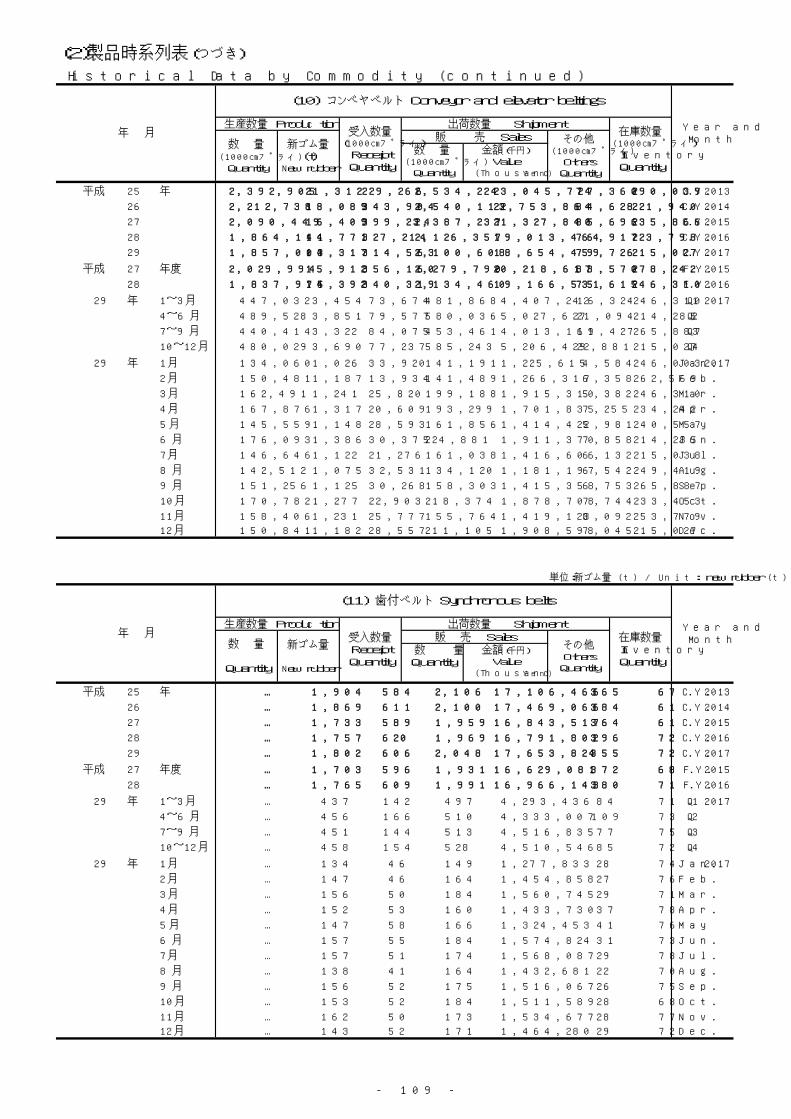
- 109 -
(2)製品時系列表(つづき)
Historical Data by Commodity (continued)
平成 25 年 2,392,905 21,312 229,266 2,534,224 23,045,724 77,360 290,039 C.Y. 2013
26 2,212,738 18,089 343,904 2,540,113 22,753,864 84,628 221,940 C.Y. 2014
27 2,090,449 16,409 399,234 2,387,237 21,327,840 85,696 235,866 C.Y. 2015
28 1,864,141 14,771 327,214 2,126,357 19,013,464 76,917 223,798 C.Y. 2016
29 1,857,003 14,317 314,563 2,100,608 18,654,459 79,726 215,027 C.Y. 2017
平成 27 年度 2,029,994 15,912 356,160 2,279,790 20,218,617 83,570 278,242 F.Y. 2015
28 1,837,975 14,392 340,319 2,134,460 19,166,531 75,615 246,310 F.Y. 2016
29 年 1~3月 447,032 3,454 73,674 481,868 4,407,242 16,324 246,310 Q1 2017
4~6月 489,528 3,851 79,577 580,036 5,027,627 21,094 214,285 Q2
7~9月 440,414 3,322 84,075 453,461 4,013,161 19,427 265,887 Q3
10~12月 480,029 3,690 77,237 585,243 5,206,429 22,881 215,027 Q4
29 年 1月 134,060 1,026 33,920 141,191 1,225,615 4,584 246,003 Jan. 2017
2月 150,481 1,187 13,934 141,489 1,266,317 6,358 262,569 Feb.
3月 162,491 1,241 25,820 199,188 1,915,310 5,382 246,310 Mar.
4月 167,876 1,317 20,609 193,299 1,701,835 7,255 234,242 Apr.
5月 145,559 1,148 28,593 161,856 1,414,422 5,981 240,557 May
6月 176,093 1,386 30,375 224,881 1,911,370 7,858 214,285 Jun.
7月 146,646 1,122 21,276 161,038 1,416,606 6,132 215,038 Jul.
8月 142,512 1,075 32,531 134,120 1,181,197 6,542 249,419 Aug.
9月 151,256 1,125 30,268 158,303 1,415,358 6,753 265,887 Sep.
10月 170,782 1,277 22,903 218,374 1,878,708 7,744 233,453 Oct.
11月 158,406 1,231 25,777 155,764 1,419,123 8,092 253,779 Nov.
12月 150,841 1,182 28,557 211,105 1,908,598 7,045 215,027 Dec.
単位:新ゴム量 (t) / Unit: new rubber (t)
平成 25 年 … 1,904 584 2,106 17,106,466 365 67 C.Y. 2013
26 … 1,869 611 2,100 17,469,066 384 61 C.Y. 2014
27 … 1,733 589 1,959 16,843,517 364 61 C.Y. 2015
28 … 1,757 620 1,969 16,791,802 396 72 C.Y. 2016
29 … 1,802 606 2,048 17,653,824 355 72 C.Y. 2017
平成 27 年度 … 1,703 596 1,931 16,629,081 372 68 F.Y. 2015
28 … 1,765 609 1,991 16,966,143 380 71 F.Y. 2016
29 年 1~3月 … 437 142 497 4,293,436 84 71 Q1 2017
4~6月 … 456 166 510 4,333,007 109 73 Q2
7~9月 … 451 144 513 4,516,835 77 75 Q3
10~12月 … 458 154 528 4,510,546 85 72 Q4
29 年 1月 … 134 46 149 1,277,833 28 74 Jan. 2017
2月 … 147 46 164 1,454,858 27 76 Feb.
3月 … 156 50 184 1,560,745 29 71 Mar.
4月 … 152 53 160 1,433,730 37 78 Apr.
5月 … 147 58 166 1,324,453 41 76 May
6月 … 157 55 184 1,574,824 31 73 Jun.
7月 … 157 51 174 1,568,087 29 78 Jul.
8月 … 138 41 164 1,432,681 22 70 Aug.
9月 … 156 52 175 1,516,067 26 75 Sep.
10月 … 153 52 184 1,511,589 28 68 Oct.
11月 … 162 50 173 1,534,677 28 77 Nov.
12月 … 143 52 171 1,464,280 29 72 Dec.
(10) コンベヤベルト Conveyor and elevator beltings
Year andMonth
生産数量 Production 受入数量
(1000㎝プライ)ReceiptQuantity
出荷数量 Shipment在庫数量
(1000㎝プライ)InventoryQuantity
数 量(1000㎝プライ)
Quantity
新ゴム量(t)
New rubber
販 売 Sales その他(1000㎝プライ)
OthersQuantity
数 量(1000㎝プライ)
Quantity
金額(千円)
Value(Thousand Yen)
年 月
年 月
(11) 歯付ベルト Synchronous belts
Year andMonth
生産数量 Production 受入数量ReceiptQuantity
出荷数量 Shipment在庫数量InventoryQuantity
数 量Quantity
金額(千円)
Value(Thousand Yen)
数 量
Quantity
新ゴム量
New rubber
販 売 Salesその他Others
Quantity
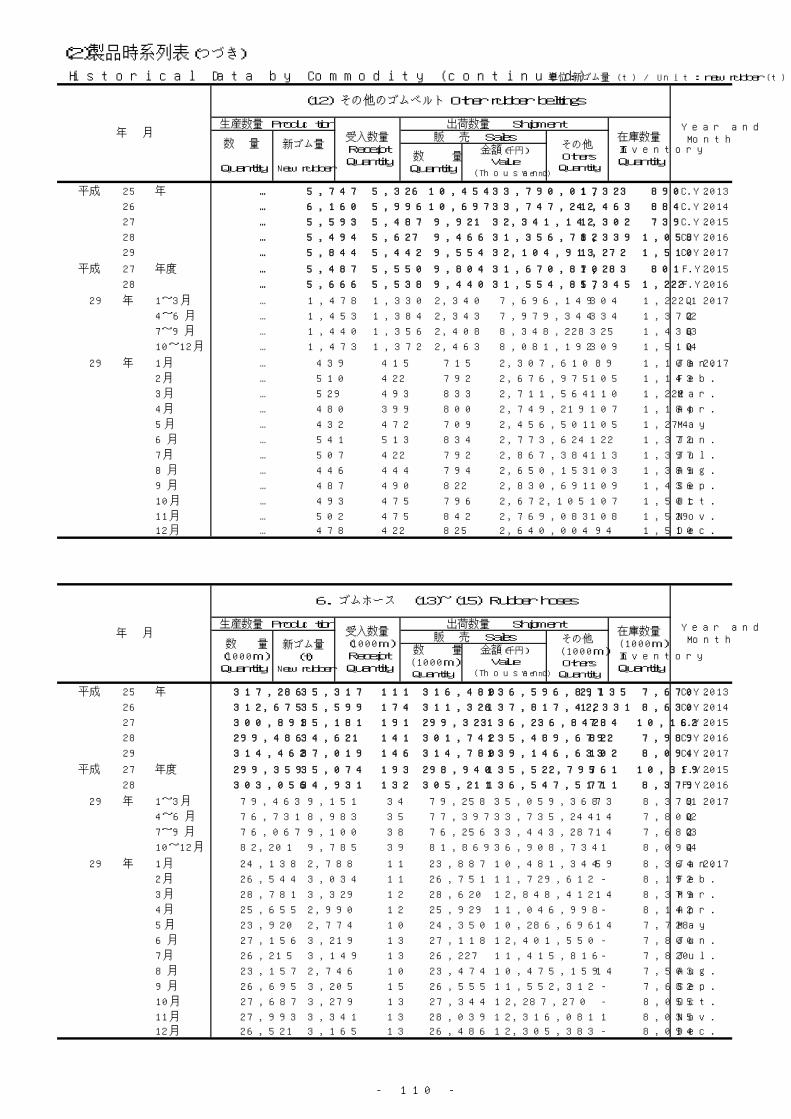
- 110 -
(2)製品時系列表(つづき)
Historical Data by Commodity (continued) 単位:新ゴム量 (t) / Unit: new rubber (t)
平成 25 年 … 5,747 5,326 10,454 33,790,017 1,323 890 C.Y. 2013
26 … 6,160 5,996 10,697 33,747,242 1,463 884 C.Y. 2014
27 … 5,593 5,487 9,921 32,341,142 1,302 739 C.Y. 2015
28 … 5,494 5,627 9,466 31,356,782 1,339 1,058 C.Y. 2016
29 … 5,844 5,442 9,554 32,104,913 1,272 1,510 C.Y. 2017
平成 27 年度 … 5,487 5,550 9,804 31,670,870 1,283 801 F.Y. 2015
28 … 5,666 5,538 9,440 31,554,857 1,345 1,222 F.Y. 2016
29 年 1~3月 … 1,478 1,330 2,340 7,696,149 304 1,222 Q1 2017
4~6月 … 1,453 1,384 2,343 7,979,344 334 1,372 Q2
7~9月 … 1,440 1,356 2,408 8,348,228 325 1,436 Q3
10~12月 … 1,473 1,372 2,463 8,081,192 309 1,510 Q4
29 年 1月 … 439 415 715 2,307,610 89 1,108 Jan. 2017
2月 … 510 422 792 2,676,975 105 1,143 Feb.
3月 … 529 493 833 2,711,564 110 1,222 Mar.
4月 … 480 399 800 2,749,219 107 1,184 Apr.
5月 … 432 472 709 2,456,501 105 1,274 May
6月 … 541 513 834 2,773,624 122 1,372 Jun.
7月 … 507 422 792 2,867,384 113 1,397 Jul.
8月 … 446 444 794 2,650,153 103 1,389 Aug.
9月 … 487 490 822 2,830,691 109 1,436 Sep.
10月 … 493 475 796 2,672,105 107 1,501 Oct.
11月 … 502 475 842 2,769,083 108 1,529 Nov.
12月 … 478 422 825 2,640,004 94 1,510 Dec.
平成 25 年 317,286 35,317 111 316,480 136,596,897 2,135 7,670 C.Y. 2013
26 312,675 35,599 174 311,326 137,817,422 1,331 8,630 C.Y. 2014
27 300,891 35,181 191 299,323 136,236,842 784 10,162 C.Y. 2015
28 299,486 34,621 141 301,742 135,489,679 822 7,989 C.Y. 2016
29 314,462 37,019 146 314,780 139,146,633 102 8,094 C.Y. 2017
平成 27 年度 299,359 35,074 193 298,940 135,522,795 761 10,319 F.Y. 2015
28 303,056 34,931 132 305,211 136,547,517 711 8,379 F.Y. 2016
29 年 1~3月 79,463 9,151 34 79,258 35,059,368 73 8,379 Q1 2017
4~6月 76,731 8,983 35 77,397 33,735,244 14 7,800 Q2
7~9月 76,067 9,100 38 76,256 33,443,287 14 7,682 Q3
10~12月 82,201 9,785 39 81,869 36,908,734 1 8,094 Q4
29 年 1月 24,138 2,788 11 23,887 10,481,344 59 8,364 Jan. 2017
2月 26,544 3,034 11 26,751 11,729,612 - 8,192 Feb.
3月 28,781 3,329 12 28,620 12,848,412 14 8,379 Mar.
4月 25,655 2,990 12 25,929 11,046,998 - 8,142 Apr.
5月 23,920 2,774 10 24,350 10,286,696 14 7,728 May
6月 27,156 3,219 13 27,118 12,401,550 - 7,800 Jun.
7月 26,215 3,149 13 26,227 11,415,816 - 7,820 Jul.
8月 23,157 2,746 10 23,474 10,475,159 14 7,503 Aug.
9月 26,695 3,205 15 26,555 11,552,312 - 7,682 Sep.
10月 27,687 3,279 13 27,344 12,287,270 - 8,055 Oct.
11月 27,993 3,341 13 28,039 12,316,081 1 8,035 Nov.
12月 26,521 3,165 13 26,486 12,305,383 - 8,094 Dec.
出荷数量 Shipment在庫数量InventoryQuantity
生産数量 Production 受入数量ReceiptQuantity
数 量
Quantity
新ゴム量
New rubber
年 月
(12) その他のゴムベルト Other rubber beltings
Year andMonth
数 量Quantity
金額(千円)
Value(Thousand Yen)
販 売 Salesその他Others
Quantity
出荷数量 Shipment在庫数量(1000m)InventoryQuantity
生産数量 Production 受入数量(1000m)ReceiptQuantity
数 量(1000m)Quantity
新ゴム量(t)
New rubber
年 月
6. ゴムホース (13)~(15) Rubber hoses
Year andMonth販 売 Sales その他
(1000m)Others
Quantity
数 量(1000m)Quantity
金額(千円)
Value(Thousand Yen)
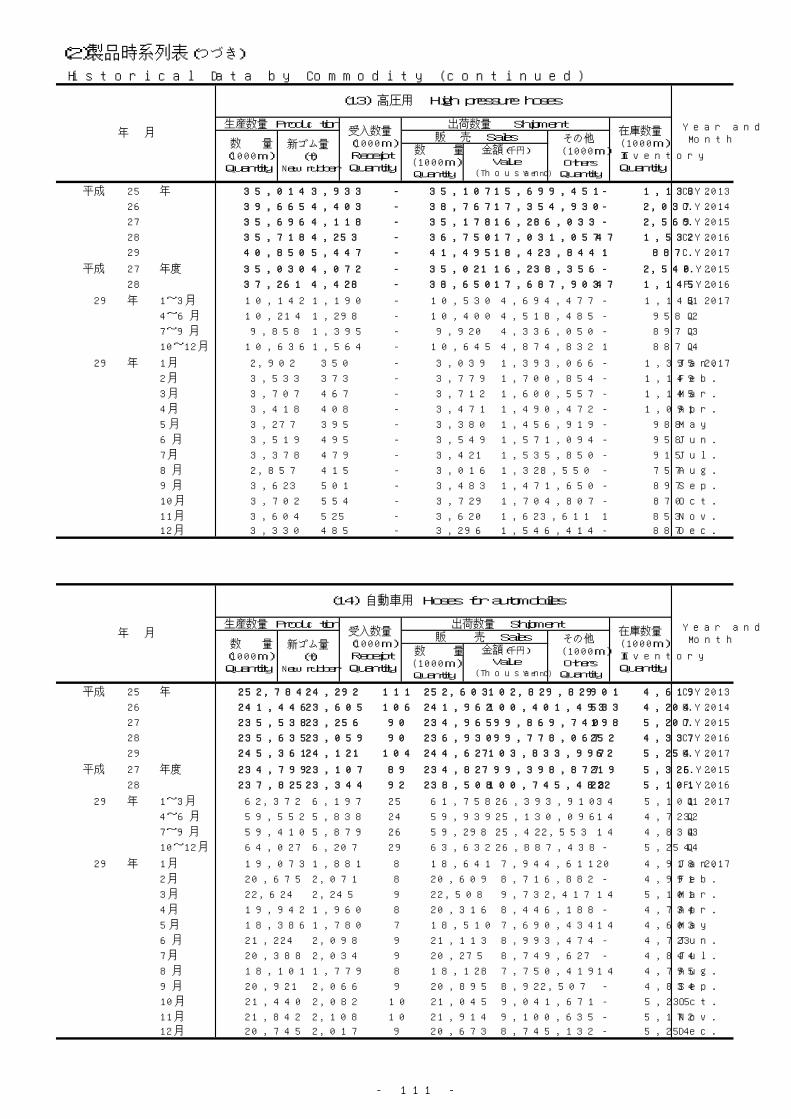
- 111 -
(2)製品時系列表(つづき)
Historical Data by Commodity (continued)
平成 25 年 35,014 3,933 - 35,107 15,699,451 - 1,138 C.Y. 2013
26 39,665 4,403 - 38,767 17,354,930 - 2,037 C.Y. 2014
27 35,696 4,118 - 35,178 16,286,033 - 2,569 C.Y. 2015
28 35,718 4,253 - 36,750 17,031,057 47 1,532 C.Y. 2016
29 40,850 5,447 - 41,495 18,423,844 1 887 C.Y. 2017
平成 27 年度 35,030 4,072 - 35,021 16,238,356 - 2,540 F.Y. 2015
28 37,261 4,428 - 38,650 17,687,903 47 1,145 F.Y. 2016
29 年 1~3月 10,142 1,190 - 10,530 4,694,477 - 1,145 Q1 2017
4~6月 10,214 1,298 - 10,400 4,518,485 - 958 Q2
7~9月 9,858 1,395 - 9,920 4,336,050 - 897 Q3
10~12月 10,636 1,564 - 10,645 4,874,832 1 887 Q4
29 年 1月 2,902 350 - 3,039 1,393,066 - 1,395 Jan. 2017
2月 3,533 373 - 3,779 1,700,854 - 1,149 Feb.
3月 3,707 467 - 3,712 1,600,557 - 1,145 Mar.
4月 3,418 408 - 3,471 1,490,472 - 1,091 Apr.
5月 3,277 395 - 3,380 1,456,919 - 988 May
6月 3,519 495 - 3,549 1,571,094 - 958 Jun.
7月 3,378 479 - 3,421 1,535,850 - 915 Jul.
8月 2,857 415 - 3,016 1,328,550 - 757 Aug.
9月 3,623 501 - 3,483 1,471,650 - 897 Sep.
10月 3,702 554 - 3,729 1,704,807 - 870 Oct.
11月 3,604 525 - 3,620 1,623,611 1 853 Nov.
12月 3,330 485 - 3,296 1,546,414 - 887 Dec.
平成 25 年 252,784 24,292 111 252,603 102,829,829 901 4,619 C.Y. 2013
26 241,446 23,605 106 241,962 100,401,493 533 4,204 C.Y. 2014
27 235,538 23,256 90 234,965 99,869,740 198 5,207 C.Y. 2015
28 235,635 23,059 90 236,930 99,778,067 252 4,337 C.Y. 2016
29 245,361 24,121 104 244,627 103,833,997 62 5,254 C.Y. 2017
平成 27 年度 234,799 23,107 89 234,827 99,398,877 219 5,326 F.Y. 2015
28 237,825 23,344 92 238,508 100,745,483 222 5,101 F.Y. 2016
29 年 1~3月 62,372 6,197 25 61,758 26,393,910 34 5,101 Q1 2017
4~6月 59,552 5,838 24 59,939 25,130,096 14 4,723 Q2
7~9月 59,410 5,879 26 59,298 25,422,553 14 4,834 Q3
10~12月 64,027 6,207 29 63,632 26,887,438 - 5,254 Q4
29 年 1月 19,073 1,881 8 18,641 7,944,611 20 4,918 Jan. 2017
2月 20,675 2,071 8 20,609 8,716,882 - 4,991 Feb.
3月 22,624 2,245 9 22,508 9,732,417 14 5,101 Mar.
4月 19,942 1,960 8 20,316 8,446,188 - 4,734 Apr.
5月 18,386 1,780 7 18,510 7,690,434 14 4,603 May
6月 21,224 2,098 9 21,113 8,993,474 - 4,723 Jun.
7月 20,388 2,034 9 20,275 8,749,627 - 4,844 Jul.
8月 18,101 1,779 8 18,128 7,750,419 14 4,795 Aug.
9月 20,921 2,066 9 20,895 8,922,507 - 4,834 Sep.
10月 21,440 2,082 10 21,045 9,041,671 - 5,235 Oct.
11月 21,842 2,108 10 21,914 9,100,635 - 5,172 Nov.
12月 20,745 2,017 9 20,673 8,745,132 - 5,254 Dec.
(13) 高圧用 High pressure hoses
Year andMonth
生産数量 Production 受入数量(1000m)ReceiptQuantity
出荷数量 Shipment在庫数量(1000m)InventoryQuantity
数 量(1000m)Quantity
新ゴム量(t)
New rubber
年 月 販 売 Sales その他 (1000m)
OthersQuantity
数 量(1000m)Quantity
金額(千円)
Value(Thousand Yen)
(14) 自動車用 Hoses for automobiles
Year andMonth
生産数量 Production 受入数量(1000m)ReceiptQuantity
出荷数量 Shipment在庫数量(1000m)InventoryQuantity
数 量(1000m)Quantity
金額(千円)
Value(Thousand Yen)
年 月数 量
(1000m)Quantity
新ゴム量(t)
New rubber
販 売 Sales その他 (1000m)
OthersQuantity
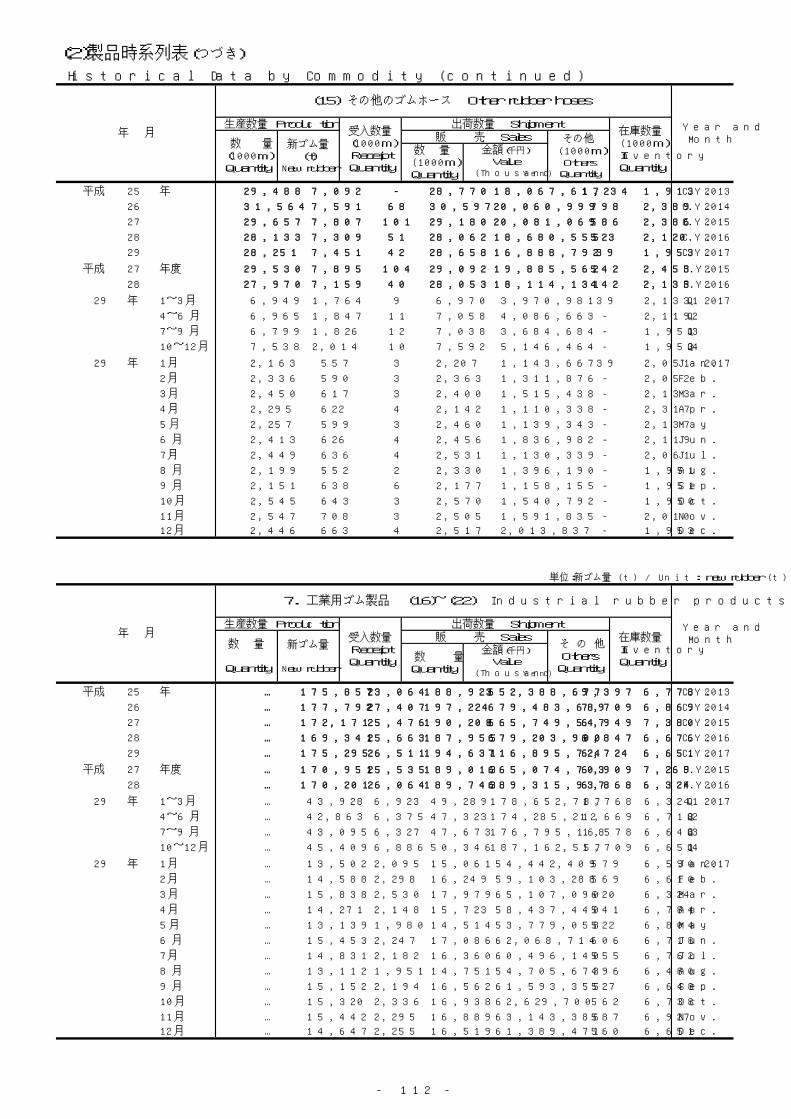
- 112 -
(2)製品時系列表(つづき)
Historical Data by Commodity (continued)
平成 25 年 29,488 7,092 - 28,770 18,067,617 1,234 1,913 C.Y. 2013
26 31,564 7,591 68 30,597 20,060,999 798 2,389 C.Y. 2014
27 29,657 7,807 101 29,180 20,081,069 586 2,386 C.Y. 2015
28 28,133 7,309 51 28,062 18,680,555 523 2,120 C.Y. 2016
29 28,251 7,451 42 28,658 16,888,792 39 1,953 C.Y. 2017
平成 27 年度 29,530 7,895 104 29,092 19,885,562 542 2,453 F.Y. 2015
28 27,970 7,159 40 28,053 18,114,131 442 2,133 F.Y. 2016
29 年 1~3月 6,949 1,764 9 6,970 3,970,981 39 2,133 Q1 2017
4~6月 6,965 1,847 11 7,058 4,086,663 - 2,119 Q2
7~9月 6,799 1,826 12 7,038 3,684,684 - 1,951 Q3
10~12月 7,538 2,014 10 7,592 5,146,464 - 1,953 Q4
29 年 1月 2,163 557 3 2,207 1,143,667 39 2,051 Jan. 2017
2月 2,336 590 3 2,363 1,311,876 - 2,052 Feb.
3月 2,450 617 3 2,400 1,515,438 - 2,133 Mar.
4月 2,295 622 4 2,142 1,110,338 - 2,317 Apr.
5月 2,257 599 3 2,460 1,139,343 - 2,137 May
6月 2,413 626 4 2,456 1,836,982 - 2,119 Jun.
7月 2,449 636 4 2,531 1,130,339 - 2,061 Jul.
8月 2,199 552 2 2,330 1,396,190 - 1,951 Aug.
9月 2,151 638 6 2,177 1,158,155 - 1,951 Sep.
10月 2,545 643 3 2,570 1,540,792 - 1,950 Oct.
11月 2,547 708 3 2,505 1,591,835 - 2,010 Nov.
12月 2,446 663 4 2,517 2,013,837 - 1,953 Dec.
単位:新ゴム量 (t) / Unit: new rubber (t)
平成 25 年 … 175,857 23,064 188,923 652,388,677 9,397 6,778 C.Y. 2013
26 … 177,792 27,407 197,224 679,483,689 7,709 6,869 C.Y. 2014
27 … 172,171 25,476 190,208 665,749,547 6,949 7,380 C.Y. 2015
28 … 169,341 25,663 187,955 679,203,900 6,847 6,676 C.Y. 2016
29 … 175,295 26,511 194,631 716,895,724 6,724 6,651 C.Y. 2017
平成 27 年度 … 170,951 25,535 189,013 665,074,703 6,909 7,269 F.Y. 2015
28 … 170,201 26,064 189,743 689,315,937 6,868 6,324 F.Y. 2016
29 年 1~3月 … 43,928 6,923 49,289 178,652,787 1,768 6,324 Q1 2017
4~6月 … 42,863 6,375 47,323 174,285,212 1,669 6,718 Q2
7~9月 … 43,095 6,327 47,673 176,795,168 1,578 6,648 Q3
10~12月 … 45,409 6,886 50,346 187,162,557 1,709 6,651 Q4
29 年 1月 … 13,502 2,095 15,061 54,442,409 579 6,590 Jan. 2017
2月 … 14,588 2,298 16,249 59,103,288 569 6,610 Feb.
3月 … 15,838 2,530 17,979 65,107,090 620 6,324 Mar.
4月 … 14,271 2,148 15,723 58,437,440 541 6,784 Apr.
5月 … 13,139 1,980 14,514 53,779,058 522 6,804 May
6月 … 15,453 2,247 17,086 62,068,714 606 6,718 Jun.
7月 … 14,831 2,182 16,360 60,496,140 555 6,762 Jul.
8月 … 13,112 1,951 14,751 54,705,673 496 6,480 Aug.
9月 … 15,152 2,194 16,562 61,593,355 527 6,648 Sep.
10月 … 15,320 2,336 16,938 62,629,700 562 6,738 Oct.
11月 … 15,442 2,295 16,889 63,143,386 587 6,927 Nov.
12月 … 14,647 2,255 16,519 61,389,471 560 6,651 Dec.
年 月
(15) その他のゴムホース Other rubber hoses
Year andMonth
生産数量 Production 受入数量(1000m)ReceiptQuantity
出荷数量 Shipment在庫数量(1000m)InventoryQuantity
数 量(1000m)Quantity
新ゴム量(t)
New rubber
販 売 Sales その他(1000m)Others
Quantity
数 量(1000m)Quantity
金額(千円)
Value(Thousand Yen)
年 月
7. 工業用ゴム製品 (16)~(22) Industrial rubber products
Year andMonth
生産数量 Production 受入数量ReceiptQuantity
出荷数量 Shipment在庫数量InventoryQuantity
数 量
Quantity
新ゴム量
New rubber
販 売 Salesそ の 他Others
Quantity数 量
Quantity
金額(千円)
Value(Thousand Yen)
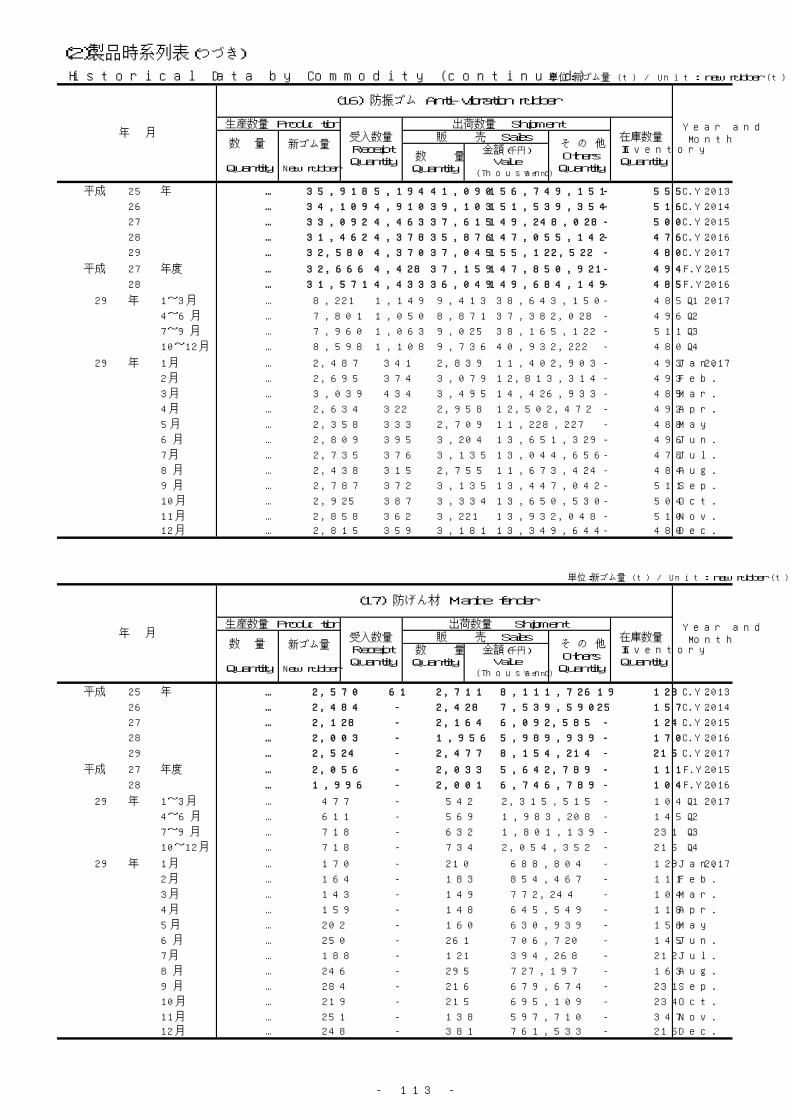
- 113 -
(2)製品時系列表(つづき)
Historical Data by Commodity (continued) 単位:新ゴム量 (t) / Unit: new rubber (t)
平成 25 年 … 35,918 5,194 41,090 156,749,151 - 555 C.Y. 2013
26 … 34,109 4,910 39,103 151,539,354 - 516 C.Y. 2014
27 … 33,092 4,463 37,615 149,248,028 - 500 C.Y. 2015
28 … 31,462 4,378 35,876 147,055,142 - 476 C.Y. 2016
29 … 32,580 4,370 37,045 155,122,522 - 480 C.Y. 2017
平成 27 年度 … 32,666 4,428 37,159 147,850,921 - 494 F.Y. 2015
28 … 31,571 4,433 36,049 149,684,149 - 485 F.Y. 2016
29 年 1~3月 … 8,221 1,149 9,413 38,643,150 - 485 Q1 2017
4~6月 … 7,801 1,050 8,871 37,382,028 - 496 Q2
7~9月 … 7,960 1,063 9,025 38,165,122 - 511 Q3
10~12月 … 8,598 1,108 9,736 40,932,222 - 480 Q4
29 年 1月 … 2,487 341 2,839 11,402,903 - 493 Jan. 2017
2月 … 2,695 374 3,079 12,813,314 - 493 Feb.
3月 … 3,039 434 3,495 14,426,933 - 485 Mar.
4月 … 2,634 322 2,958 12,502,472 - 492 Apr.
5月 … 2,358 333 2,709 11,228,227 - 488 May
6月 … 2,809 395 3,204 13,651,329 - 496 Jun.
7月 … 2,735 376 3,135 13,044,656 - 478 Jul.
8月 … 2,438 315 2,755 11,673,424 - 484 Aug.
9月 … 2,787 372 3,135 13,447,042 - 511 Sep.
10月 … 2,925 387 3,334 13,650,530 - 504 Oct.
11月 … 2,858 362 3,221 13,932,048 - 510 Nov.
12月 … 2,815 359 3,181 13,349,644 - 480 Dec.
平成 25 年 … 2,570 61 2,711 8,111,726 19 128 C.Y. 2013
26 … 2,484 - 2,428 7,539,590 25 157 C.Y. 2014
27 … 2,128 - 2,164 6,092,585 - 124 C.Y. 2015
28 … 2,003 - 1,956 5,989,939 - 170 C.Y. 2016
29 … 2,524 - 2,477 8,154,214 - 215 C.Y. 2017
平成 27 年度 … 2,056 - 2,033 5,642,789 - 111 F.Y. 2015
28 … 1,996 - 2,001 6,746,789 - 104 F.Y. 2016
29 年 1~3月 … 477 - 542 2,315,515 - 104 Q1 2017
4~6月 … 611 - 569 1,983,208 - 145 Q2
7~9月 … 718 - 632 1,801,139 - 231 Q3
10~12月 … 718 - 734 2,054,352 - 215 Q4
29 年 1月 … 170 - 210 688,804 - 129 Jan. 2017
2月 … 164 - 183 854,467 - 111 Feb.
3月 … 143 - 149 772,244 - 104 Mar.
4月 … 159 - 148 645,549 - 118 Apr.
5月 … 202 - 160 630,939 - 156 May
6月 … 250 - 261 706,720 - 145 Jun.
7月 … 188 - 121 394,268 - 212 Jul.
8月 … 246 - 295 727,197 - 163 Aug.
9月 … 284 - 216 679,674 - 231 Sep.
10月 … 219 - 215 695,109 - 234 Oct.
11月 … 251 - 138 597,710 - 347 Nov.
12月 … 248 - 381 761,533 - 215 Dec.
年 月
(16) 防振ゴム Anti-vibration rubber
Year andMonth
生産数量 Production 受入数量ReceiptQuantity
出荷数量 Shipment在庫数量InventoryQuantity
数 量
Quantity
新ゴム量
New rubber
販 売 Salesそ の 他Others
Quantity
単位:新ゴム量 (t) / Unit: new rubber (t)
数 量Quantity
金額(千円)
Value(Thousand Yen)
年 月
(17) 防げん材 Marine fender
Year andMonth
生産数量 Production 受入数量ReceiptQuantity
出荷数量 Shipment在庫数量InventoryQuantity
そ の 他Others
Quantity
数 量Quantity
金額(千円)
Value(Thousand Yen)
数 量
Quantity
新ゴム量
New rubber
販 売 Sales
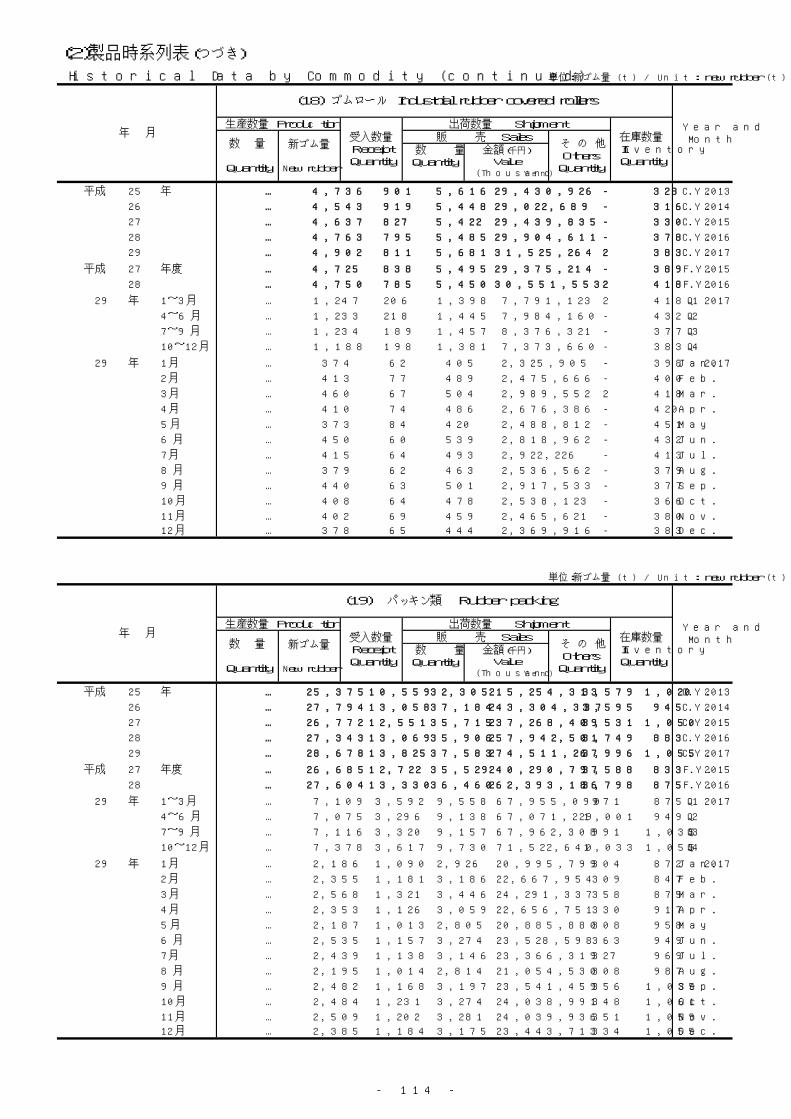
- 114 -
(2)製品時系列表(つづき)
Historical Data by Commodity (continued) 単位:新ゴム量 (t) / Unit: new rubber (t)
平成 25 年 … 4,736 901 5,616 29,430,926 - 328 C.Y. 2013
26 … 4,543 919 5,448 29,022,689 - 316 C.Y. 2014
27 … 4,637 827 5,422 29,439,835 - 330 C.Y. 2015
28 … 4,763 795 5,485 29,904,611 - 378 C.Y. 2016
29 … 4,902 811 5,681 31,525,264 2 383 C.Y. 2017
平成 27 年度 … 4,725 838 5,495 29,375,214 - 389 F.Y. 2015
28 … 4,750 785 5,450 30,551,553 2 418 F.Y. 2016
29 年 1~3月 … 1,247 206 1,398 7,791,123 2 418 Q1 2017
4~6月 … 1,233 218 1,445 7,984,160 - 432 Q2
7~9月 … 1,234 189 1,457 8,376,321 - 377 Q3
10~12月 … 1,188 198 1,381 7,373,660 - 383 Q4
29 年 1月 … 374 62 405 2,325,905 - 398 Jan. 2017
2月 … 413 77 489 2,475,666 - 400 Feb.
3月 … 460 67 504 2,989,552 2 418 Mar.
4月 … 410 74 486 2,676,386 - 420 Apr.
5月 … 373 84 420 2,488,812 - 451 May
6月 … 450 60 539 2,818,962 - 432 Jun.
7月 … 415 64 493 2,922,226 - 413 Jul.
8月 … 379 62 463 2,536,562 - 379 Aug.
9月 … 440 63 501 2,917,533 - 377 Sep.
10月 … 408 64 478 2,538,123 - 366 Oct.
11月 … 402 69 459 2,465,621 - 380 Nov.
12月 … 378 65 444 2,369,916 - 383 Dec.
単位:新ゴム量 (t) / Unit: new rubber (t)
平成 25 年 … 25,375 10,559 32,305 215,254,313 3,579 1,020 C.Y. 2013
26 … 27,794 13,058 37,184 243,304,337 3,595 945 C.Y. 2014
27 … 26,772 12,551 35,715 237,268,409 3,531 1,050 C.Y. 2015
28 … 27,343 13,069 35,906 257,942,501 3,749 883 C.Y. 2016
29 … 28,678 13,825 37,583 274,511,267 3,996 1,055 C.Y. 2017
平成 27 年度 … 26,685 12,722 35,529 240,290,797 3,588 833 F.Y. 2015
28 … 27,604 13,330 36,460 262,393,186 3,798 875 F.Y. 2016
29 年 1~3月 … 7,109 3,592 9,558 67,955,090 971 875 Q1 2017
4~6月 … 7,075 3,296 9,138 67,071,229 1,001 949 Q2
7~9月 … 7,116 3,320 9,157 67,962,308 991 1,035 Q3
10~12月 … 7,378 3,617 9,730 71,522,640 1,033 1,055 Q4
29 年 1月 … 2,186 1,090 2,926 20,995,799 304 872 Jan. 2017
2月 … 2,355 1,181 3,186 22,667,954 309 847 Feb.
3月 … 2,568 1,321 3,446 24,291,337 358 875 Mar.
4月 … 2,353 1,126 3,059 22,656,751 330 917 Apr.
5月 … 2,187 1,013 2,805 20,885,880 308 958 May
6月 … 2,535 1,157 3,274 23,528,598 363 949 Jun.
7月 … 2,439 1,138 3,146 23,366,319 327 969 Jul.
8月 … 2,195 1,014 2,814 21,054,530 308 987 Aug.
9月 … 2,482 1,168 3,197 23,541,459 356 1,035 Sep.
10月 … 2,484 1,231 3,274 24,038,991 348 1,061 Oct.
11月 … 2,509 1,202 3,281 24,039,936 351 1,059 Nov.
12月 … 2,385 1,184 3,175 23,443,713 334 1,055 Dec.
生産数量 Production 受入数量ReceiptQuantity
出荷数量 Shipment在庫数量InventoryQuantity
販 売 Salesそ の 他Others
Quantity
数 量
Quantity
新ゴム量
New rubber
年 月
(18) ゴムロール Industrial rubber covered rollers
Year andMonth
数 量Quantity
金額(千円)
Value(Thousand Yen)
年 月
(19) パッキン類 Rubber packing
Year andMonth
生産数量 Production 受入数量ReceiptQuantity
出荷数量 Shipment在庫数量InventoryQuantity
数 量
Quantity
新ゴム量
New rubber
販 売 Salesそ の 他Others
Quantity
数 量Quantity
金額(千円)
Value(Thousand Yen)
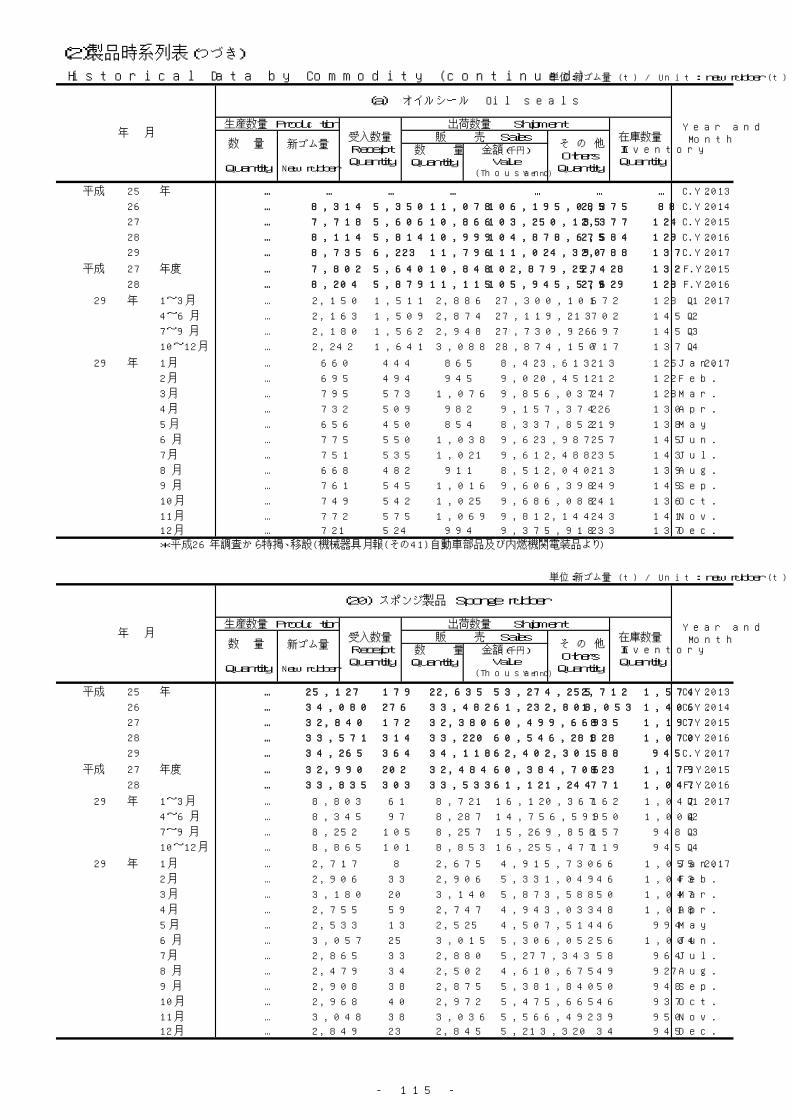
- 115 -
(2)製品時系列表(つづき)
Historical Data by Commodity (continued) 単位:新ゴム量 (t) / Unit: new rubber (t)
平成 25 年 … … … … … … … C.Y. 2013
26 … 8,314 5,350 11,078 106,195,085 2,375 88 C.Y. 2014
27 … 7,718 5,606 10,866 103,250,135 2,377 124 C.Y. 2015
28 … 8,114 5,814 10,999 104,878,675 2,584 129 C.Y. 2016
29 … 8,735 6,223 11,796 111,024,390 2,788 137 C.Y. 2017
平成 27 年度 … 7,802 5,640 10,848 102,879,257 2,428 132 F.Y. 2015
28 … 8,204 5,879 11,115 105,945,579 2,629 128 F.Y. 2016
29 年 1~3月 … 2,150 1,511 2,886 27,300,101 672 128 Q1 2017
4~6月 … 2,163 1,509 2,874 27,119,213 702 145 Q2
7~9月 … 2,180 1,562 2,948 27,730,926 697 145 Q3
10~12月 … 2,242 1,641 3,088 28,874,150 717 137 Q4
29 年 1月 … 660 444 865 8,423,613 213 125 Jan. 2017
2月 … 695 494 945 9,020,451 212 122 Feb.
3月 … 795 573 1,076 9,856,037 247 128 Mar.
4月 … 732 509 982 9,157,374 226 130 Apr.
5月 … 656 450 854 8,337,852 219 138 May
6月 … 775 550 1,038 9,623,987 257 145 Jun.
7月 … 751 535 1,021 9,612,488 235 143 Jul.
8月 … 668 482 911 8,512,040 213 139 Aug.
9月 … 761 545 1,016 9,606,398 249 145 Sep.
10月 … 749 542 1,025 9,686,088 241 136 Oct.
11月 … 772 575 1,069 9,812,144 243 141 Nov.
12月 … 721 524 994 9,375,918 233 137 Dec.
*平成26年調査から特掲、移設(機械器具月報(その41)自動車部品及び内燃機関電装品より)
単位:新ゴム量 (t) / Unit: new rubber (t)
平成 25 年 … 25,127 179 22,635 53,274,255 2,712 1,574 C.Y. 2013
26 … 34,080 276 33,482 61,232,808 1,053 1,406 C.Y. 2014
27 … 32,840 172 32,380 60,499,669 835 1,197 C.Y. 2015
28 … 33,571 314 33,220 60,546,281 828 1,070 C.Y. 2016
29 … 34,265 364 34,118 62,402,301 588 945 C.Y. 2017
平成 27 年度 … 32,990 202 32,484 60,384,706 823 1,179 F.Y. 2015
28 … 33,835 303 33,533 61,121,244 771 1,047 F.Y. 2016
29 年 1~3月 … 8,803 61 8,721 16,120,367 162 1,047 Q1 2017
4~6月 … 8,345 97 8,287 14,756,599 150 1,004 Q2
7~9月 … 8,252 105 8,257 15,269,858 157 948 Q3
10~12月 … 8,865 101 8,853 16,255,477 119 945 Q4
29 年 1月 … 2,717 8 2,675 4,915,730 66 1,055 Jan. 2017
2月 … 2,906 33 2,906 5,331,049 46 1,043 Feb.
3月 … 3,180 20 3,140 5,873,588 50 1,047 Mar.
4月 … 2,755 59 2,747 4,943,033 48 1,018 Apr.
5月 … 2,533 13 2,525 4,507,514 46 994 May
6月 … 3,057 25 3,015 5,306,052 56 1,004 Jun.
7月 … 2,865 33 2,880 5,277,343 58 964 Jul.
8月 … 2,479 34 2,502 4,610,675 49 927 Aug.
9月 … 2,908 38 2,875 5,381,840 50 948 Sep.
10月 … 2,968 40 2,972 5,475,665 46 937 Oct.
11月 … 3,048 38 3,036 5,566,492 39 950 Nov.
12月 … 2,849 23 2,845 5,213,320 34 945 Dec.
(a) オイルシール Oil seals
Year andMonth
生産数量 Production 受入数量ReceiptQuantity
出荷数量 Shipment在庫数量InventoryQuantity
数 量Quantity
金額(千円)
Value(Thousand Yen)
年 月数 量
Quantity
新ゴム量
New rubber
販 売 Salesそ の 他Others
Quantity
年 月
(20) スポンジ製品 Sponge rubber
Year andMonth
生産数量 Production 受入数量ReceiptQuantity
出荷数量 Shipment在庫数量InventoryQuantity
数 量
Quantity
新ゴム量
New rubber
販 売 Salesそ の 他Others
Quantity
数 量Quantity
金額(千円)
Value(Thousand Yen)
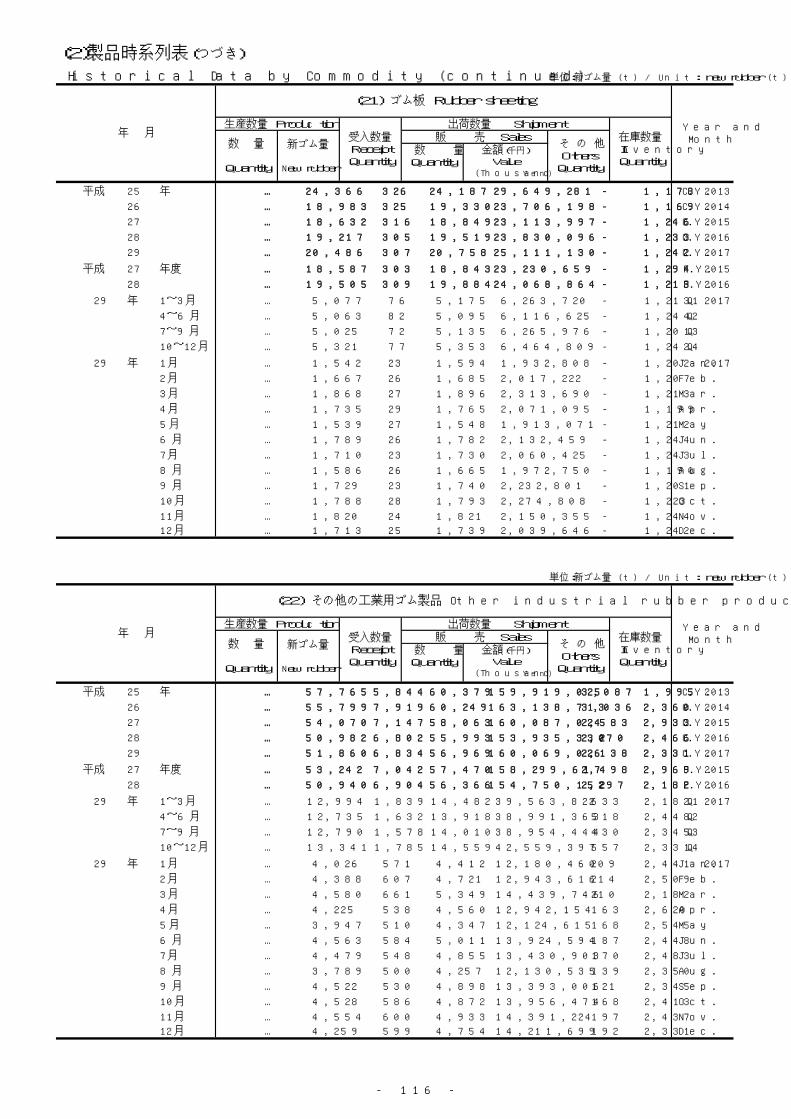
- 116 -
(2)製品時系列表(つづき)
Historical Data by Commodity (continued) 単位:新ゴム量 (t) / Unit: new rubber (t)
平成 25 年 … 24,366 326 24,187 29,649,281 - 1,178 C.Y. 2013
26 … 18,983 325 19,330 23,706,198 - 1,169 C.Y. 2014
27 … 18,632 316 18,849 23,113,997 - 1,246 C.Y. 2015
28 … 19,217 305 19,519 23,830,096 - 1,233 C.Y. 2016
29 … 20,486 307 20,758 25,111,130 - 1,242 C.Y. 2017
平成 27 年度 … 18,587 303 18,843 23,230,659 - 1,294 F.Y. 2015
28 … 19,505 309 19,884 24,068,864 - 1,213 F.Y. 2016
29 年 1~3月 … 5,077 76 5,175 6,263,720 - 1,213 Q1 2017
4~6月 … 5,063 82 5,095 6,116,625 - 1,244 Q2
7~9月 … 5,025 72 5,135 6,265,976 - 1,201 Q3
10~12月 … 5,321 77 5,353 6,464,809 - 1,242 Q4
29 年 1月 … 1,542 23 1,594 1,932,808 - 1,202 Jan. 2017
2月 … 1,667 26 1,685 2,017,222 - 1,207 Feb.
3月 … 1,868 27 1,896 2,313,690 - 1,213 Mar.
4月 … 1,735 29 1,765 2,071,095 - 1,199 Apr.
5月 … 1,539 27 1,548 1,913,071 - 1,212 May
6月 … 1,789 26 1,782 2,132,459 - 1,244 Jun.
7月 … 1,710 23 1,730 2,060,425 - 1,243 Jul.
8月 … 1,586 26 1,665 1,972,750 - 1,190 Aug.
9月 … 1,729 23 1,740 2,232,801 - 1,201 Sep.
10月 … 1,788 28 1,793 2,274,808 - 1,223 Oct.
11月 … 1,820 24 1,821 2,150,355 - 1,244 Nov.
12月 … 1,713 25 1,739 2,039,646 - 1,242 Dec.
単位:新ゴム量 (t) / Unit: new rubber (t)
平成 25 年 … 57,765 5,844 60,379 159,919,025 3,087 1,995 C.Y. 2013
26 … 55,799 7,919 60,249 163,138,713 3,036 2,360 C.Y. 2014
27 … 54,070 7,147 58,063 160,087,024 2,583 2,933 C.Y. 2015
28 … 50,982 6,802 55,993 153,935,330 2,270 2,466 C.Y. 2016
29 … 51,860 6,834 56,969 160,069,026 2,138 2,331 C.Y. 2017
平成 27 年度 … 53,242 7,042 57,470 158,299,617 2,498 2,969 F.Y. 2015
28 … 50,940 6,904 56,366 154,750,152 2,297 2,182 F.Y. 2016
29 年 1~3月 … 12,994 1,839 14,482 39,563,822 633 2,182 Q1 2017
4~6月 … 12,735 1,632 13,918 38,991,363 518 2,448 Q2
7~9月 … 12,790 1,578 14,010 38,954,444 430 2,345 Q3
10~12月 … 13,341 1,785 14,559 42,559,397 557 2,331 Q4
29 年 1月 … 4,026 571 4,412 12,180,460 209 2,441 Jan. 2017
2月 … 4,388 607 4,721 12,943,616 214 2,509 Feb.
3月 … 4,580 661 5,349 14,439,746 210 2,182 Mar.
4月 … 4,225 538 4,560 12,942,154 163 2,620 Apr.
5月 … 3,947 510 4,347 12,124,615 168 2,545 May
6月 … 4,563 584 5,011 13,924,594 187 2,448 Jun.
7月 … 4,479 548 4,855 13,430,903 170 2,483 Jul.
8月 … 3,789 500 4,257 12,130,535 139 2,350 Aug.
9月 … 4,522 530 4,898 13,393,006 121 2,345 Sep.
10月 … 4,528 586 4,872 13,956,474 168 2,413 Oct.
11月 … 4,554 600 4,933 14,391,224 197 2,437 Nov.
12月 … 4,259 599 4,754 14,211,699 192 2,331 Dec.
出荷数量 Shipment在庫数量InventoryQuantity
生産数量 Production 受入数量ReceiptQuantity
数 量
Quantity
新ゴム量
New rubber
年 月
(21) ゴム板 Rubber sheeting
販 売 Salesそ の 他Others
Quantity
数 量Quantity
金額(千円)
Value(Thousand Yen)
Year andMonth
Year andMonth
出荷数量 Shipment在庫数量InventoryQuantity
生産数量 Production 受入数量ReceiptQuantity
数 量
Quantity
新ゴム量
New rubber
年 月
(22) その他の工業用ゴム製品 Other industrial rubber products
販 売 Salesそ の 他Others
Quantity
数 量Quantity
金額(千円)
Value(Thousand Yen)
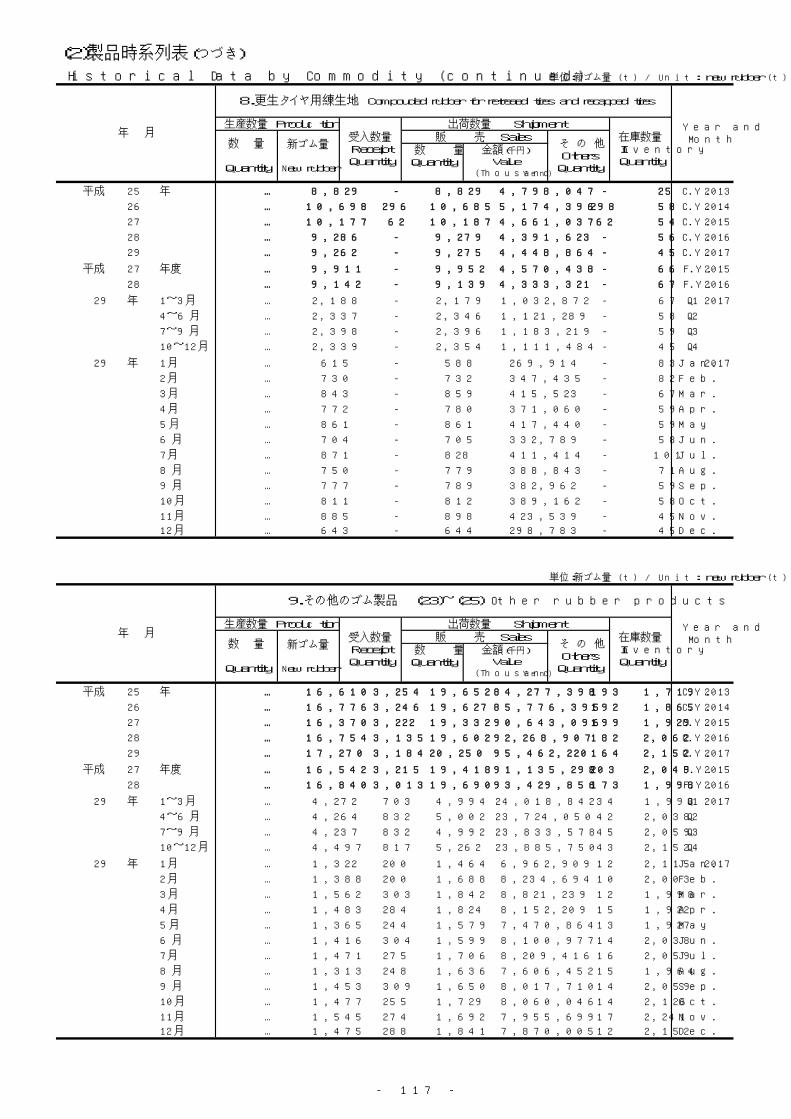
- 117 -
(2)製品時系列表(つづき)
Historical Data by Commodity (continued) 単位:新ゴム量 (t) / Unit: new rubber (t)
平成 25 年 … 8,829 - 8,829 4,798,047 - 25 C.Y. 2013
26 … 10,698 296 10,685 5,174,396 298 58 C.Y. 2014
27 … 10,177 62 10,187 4,661,037 62 54 C.Y. 2015
28 … 9,286 - 9,279 4,391,623 - 56 C.Y. 2016
29 … 9,262 - 9,275 4,448,864 - 45 C.Y. 2017
平成 27 年度 … 9,911 - 9,952 4,570,438 - 66 F.Y. 2015
28 … 9,142 - 9,139 4,333,321 - 67 F.Y. 2016
29 年 1~3月 … 2,188 - 2,179 1,032,872 - 67 Q1 2017
4~6月 … 2,337 - 2,346 1,121,289 - 58 Q2
7~9月 … 2,398 - 2,396 1,183,219 - 59 Q3
10~12月 … 2,339 - 2,354 1,111,484 - 45 Q4
29 年 1月 … 615 - 588 269,914 - 83 Jan. 2017
2月 … 730 - 732 347,435 - 82 Feb.
3月 … 843 - 859 415,523 - 67 Mar.
4月 … 772 - 780 371,060 - 59 Apr.
5月 … 861 - 861 417,440 - 59 May
6月 … 704 - 705 332,789 - 58 Jun.
7月 … 871 - 828 411,414 - 101 Jul.
8月 … 750 - 779 388,843 - 71 Aug.
9月 … 777 - 789 382,962 - 59 Sep.
10月 … 811 - 812 389,162 - 58 Oct.
11月 … 885 - 898 423,539 - 45 Nov.
12月 … 643 - 644 298,783 - 45 Dec.
単位:新ゴム量 (t) / Unit: new rubber (t)
平成 25 年 … 16,610 3,254 19,652 84,277,398 193 1,719 C.Y. 2013
26 … 16,776 3,246 19,627 85,776,395 192 1,865 C.Y. 2014
27 … 16,370 3,222 19,332 90,643,096 199 1,929 C.Y. 2015
28 … 16,754 3,135 19,602 92,268,907 182 2,062 C.Y. 2016
29 … 17,270 3,184 20,250 95,462,220 164 2,152 C.Y. 2017
平成 27 年度 … 16,542 3,215 19,418 91,135,298 203 2,049 F.Y. 2015
28 … 16,840 3,013 19,690 93,429,856 173 1,998 F.Y. 2016
29 年 1~3月 … 4,272 703 4,994 24,018,842 34 1,998 Q1 2017
4~6月 … 4,264 832 5,002 23,724,050 42 2,038 Q2
7~9月 … 4,237 832 4,992 23,833,578 45 2,059 Q3
10~12月 … 4,497 817 5,262 23,885,750 43 2,152 Q4
29 年 1月 … 1,322 200 1,464 6,962,909 12 2,115 Jan. 2017
2月 … 1,388 200 1,688 8,234,694 10 2,003 Feb.
3月 … 1,562 303 1,842 8,821,239 12 1,998 Mar.
4月 … 1,483 284 1,824 8,152,209 15 1,922 Apr.
5月 … 1,365 244 1,579 7,470,864 13 1,927 May
6月 … 1,416 304 1,599 8,100,977 14 2,038 Jun.
7月 … 1,471 275 1,706 8,209,416 16 2,059 Jul.
8月 … 1,313 248 1,636 7,606,452 15 1,964 Aug.
9月 … 1,453 309 1,650 8,017,710 14 2,059 Sep.
10月 … 1,477 255 1,729 8,060,046 14 2,126 Oct.
11月 … 1,545 274 1,692 7,955,699 17 2,241 Nov.
12月 … 1,475 288 1,841 7,870,005 12 2,152 Dec.
Year andMonth
生産数量 Production 受入数量ReceiptQuantity
出荷数量 Shipment在庫数量InventoryQuantity
数 量
Quantity
新ゴム量
New rubber
販 売 Salesそ の 他Others
Quantity
数 量Quantity
金額(千円)
Value(Thousand Yen)
年 月
8.更生タイヤ用練生地 Compouded rubber for retreaed tires and recapped tires
年 月
9.その他のゴム製品 (23)~(25) Other rubber products
Year andMonth
生産数量 Production 受入数量ReceiptQuantity
出荷数量 Shipment在庫数量InventoryQuantity
数 量
Quantity
新ゴム量
New rubber
販 売 Salesそ の 他Others
Quantity
数 量Quantity
金額(千円)
Value(Thousand Yen)

- 118 -
(2)製品時系列表(つづき)
Historical Data by Commodity (continued) 単位:新ゴム量 (t) / Unit: new rubber (t)
平成 25 年 … 4,956 18 4,950 35,485,859 - 384 C.Y. 2013
26 … 4,921 26 4,958 35,927,775 - 353 C.Y. 2014
27 … 5,091 25 5,142 40,813,373 - 324 C.Y. 2015
28 … 5,306 45 5,329 45,362,107 - 423 C.Y. 2016
29 … 5,411 45 5,521 48,254,741 - 447 C.Y. 2017
平成 27 年度 … 5,181 31 5,261 42,247,488 - 431 F.Y. 2015
28 … 5,246 47 5,264 46,431,982 - 466 F.Y. 2016
29 年 1~3月 … 1,291 14 1,263 11,722,829 - 466 Q1 2017
4~6月 … 1,355 11 1,374 12,280,964 - 457 Q2
7~9月 … 1,363 9 1,374 12,223,132 - 456 Q3
10~12月 … 1,402 11 1,510 12,027,816 - 447 Q4
29 年 1月 … 402 6 397 3,498,775 - 445 Jan. 2017
2月 … 418 4 430 4,053,074 - 439 Feb.
3月 … 471 4 436 4,170,980 - 466 Mar.
4月 … 474 4 477 4,172,122 - 471 Apr.
5月 … 419 4 428 3,903,530 - 460 May
6月 … 462 3 469 4,205,312 - 457 Jun.
7月 … 459 3 455 4,257,893 - 467 Jul.
8月 … 428 3 448 3,894,730 - 448 Aug.
9月 … 476 3 471 4,070,509 - 456 Sep.
10月 … 473 3 548 4,165,689 - 467 Oct.
11月 … 476 5 473 3,938,273 - 478 Nov.
12月 … 453 3 489 3,923,854 - 447 Dec.
単位:新ゴム量 (t) / Unit: new rubber (t)
平成 25 年 … 2,809 - 2,845 14,933,574 - 226 C.Y. 2013
26 … 2,920 - 2,868 14,798,868 - 275 C.Y. 2014
27 … 2,766 - 2,789 15,440,859 - 263 C.Y. 2015
28 … 2,942 - 2,931 15,616,069 - 285 C.Y. 2016
29 … 2,676 - 2,703 15,383,678 - 261 C.Y. 2017
平成 27 年度 … 2,775 - 2,760 15,441,783 - 280 F.Y. 2015
28 … 2,938 - 2,934 15,773,823 - 294 F.Y. 2016
29 年 1~3月 … 720 - 712 4,477,433 - 294 Q1 2017
4~6月 … 624 - 667 3,653,456 - 253 Q2
7~9月 … 627 - 640 3,635,402 - 240 Q3
10~12月 … 705 - 684 3,617,387 - 261 Q4
29 年 1月 … 222 - 154 1,052,615 - 353 Jan. 2017
2月 … 237 - 257 1,665,421 - 333 Feb.
3月 … 261 - 301 1,759,397 - 294 Mar.
4月 … 214 - 284 1,323,187 - 224 Apr.
5月 … 200 - 190 1,154,978 - 234 May
6月 … 210 - 193 1,175,291 - 253 Jun.
7月 … 219 - 188 1,137,252 - 284 Jul.
8月 … 187 - 227 1,224,246 - 244 Aug.
9月 … 221 - 225 1,273,904 - 240 Sep.
10月 … 232 - 214 1,087,636 - 258 Oct.
11月 … 247 - 184 1,195,618 - 321 Nov.
12月 … 226 - 286 1,334,133 - 261 Dec.
年 月
(23) 医療・衛生用 Rubber products for medical and surgical dressings
Year andMonth
生産数量 Production 受入数量ReceiptQuantity
出荷数量 Shipment在庫数量InventoryQuantity
数 量
Quantity
新ゴム量
New rubber
販 売 Salesそ の 他Others
Quantity
数 量Quantity
金額(千円)
Value(Thousand Yen)
年 月
(24) 運動競技用品 For athletics
Year andMonth
生産数量 Production 受入数量ReceiptQuantity
出荷数量 Shipment在庫数量InventoryQuantity
数 量
Quantity
新ゴム量
New rubber
販 売 Salesそ の 他Others
Quantity
数 量Quantity
金額(千円)
Value(Thousand Yen)
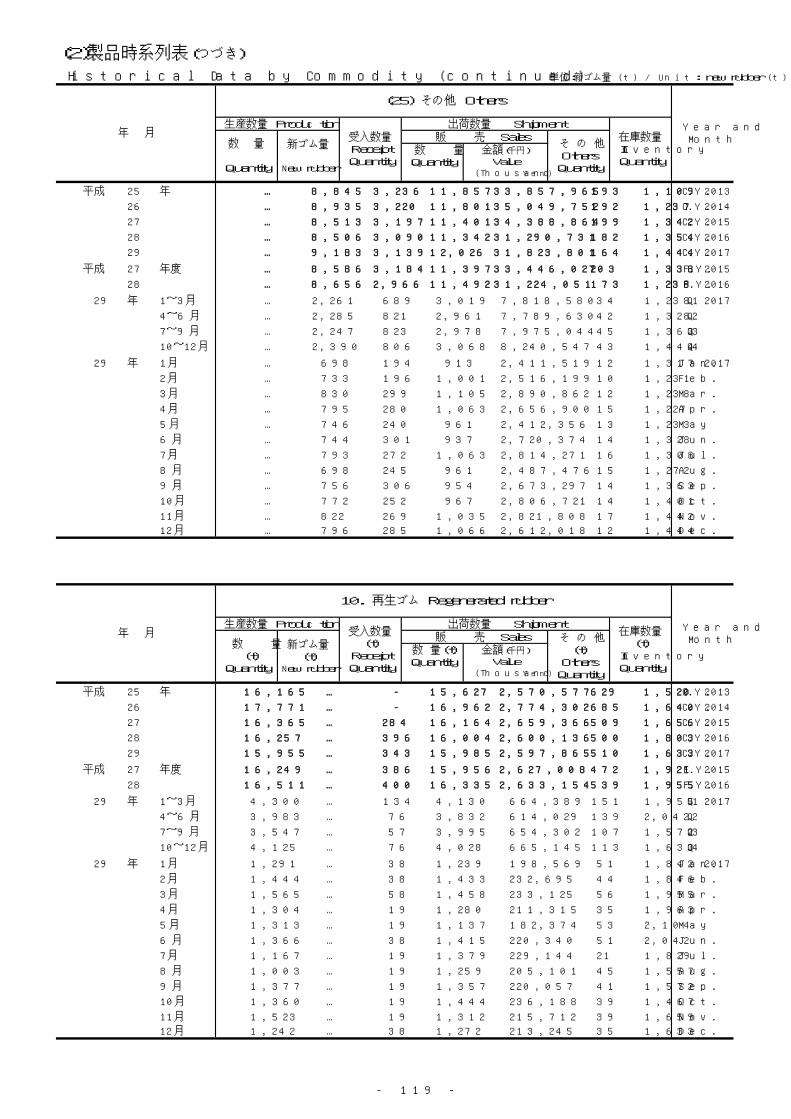
- 119 -
(2)製品時系列表(つづき)
Historical Data by Commodity (continued) 単位:新ゴム量 (t) / Unit: new rubber (t)
平成 25 年 … 8,845 3,236 11,857 33,857,965 193 1,109 C.Y. 2013
26 … 8,935 3,220 11,801 35,049,752 192 1,237 C.Y. 2014
27 … 8,513 3,197 11,401 34,388,864 199 1,342 C.Y. 2015
28 … 8,506 3,090 11,342 31,290,731 182 1,354 C.Y. 2016
29 … 9,183 3,139 12,026 31,823,801 164 1,444 C.Y. 2017
平成 27 年度 … 8,586 3,184 11,397 33,446,027 203 1,338 F.Y. 2015
28 … 8,656 2,966 11,492 31,224,051 173 1,238 F.Y. 2016
29 年 1~3月 … 2,261 689 3,019 7,818,580 34 1,238 Q1 2017
4~6月 … 2,285 821 2,961 7,789,630 42 1,328 Q2
7~9月 … 2,247 823 2,978 7,975,044 45 1,363 Q3
10~12月 … 2,390 806 3,068 8,240,547 43 1,444 Q4
29 年 1月 … 698 194 913 2,411,519 12 1,317 Jan. 2017
2月 … 733 196 1,001 2,516,199 10 1,231 Feb.
3月 … 830 299 1,105 2,890,862 12 1,238 Mar.
4月 … 795 280 1,063 2,656,900 15 1,227 Apr.
5月 … 746 240 961 2,412,356 13 1,233 May
6月 … 744 301 937 2,720,374 14 1,328 Jun.
7月 … 793 272 1,063 2,814,271 16 1,308 Jul.
8月 … 698 245 961 2,487,476 15 1,272 Aug.
9月 … 756 306 954 2,673,297 14 1,363 Sep.
10月 … 772 252 967 2,806,721 14 1,401 Oct.
11月 … 822 269 1,035 2,821,808 17 1,442 Nov.
12月 … 796 285 1,066 2,612,018 12 1,444 Dec.
平成 25 年 16,165 … - 15,627 2,570,577 629 1,520 C.Y. 2013
26 17,771 … - 16,962 2,774,302 685 1,640 C.Y. 2014
27 16,365 … 284 16,164 2,659,366 509 1,656 C.Y. 2015
28 16,257 … 396 16,004 2,600,136 500 1,803 C.Y. 2016
29 15,955 … 343 15,985 2,597,865 510 1,633 C.Y. 2017
平成 27 年度 16,249 … 386 15,956 2,627,008 472 1,921 F.Y. 2015
28 16,511 … 400 16,335 2,633,154 539 1,955 F.Y. 2016
29 年 1~3月 4,300 … 134 4,130 664,389 151 1,955 Q1 2017
4~6月 3,983 … 76 3,832 614,029 139 2,042 Q2
7~9月 3,547 … 57 3,995 654,302 107 1,572 Q3
10~12月 4,125 … 76 4,028 665,145 113 1,633 Q4
29 年 1月 1,291 … 38 1,239 198,569 51 1,842 Jan. 2017
2月 1,444 … 38 1,433 232,695 44 1,846 Feb.
3月 1,565 … 58 1,458 233,125 56 1,955 Mar.
4月 1,304 … 19 1,280 211,315 35 1,963 Apr.
5月 1,313 … 19 1,137 182,374 53 2,104 May
6月 1,366 … 38 1,415 220,340 51 2,042 Jun.
7月 1,167 … 19 1,379 229,144 21 1,829 Jul.
8月 1,003 … 19 1,259 205,101 45 1,557 Aug.
9月 1,377 … 19 1,357 220,057 41 1,572 Sep.
10月 1,360 … 19 1,444 236,188 39 1,467 Oct.
11月 1,523 … 19 1,312 215,712 39 1,659 Nov.
12月 1,242 … 38 1,272 213,245 35 1,633 Dec.
年 月
(25) その他 Others
Year andMonth
生産数量 Production 受入数量ReceiptQuantity
出荷数量 Shipment在庫数量InventoryQuantity
数 量
Quantity
新ゴム量
New rubber
販 売 Salesそ の 他Others
Quantity
数 量Quantity
金額(千円)
Value(Thousand Yen)
年 月
10. 再生ゴム Regenerated rubber
Year andMonth
生産数量 Production 受入数量
(t)ReceiptQuantity
出荷数量 Shipment在庫数量
(t)InventoryQuantity
数 量 (t)
Quantity
新ゴム量(t)
New rubber
販 売 Sales そ の 他(t)
OthersQuantity
数 量(t)Quantity
金額(千円)
Value(Thousand Yen)
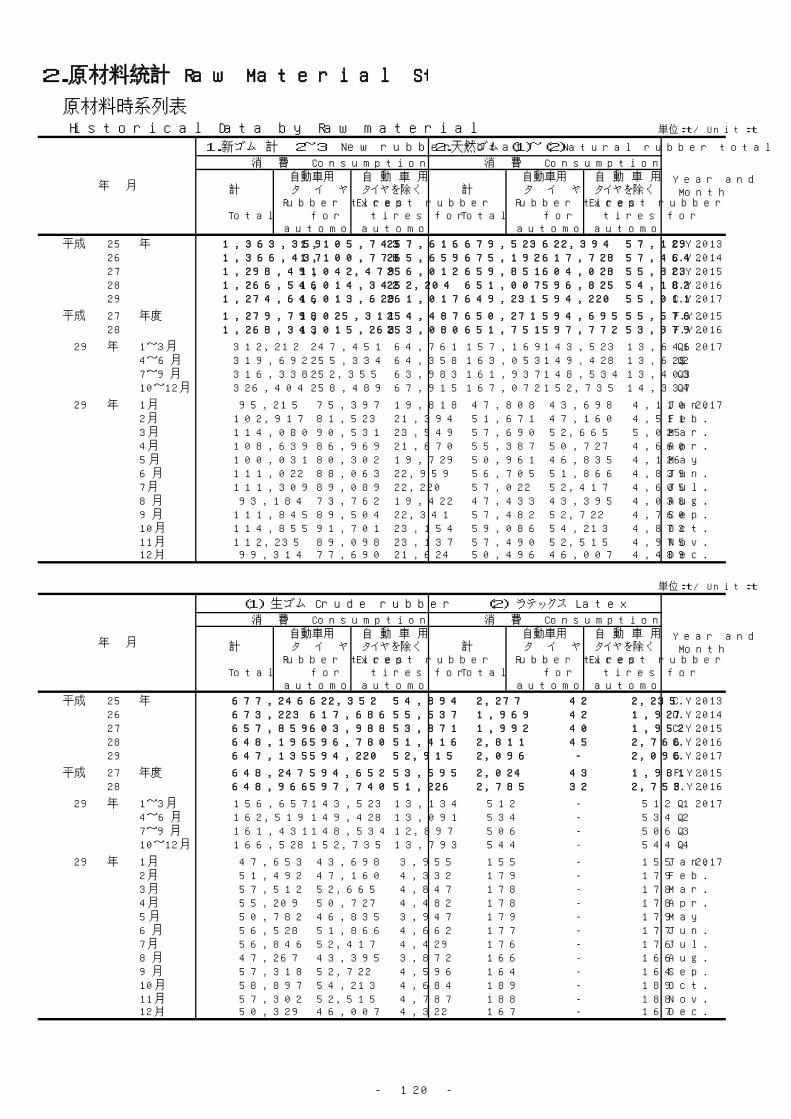
- 120 -
原材料時系列表 Historical Data by Raw material
1.新ゴム 計 2~3 New rubber total 2.天然ゴム (1)~(2) Natural rubber total
消 費 Consumption 消 費 Consumption
計
Total
自動車用タ イ ヤ
Rubber tires for
automobiles
自 動 車 用タイヤを除く
Except rubbertires for
automobiles
計
Total
自動車用タ イ ヤ
Rubber tires for
automobiles
自 動 車 用タイヤを除く
Except rubbertires for
automobiles
平成 25 年 1,363,359 1,105,743 257,616 679,523 622,394 57,129 C.Y. 2013 26 1,366,437 1,100,778 265,659 675,192 617,728 57,464 C.Y. 2014 27 1,298,491 1,042,479 256,012 659,851 604,028 55,823 C.Y. 2015 28 1,266,546 1,014,342 252,204 651,007 596,825 54,182 C.Y. 2016 29 1,274,646 1,013,629 261,017 649,231 594,220 55,011 C.Y. 2017
平成 27 年度 1,279,798 1,025,311 254,487 650,271 594,695 55,576 F.Y. 2015 28 1,268,343 1,015,263 253,080 651,751 597,772 53,979 F.Y. 2016
29 年 1~3月 312,212 247,451 64,761 157,169 143,523 13,646 Q1 20174~6月 319,692 255,334 64,358 163,053 149,428 13,625 Q27~9月 316,338 252,355 63,983 161,937 148,534 13,403 Q310~12月 326,404 258,489 67,915 167,072 152,735 14,337 Q4
29 年 1月 95,215 75,397 19,818 47,808 43,698 4,110 Jan. 20172月 102,917 81,523 21,394 51,671 47,160 4,511 Feb.3月 114,080 90,531 23,549 57,690 52,665 5,025 Mar.4月 108,639 86,969 21,670 55,387 50,727 4,660 Apr.5月 100,031 80,302 19,729 50,961 46,835 4,126 May 6月 111,022 88,063 22,959 56,705 51,866 4,839 Jun.7月 111,309 89,089 22,220 57,022 52,417 4,605 Jul.8月 93,184 73,762 19,422 47,433 43,395 4,038 Aug.9月 111,845 89,504 22,341 57,482 52,722 4,760 Sep.10月 114,855 91,701 23,154 59,086 54,213 4,873 Oct.11月 112,235 89,098 23,137 57,490 52,515 4,975 Nov.12月 99,314 77,690 21,624 50,496 46,007 4,489 Dec.
単位:t / Unit:t
(1) 生ゴム Crude rubber (2) ラテックス Latex
消 費 Consumption 消 費 Consumption
計
Total
自動車用タ イ ヤ
Rubber tires for
automobiles
自 動 車 用タイヤを除く
Except rubbertires for
automobiles
計
Total
自動車用タ イ ヤ
Rubber tires for
automobiles
自 動 車 用タイヤを除く
Except rubbertires for
automobiles
平成 25 年 677,246 622,352 54,894 2,277 42 2,235 C.Y. 2013 26 673,223 617,686 55,537 1,969 42 1,927 C.Y. 2014 27 657,859 603,988 53,871 1,992 40 1,952 C.Y. 2015 28 648,196 596,780 51,416 2,811 45 2,766 C.Y. 2016 29 647,135 594,220 52,915 2,096 - 2,096 C.Y. 2017
平成 27 年度 648,247 594,652 53,595 2,024 43 1,981 F.Y. 2015 28 648,966 597,740 51,226 2,785 32 2,753 F.Y. 2016
29 年 1~3月 156,657 143,523 13,134 512 - 512 Q1 20174~6月 162,519 149,428 13,091 534 - 534 Q27~9月 161,431 148,534 12,897 506 - 506 Q310~12月 166,528 152,735 13,793 544 - 544 Q4
29 年 1月 47,653 43,698 3,955 155 - 155 Jan. 20172月 51,492 47,160 4,332 179 - 179 Feb.3月 57,512 52,665 4,847 178 - 178 Mar.4月 55,209 50,727 4,482 178 - 178 Apr.5月 50,782 46,835 3,947 179 - 179 May 6月 56,528 51,866 4,662 177 - 177 Jun.7月 56,846 52,417 4,429 176 - 176 Jul.8月 47,267 43,395 3,872 166 - 166 Aug.9月 57,318 52,722 4,596 164 - 164 Sep.10月 58,897 54,213 4,684 189 - 189 Oct.11月 57,302 52,515 4,787 188 - 188 Nov.12月 50,329 46,007 4,322 167 - 167 Dec.
2.原材料統計 Raw Material Statistics
単位:t / Unit:t
年 月Year andMonth
年 月Year andMonth
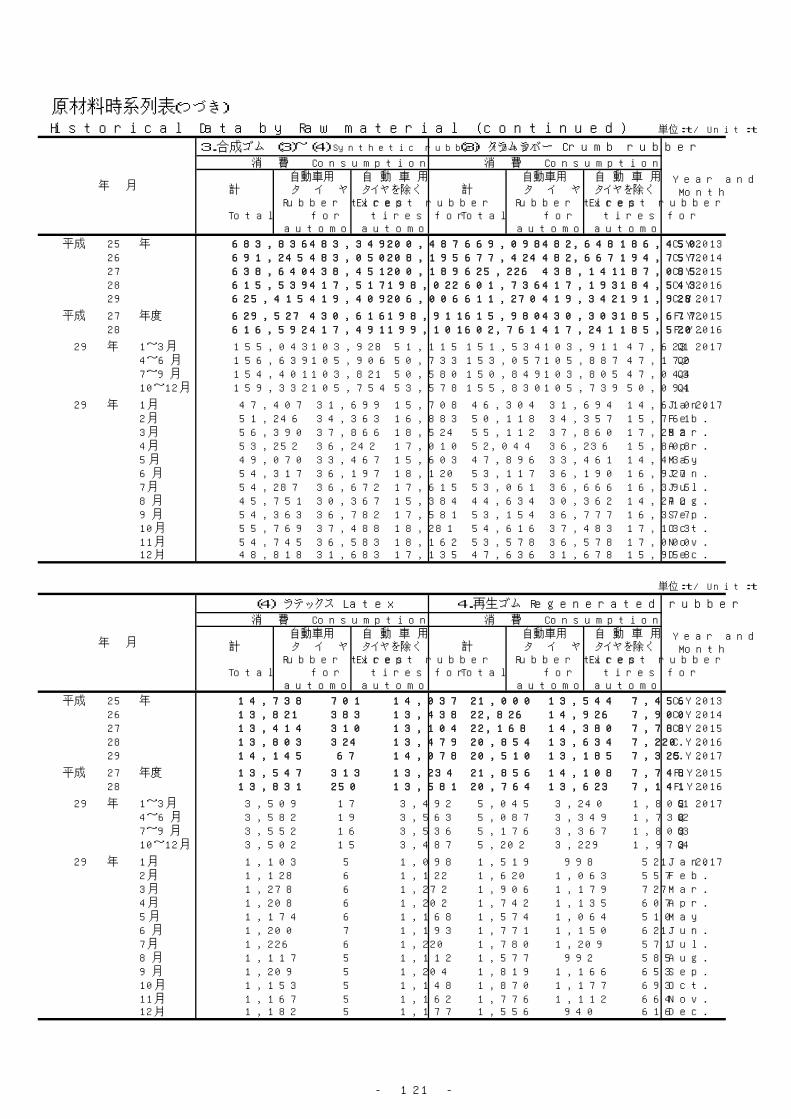
- 121 -
原材料時系列表(つづき)
Historical Data by Raw material (continued) 単位:t / Unit:t
3.合成ゴム (3)~(4) Synthetic rubber total (3) クラムラバー Crumb rubber
消 費 Consumption 消 費 Consumption
計
Total
自動車用タ イ ヤ
Rubber tires for
automobiles
自 動 車 用タイヤを除く
Except rubbertires for
automobiles
計
Total
自動車用タ イ ヤ
Rubber tires for
automobiles
自 動 車 用タイヤを除く
Except rubbertires for
automobiles
平成 25 年 683,836 483,349 200,487 669,098 482,648 186,450 C.Y. 2013 26 691,245 483,050 208,195 677,424 482,667 194,757 C.Y. 2014 27 638,640 438,451 200,189 625,226 438,141 187,085 C.Y. 2015 28 615,539 417,517 198,022 601,736 417,193 184,543 C.Y. 2016 29 625,415 419,409 206,006 611,270 419,342 191,928 C.Y. 2017
平成 27 年度 629,527 430,616 198,911 615,980 430,303 185,677 F.Y. 2015 28 616,592 417,491 199,101 602,761 417,241 185,520 F.Y. 2016
29 年 1~3月 155,043 103,928 51,115 151,534 103,911 47,623 Q1 20174~6月 156,639 105,906 50,733 153,057 105,887 47,170 Q27~9月 154,401 103,821 50,580 150,849 103,805 47,044 Q310~12月 159,332 105,754 53,578 155,830 105,739 50,091 Q4
29 年 1月 47,407 31,699 15,708 46,304 31,694 14,610 Jan. 20172月 51,246 34,363 16,883 50,118 34,357 15,761 Feb.3月 56,390 37,866 18,524 55,112 37,860 17,252 Mar.4月 53,252 36,242 17,010 52,044 36,236 15,808 Apr.5月 49,070 33,467 15,603 47,896 33,461 14,435 May 6月 54,317 36,197 18,120 53,117 36,190 16,927 Jun.7月 54,287 36,672 17,615 53,061 36,666 16,395 Jul.8月 45,751 30,367 15,384 44,634 30,362 14,272 Aug.9月 54,363 36,782 17,581 53,154 36,777 16,377 Sep.10月 55,769 37,488 18,281 54,616 37,483 17,133 Oct.11月 54,745 36,583 18,162 53,578 36,578 17,000 Nov.12月 48,818 31,683 17,135 47,636 31,678 15,958 Dec.
単位:t / Unit:t
(4) ラテックス Latex 4.再生ゴム Regenerated rubber
消 費 Consumption 消 費 Consumption
計
Total
自動車用タ イ ヤ
Rubber tires for
automobiles
自 動 車 用タイヤを除く
Except rubbertires for
automobiles
計
Total
自動車用タ イ ヤ
Rubber tires for
automobiles
自 動 車 用タイヤを除く
Except rubbertires for
automobiles
平成 25 年 14,738 701 14,037 21,000 13,544 7,456 C.Y. 2013 26 13,821 383 13,438 22,826 14,926 7,900 C.Y. 2014 27 13,414 310 13,104 22,168 14,380 7,788 C.Y. 2015 28 13,803 324 13,479 20,854 13,634 7,220 C.Y. 2016 29 14,145 67 14,078 20,510 13,185 7,325 C.Y. 2017
平成 27 年度 13,547 313 13,234 21,856 14,108 7,748 F.Y. 2015 28 13,831 250 13,581 20,764 13,623 7,141 F.Y. 2016
29 年 1~3月 3,509 17 3,492 5,045 3,240 1,805 Q1 20174~6月 3,582 19 3,563 5,087 3,349 1,738 Q27~9月 3,552 16 3,536 5,176 3,367 1,809 Q310~12月 3,502 15 3,487 5,202 3,229 1,973 Q4
29 年 1月 1,103 5 1,098 1,519 998 521 Jan. 20172月 1,128 6 1,122 1,620 1,063 557 Feb.3月 1,278 6 1,272 1,906 1,179 727 Mar.4月 1,208 6 1,202 1,742 1,135 607 Apr.5月 1,174 6 1,168 1,574 1,064 510 May 6月 1,200 7 1,193 1,771 1,150 621 Jun.7月 1,226 6 1,220 1,780 1,209 571 Jul.8月 1,117 5 1,112 1,577 992 585 Aug.9月 1,209 5 1,204 1,819 1,166 653 Sep.10月 1,153 5 1,148 1,870 1,177 693 Oct.11月 1,167 5 1,162 1,776 1,112 664 Nov.12月 1,182 5 1,177 1,556 940 616 Dec.
年 月Year andMonth
年 月Year andMonth
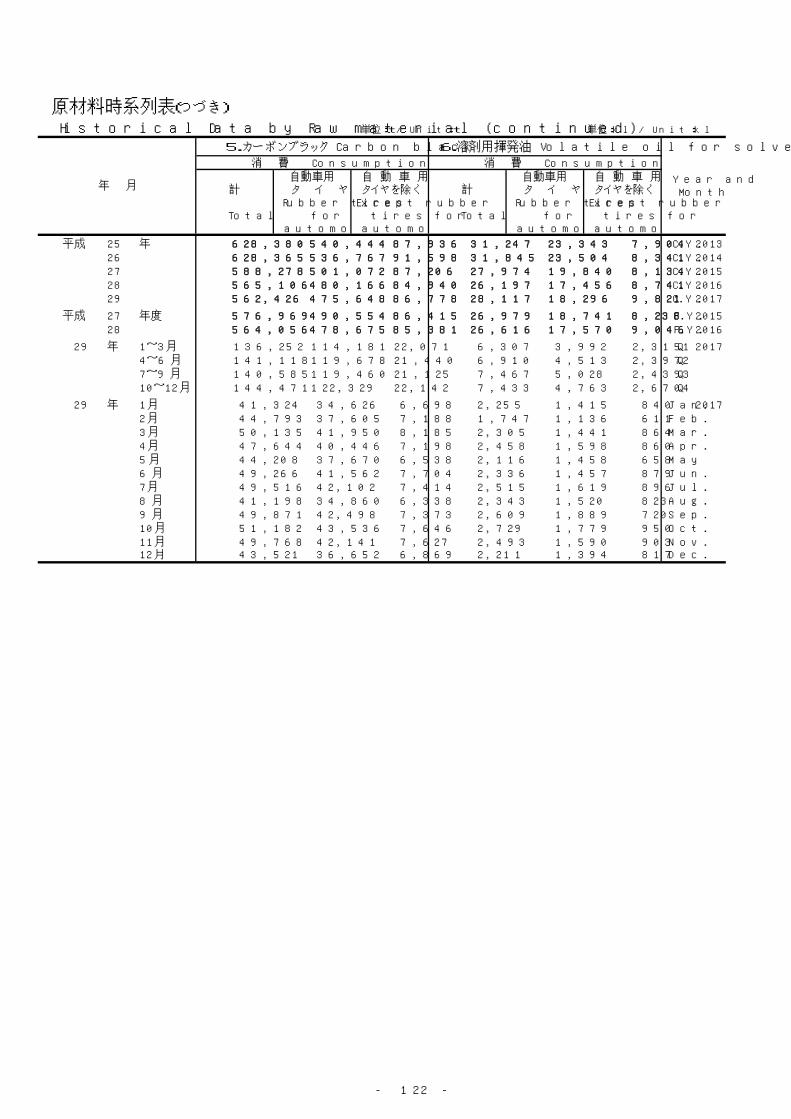
- 122 -
原材料時系列表(つづき)
Historical Data by Raw material (continued) 単位:t / Unit:t 単位:kl / Unit:kl
5.カーボンブラック Carbon black 6.溶剤用揮発油 Volatile oil for solvent
消 費 Consumption 消 費 Consumption
計
Total
自動車用タ イ ヤ
Rubber tires for
automobiles
自 動 車 用タイヤを除く
Except rubbertires for
automobiles
計
Total
自動車用タ イ ヤ
Rubber tires for
automobiles
自 動 車 用タイヤを除く
Except rubbertires for
automobiles
平成 25 年 628,380 540,444 87,936 31,247 23,343 7,904 C.Y. 2013 26 628,365 536,767 91,598 31,845 23,504 8,341 C.Y. 2014 27 588,278 501,072 87,206 27,974 19,840 8,134 C.Y. 2015 28 565,106 480,166 84,940 26,197 17,456 8,741 C.Y. 2016 29 562,426 475,648 86,778 28,117 18,296 9,821 C.Y. 2017
平成 27 年度 576,969 490,554 86,415 26,979 18,741 8,238 F.Y. 2015 28 564,056 478,675 85,381 26,616 17,570 9,046 F.Y. 2016
29 年 1~3月 136,252 114,181 22,071 6,307 3,992 2,315 Q1 20174~6月 141,118 119,678 21,440 6,910 4,513 2,397 Q27~9月 140,585 119,460 21,125 7,467 5,028 2,439 Q310~12月 144,471 122,329 22,142 7,433 4,763 2,670 Q4
29 年 1月 41,324 34,626 6,698 2,255 1,415 840 Jan. 20172月 44,793 37,605 7,188 1,747 1,136 611 Feb.3月 50,135 41,950 8,185 2,305 1,441 864 Mar.4月 47,644 40,446 7,198 2,458 1,598 860 Apr.5月 44,208 37,670 6,538 2,116 1,458 658 May 6月 49,266 41,562 7,704 2,336 1,457 879 Jun.7月 49,516 42,102 7,414 2,515 1,619 896 Jul.8月 41,198 34,860 6,338 2,343 1,520 823 Aug.9月 49,871 42,498 7,373 2,609 1,889 720 Sep.10月 51,182 43,536 7,646 2,729 1,779 950 Oct.11月 49,768 42,141 7,627 2,493 1,590 903 Nov.12月 43,521 36,652 6,869 2,211 1,394 817 Dec.
年 月Year andMonth
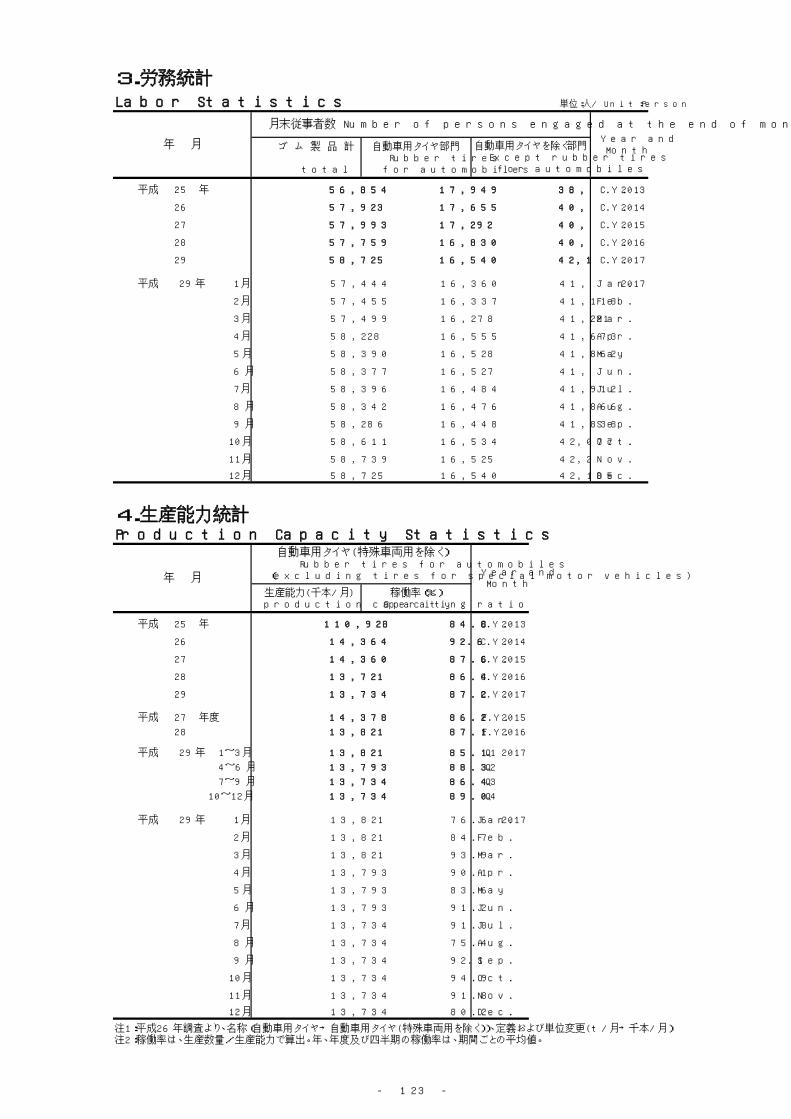
- 123 -
3.労務統計
Labor Statistics
ゴ ム 製 品 計
total
自動車用タイヤ部門Rubber tires
for automobiles
平成 25 年 56,854 17,949 C.Y. 2013
26 57,923 17,655 C.Y. 2014
27 57,993 17,292 C.Y. 2015
28 57,759 16,830 C.Y. 2016
29 58,725 16,540 C.Y. 2017
平成 29年 1月 57,444 16,360 Jan. 2017
2月 57,455 16,337 Feb.
3月 57,499 16,278 Mar.
4月 58,228 16,555 Apr.
5月 58,390 16,528 May
6月 58,377 16,527 Jun.
7月 58,396 16,484 Jul.
8月 58,342 16,476 Aug.
9月 58,286 16,448 Sep.
10月 58,611 16,534 Oct.
11月 58,739 16,525 Nov.
12月 58,725 16,540 Dec.
4.生産能力統計Production Capacity Statistics
生産能力(千本/月)production capacity
稼働率(%)Operating ratio
平成 25 年 110,928 84.8 C.Y. 2013
26 14,364 92.6 C.Y. 2014
27 14,360 87.6 C.Y. 2015
28 13,721 86.4 C.Y. 2016
29 13,734 87.2 C.Y. 2017
平成 27 年度 14,378 86.2 F.Y. 2015
28 13,821 87.1 F.Y. 2016
平成 29年 1~3月 13,821 85.1 Q1 2017
4~6月 13,793 88.3 Q2
7~9月 13,734 86.4 Q3
10~12月 13,734 89.0 Q4
平成 29年 1月 13,821 76.6 Jan. 2017
2月 13,821 84.7 Feb.
3月 13,821 93.9 Mar.
4月 13,793 90.1 Apr.
5月 13,793 83.6 May
6月 13,793 91.2 Jun.
7月 13,734 91.8 Jul.
8月 13,734 75.4 Aug.
9月 13,734 92.1 Sep.
10月 13,734 94.9 Oct.
11月 13,734 91.8 Nov.
12月 13,734 80.2 Dec.
単位:人/ Unit:Person
年 月
月末従事者数 Number of persons engaged at the end of month
Year andMonth自動車用タイヤを除く部門
Except rubber tiresfor automobiles
38,905
40,268
40,701
40,929
42,185
41,084
41,118
41,221
41,673
41,862
41,850
41,912
41,866
注1:平成26年調査より、名称(自動車用タイヤ→自動車用タイヤ(特殊車両用を除く))、定義および単位変更(t/月→千本/月)注2:稼働率は、生産数量/生産能力で算出。年、年度及び四半期の稼働率は、期間ごとの平均値。
41,838
42,077
42,214
42,185
年 月
自動車用タイヤ(特殊車両用を除く)Rubber tires for automobiles
(excluding tires for special motor vehicles) Year andMonth

- 124 -
平成29年 調査票一覧
調査票番号 調 査 票 名
4230 パルプ月報
4240 紙月報
4260 板紙月報
4290 段ボール月報
4295 紙おむつ月報
4300 印刷月報
6201 ゴム製品月報(自動車用タイヤ)
6202 ゴム製品月報(自動車用タイヤを除く)
6210 プラスチック製品月報

O⑱
政
府統
計
/ゞ
経済
産業
省生
産動
態統
計調
在
ルプ
(平成
29
年
月 一 卵報
基幹
統経
済産
業省
生産
動態
統計
提出
先経
済産
業局
長
撮Ill
躙B
翌月
10
B
提出
部数
2
部
1-1
. 製
日ロ口
単位
:t
�
番出
荷
生産
消費
(製紙
用)販
売月
末在
庫そ
の他
数量
金額
(百万
円)
号A
B
C
D
E
F
製ク
パI 針
葉樹
0101
ラル
さら
しI 広
葉樹
0102
紙
フ トプ未
ざら
し01
03
}ゞサ
ーモ
メカ
ニカ
ルパ
ルプ
0104
ルリ
ファ
イナ
ー
グラ
ウン
ドパル
プ01
05
砕木
/�
ル
プ01
06
プそ
の他
製紙
パル
プ01
07
2.
原材
料単
位:
m'
こ番
消費
月末
在庫
号A
B
国原
木02
01
産
〗:
葉樹
0202
材葉
樹02
03
輸原
木02
04
入
ti:
葉樹
0205
材葉
樹02
06
3.
労務
単位
:人
番月
末従
事者
数分
号A
Jゞル
プ部
門03
01
事業
所03
02
1-2
. 製
品一
消費
内訳
単位
:t
番消
費(
製紙
用)
紙用
板紙
用
号A
B
製ク
パら
しI針
葉樹
0121
ラ
ルさ
I広葉
樹01
22
紙フ トプ
未ざ
らし
0123
)ゞサ
ーモ
メカ
ニカ
ルパ
ルプ
0124
リフ
ァイ
ナー
グラ
ウン
ドパル
プ01
25
ル砕
木)ゞ
ルプ
0126
プそ
の他
製紙
パル
プ01
27
備考
:薗
月に
比べ
大幅
な変
動が
あっ
た場
合は
、その
理由
を書
いて
くだ
さい
。
4.
生産
設傭
能力
区分
番基
(台)
数月
間生
産能
力(t
)万ロ
A
B
蒸ク
連続
式0
40
1 ラ
さら
しフ
パッ
チ式
04
02
浸tル
未ざ
らし
連続
式0
40
3
透プ
パッ
チ式
0404
その
他パ
ルプ
04
05
リフ
ァイ
ナー
・砕
木機
04
06
企業
名本
社又
は(T
)
(電話
) 本
店所
在地
事業
所名
事業
所(T
)
所在
地
報告
者作
成者
の(電
話)
の氏
名所
属部
署名
及び
氏名
統計
調査
番号
AIO
l7
!!
調査
票番
号年
月分
号 一 号 一 , . . . . . . . . . . . ―
所番
理番
: :
_整 _
. . . . . . . . . . . . ―
業
210
11
17
4
12
13
10
事都
道府
県"T"
, ! ; (平
成年
月日
作成
)
平成
24
. 1改
正経
済産
業省
(鉱
工業
動態
統計
室)
- 125 -

- 126 -

- 127 -
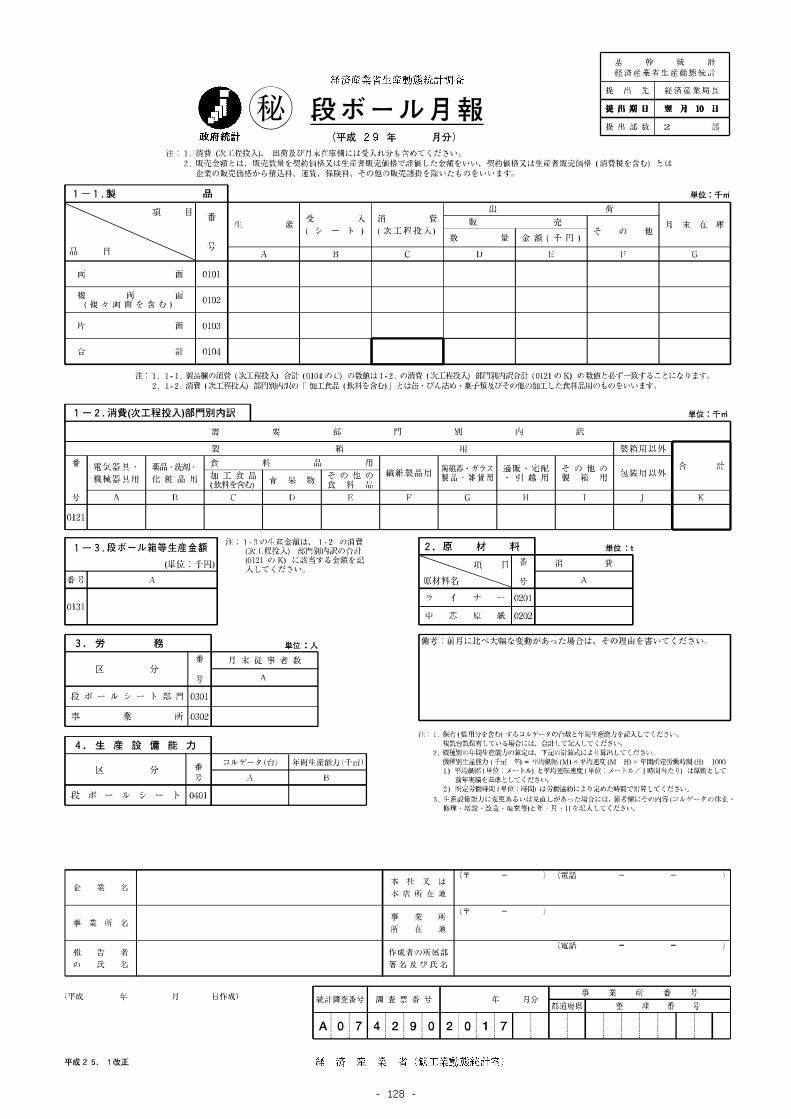
- 128 -
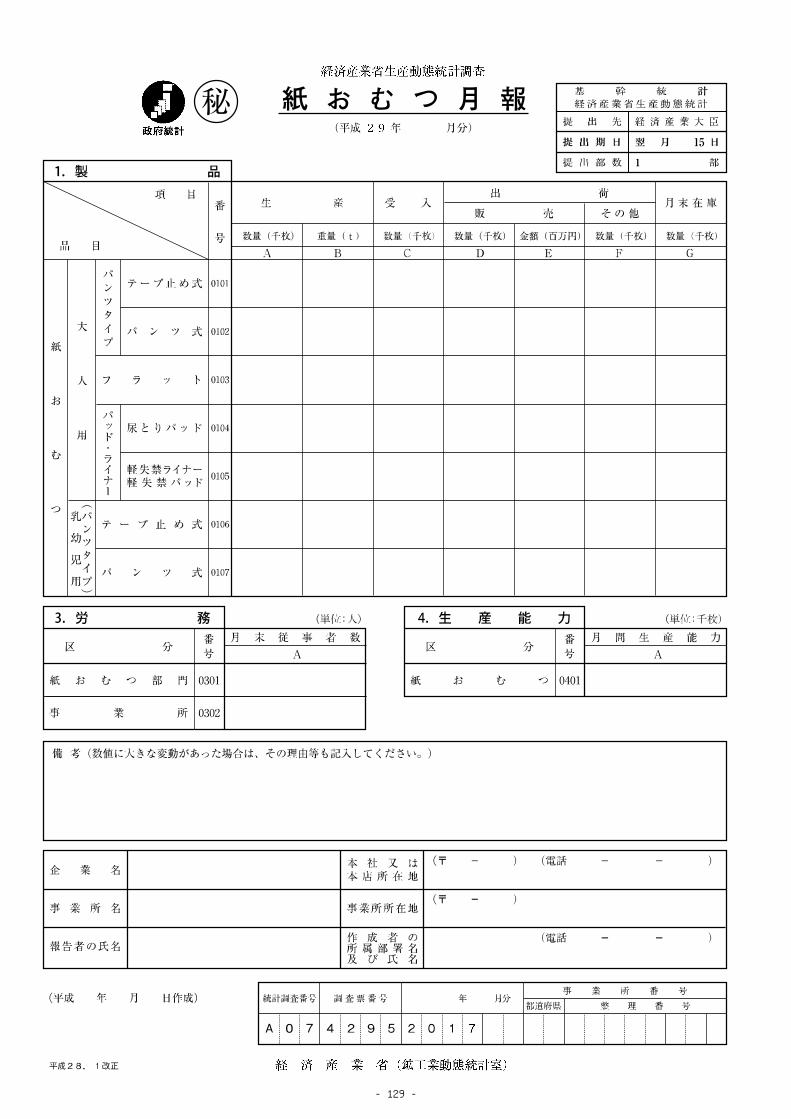
- 129 -
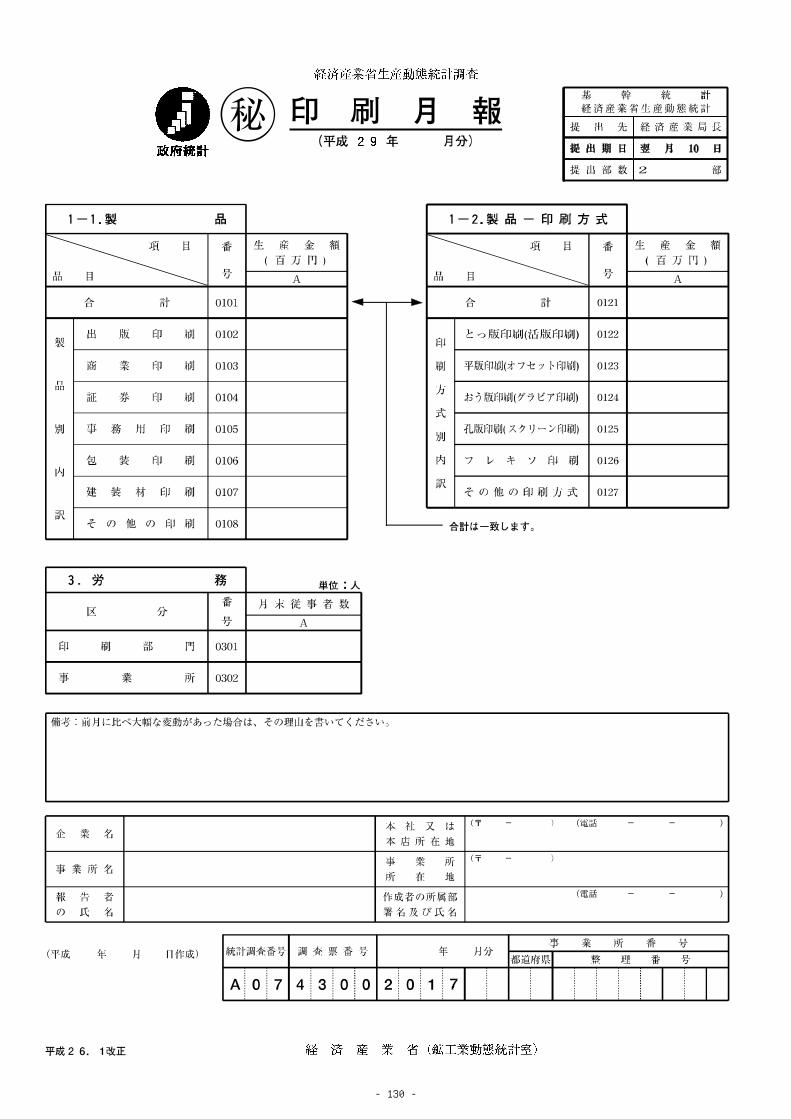
- 130 -
- 131 -
- 132 -
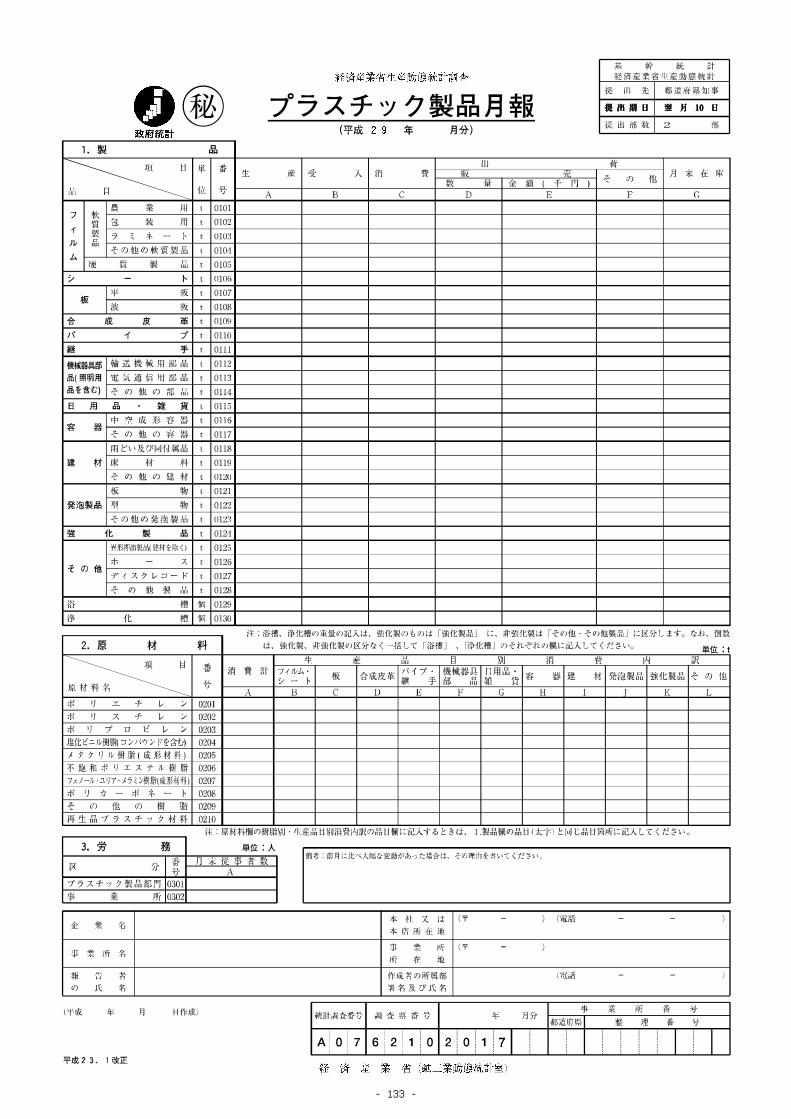
- 133 -
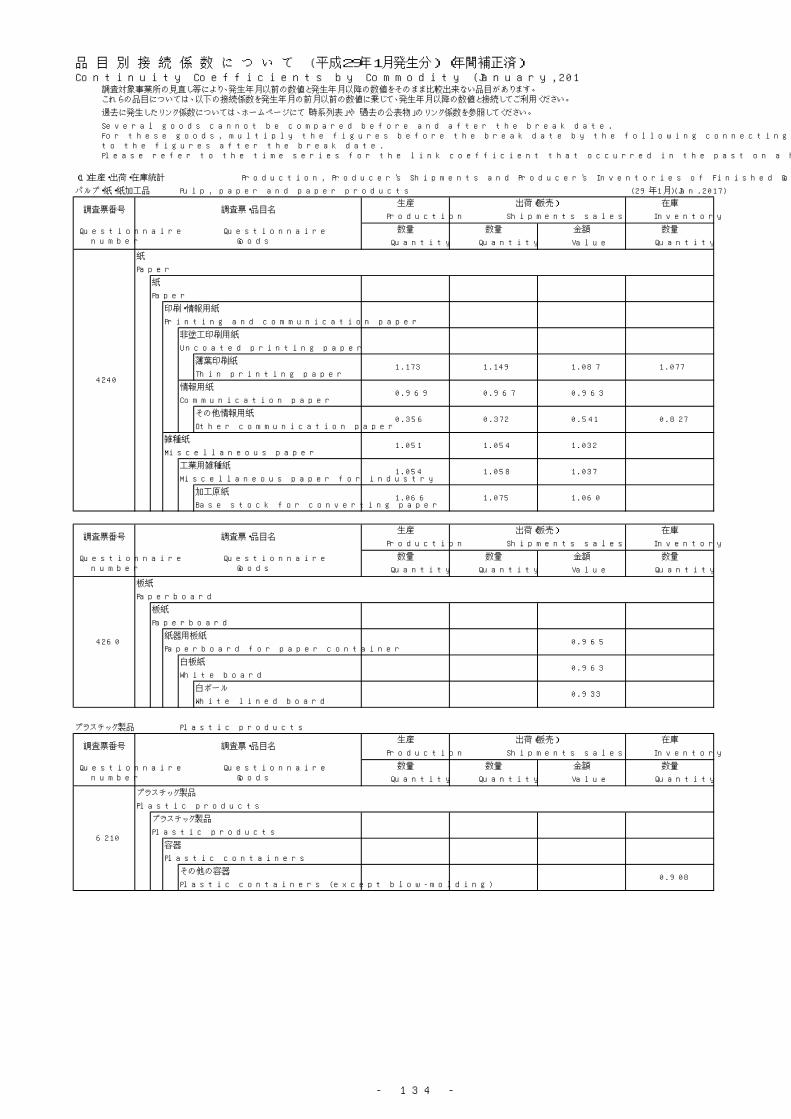
- 134 -
過去に発生したリンク係数については、ホームページにて「時系列表」や「過去の公表物」のリンク係数を参照してください。
(1)生産・出荷・在庫統計 Production, Producer's Shipments and Producer's Inventories of Finished Goods
パルプ・紙・紙加工品 Pulp, paper and paper products (29年1月) (Jan.2017)
紙
Paper
紙
Paper
印刷・情報用紙
Printing and communication paper
非塗工印刷用紙
Uncoated printing paper
薄葉印刷紙
Thin printing paper
情報用紙
Communication paper
その他情報用紙
Other communication paper
雑種紙
Miscellaneous paper
工業用雑種紙
Miscellaneous paper for industry
加工原紙
Base stock for converting paper
板紙
Paperboard
板紙
Paperboard
紙器用板紙
Paperboard for paper container
白板紙
White board
白ボール
White lined board
プラスチック製品 Plastic products
プラスチック製品
Plastic products
プラスチック製品
Plastic products
容器
Plastic containers
その他の容器
Plastic containers (except blow-molding)0.908
数量
Quantity
6210
生産 在庫
Production Shipments sales Inventory
Questionnairenumber
QuestionnaireGoods
数量 数量 金額
ValueQuantityQuantity
0.963
0.933
4260 0.965
Questionnairenumber
QuestionnaireGoods
数量 数量 金額 数量
Quantity Quantity Value Quantity
調査票番号 調査票・品目名生産 出荷(販売) 在庫
Production Shipments sales Inventory
1.054 1.058 1.037
1.066 1.075 1.060
0.356 0.372 0.541 0.827
1.051 1.054 1.032
1.173 1.149 1.087 1.077
0.969 0.967 0.963
数量
Quantity Quantity Value Quantity
4240
出荷(販売) 在庫
Production Shipments sales Inventory
Questionnairenumber
QuestionnaireGoods
数量 数量 金額
調査票・品目名調査票番号
品 目 別 接 続 係 数 に つ い て (平成29年1月発生分) (年間補正済)Continuity Coefficients by Commodity (January,2017) (After annual revision)
調査対象事業所の見直し等により、発生年月以前の数値と発生年月以降の数値をそのまま比較出来ない品目があります。これらの品目については、以下の接続係数を発生年月の前月以前の数値に乗じて、発生年月以降の数値と接続してご利用ください。
Several goods cannot be compared before and after the break date.For these goods, multiply the figures before the break date by the following connecting coefficients and connect these figuresto the figures after the break date.Please refer to the time series for the link coefficient that occurred in the past on a homepage.
出荷(販売)
調査票番号 調査票・品目名生産
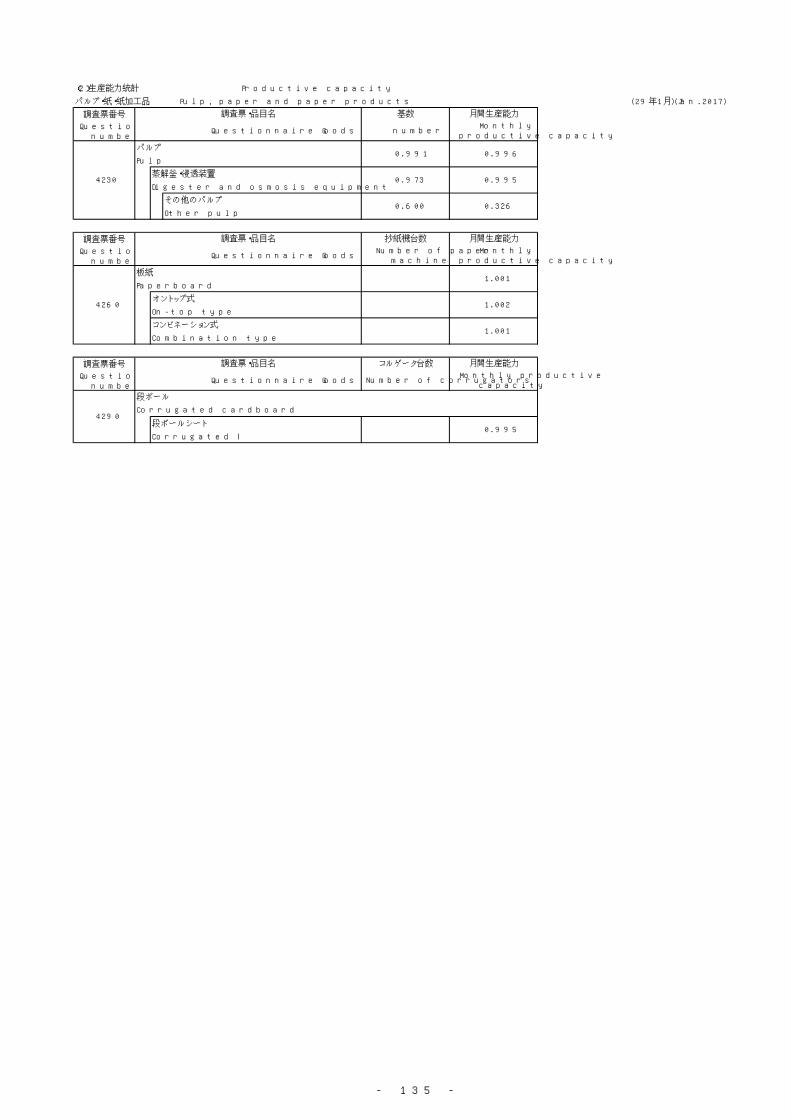
- 135 -
(2)生産能力統計 Productive capacity
パルプ・紙・紙加工品 Pulp, paper and paper products (29年1月) (Jan.2017)
調査票番号
Questionnairenumber
パルプ
Pulp
蒸解釜・浸透装置
Digester and osmosis equipment
その他のパルプ
Other pulp
調査票番号
Questionnairenumber
板紙
Paperboard
オントップ式
On-top type
コンビネーション式
Combination type
調査票番号
Questionnairenumber
段ボールシート
Corrugated board sheets
4290
段ボール
Corrugated cardboard
0.995
調査票・品目名 コルゲータ台数 月間生産能力
Questionnaire Goods Number of corrugatorsMonthly productive
capacity
4260
1.001
1.002
1.001
調査票・品目名 抄紙機台数 月間生産能力
Questionnaire GoodsNumber of paper
machineMonthly
productive capacity
4230
0.991 0.996
0.973 0.995
0.600 0.326
調査票・品目名 基数 月間生産能力
Questionnaire Goods numberMonthly
productive capacity


![[XLS] · Web view統計表9 統計表8 統計表7 統計表6 統計表5 統計表4 統計表3 統計表2 統計表1-3 統計表1-2 統計表1-1 総 数 (単位:千人) 傷 病](https://static.fdocument.pub/doc/165x107/5b0d33387f8b9af65e8d497a/xls-view9-8-7-6-5-4-3.jpg)